
Empfohlen
Weitere ähnliche Inhalte
Was ist angesagt?
Was ist angesagt? (9)
Ähnlich wie Governance Of Metropolitan Planning Organizations: Board Size, Composition, and Voting Rights
Ähnlich wie Governance Of Metropolitan Planning Organizations: Board Size, Composition, and Voting Rights (20)
Kürzlich hochgeladen
Kürzlich hochgeladen (20)
Governance Of Metropolitan Planning Organizations: Board Size, Composition, and Voting Rights
- 1. Alexander Bond and Jeff Kramer 1 1 Governance of Metropolitan Planning Organizations: Board Size, 2 Composition, and Voting Rights 3 4 5 6 Submission Date: 11/05/2009 7 8 Word Count: 6,575 (4,575 in text, 6 tables, 2 figures) 9 10 11 12 13 14 15 16 Corresponding Author: 17 18 Alexander Bond, AICP 19 Center for Urban Transportation Research 20 University of South Florida 21 4202 E. Fowler Ave, CUT 100 22 Tampa, FL 33620-5375 23 (813) 974-9779 24 Fax: (813) 974-5168 25 ALBond@cutr.usf.edu 26 27 28 Jeff Kramer, AICP 29 Center for Urban Transportation Research 30 University of South Florida 31 4202 E. Fowler Ave, CUT 100 32 Tampa, FL 33620-5375 33 (813) 974-1397 34 Fax: (813) 974-5168 35 Kramer@cutr.usf.edu 36 37 38
- 2. Alexander Bond and Jeff Kramer 2 1 ABSTRACT 2 Federal law requires that Metropolitan Planning Organizations (MPOs) be governed by a board composed 3 of local elected officials, modal authorities, and appropriate state officials. Other than this simple 4 requirement, Federal law is silent on board size, composition, voting rights of members, and advisory 5 committees to the board. This paper includes results from a survey of 133 MPOs about these topics. The 6 results show that a wide variety of board structures are in place, and each is crafted to accommodate the 7 intergovernmental politics of each region. The results found that the average MPO board had 16.1 voting 8 members and 3.1 non-voting members. Further, 27% of MPOs had at least one seat that rotated among a 9 group of eligible seat-holders. Only 13% of MPOs had a weighted voting scheme in place. Other results 10 discussed include non-voting board membership types, meeting frequency, and the existence of advisory 11 boards. Information on these topics will help MPOs compare themselves to their peers and understand 12 the breadth of options available to them during periods of organizational change.
- 3. Alexander Bond and Jeff Kramer 3 1 INTRODUCTION 2 The nation’s 385 Metropolitan Planning Organizations (MPOs) are responsible for planning and 3 programming transportation infrastructure in their region. MPOs are required by United States Code 4 Chapter 23 § 134(D)2 to be governed by a board consisting of local elected officials, representatives of 5 agencies that operate other modes of transportation, and relevant state officials. Actual board 6 composition is not set by Federal law or regulation. Further, Federal law is silent on nonvoting board 7 membership, the constitution of advisory committees, and voting rights of board members. MPO boards 8 are free to adopt bylaws regulating all of these topics. 9 Very little information is available on the governance structure of MPOs, which is in part due to 10 the sheer number of agencies. The research highlighted in this paper was conducted as part of a broader 11 project undertaken to fill the information gap on this and other MPO topics. The results offer a glimpse 12 into the standards of practice in place at MPOs today. The results also highlight the wide variety of 13 arrangements that have been crafted—often influenced by varying political interests in the metropolitan 14 area. 15 16 BACKGROUND 17 Board members are assigned to the MPO through three methods: ex officio appointment, appointment by 18 the executive branch, or selection by member local governments. Ex officio members receive a seat by 19 virtue of holding another position. For example, the chair of the transit authority may automatically be 20 given a seat on the MPO Governing Board. Ex officio members can be civil servants, elected officials 21 (by virtue of their seat on another board) or an appointed citizen (also by virtue of their role with another 22 agency). Ex officio seats can also lead to potential conflicts of interest, particularly if an employee is 23 placed on the board alongside their day-to-day supervisor. An example of this would be the airport 24 director who serves on the MPO board along with a county commissioner from a county that owns the 25 airport. 26 Board members can also be appointed by the executive branch, although this is the rarest of 27 methods to board membership. The most common executive appointment is from the state DOT. For 28 example, the state Secretary of Transportation may appoint a regional administrator to serve on the MPO 29 board. A handful of states have gubernatorial appointees on MPO boards, and these seats are usually 30 subject to legislative confirmation. 31 The majority of MPO seats belong to local elected officials. At MPOs with few local 32 governments, all elected officials might serve on the MPO. However, the number of available MPO 33 board seats is usually smaller than the number of elected officials in the MPO area. Therefore, board 34 seats are allocated to member cities or counties, and it is up to each jurisdiction to select representatives 35 from among its elected officials. The process for this selection differs among each local government. 36 Some local governments allow the MPO representative to be appointed by the mayor or chairman, while 37 others elect the MPO representative from among their ranks. In some cases, a specified seat always 38 serves on the MPO, such as when a county commissioner’s district falls within the MPO area, but other 39 districts do not. 40 Board members can lose their membership for a variety of reasons including term limits, 41 retirement, death, reapportionment of the MPO, revocation of appointment, leaving an ex officio post, or 42 losing an election. The member loses his or her MPO board seat concurrently with leaving an office for 43 any reason. There usually is no “term” of MPO board membership. Vacant seats can be filled 44 immediately. Adding to the difficult issue of turnover is staggering of election dates. Municipalities and 45 counties in the region often have different election dates or different office assumption dates. All of these 46 issues contribute to changes in MPO board membership. 47 48 METHODOLOGY 49 Information on MPO governance was collected as a part of a larger survey of MPOs regarding their 50 staffing and organizational structure. The survey consisted of 61 to 72 questions, depending on each 51 MPO’s characteristics. Approximately 10 questions related to MPO governance. Most questions left the
- 4. Alexander Bond and Jeff Kramer 4 1 opportunity for the respondent to explain his or her answer in narrative format in addition to fixed 2 responses. The survey instrument could be saved and returned to at a later time, allowing respondents to 3 consult with colleagues or retrieve needed materials before answering questions. 4 The research team drafted questions based on a review of MPO literature, experience with MPO 5 practice, and consultation with MPO experts. The survey data collection phase lasted approximately two 6 months during the spring of 2009. Participants were recruited in person, in print, and most importantly, 7 through electronic means. The survey was collected entirely online, using a portal website 8 (www.mposurvey.com) that directed respondents to a customized LimeSurvey system. The survey was 9 marketed to the staff directors of MPOs. Staff directors were free, however, to assign a subordinate to 10 complete all or part of the survey. 11 The rate of participation in the survey exceeded expectations, and yielded a very robust dataset. 12 A total of 133 complete responses were received, representing a 35.5% response rate. The dataset 13 qualifies as a valid sample, and has a margin of error of +/- 6.8%. Table 1 shows participation rates for 14 five classes of MPOs. These classes, although uneven in size, are important cutoffs for MPO structure 15 and policy-making. These classes are based on 2000 Census data and are used for analysis throughout the 16 paper. A handful of MPOs were not eligible to take the survey because they possessed a unique 17 organizational structure: a single agency produced planning documents for more than one MPO board. 18 This made direct data comparison impossible. Eleven MPOs hosted at four agencies were excluded from 19 the data set. If information from this group of MPOs was included, it would skew the data, because it was 20 impossible to separate which employees and resources were being dedicated to each MPO. 21 22 TABLE 1 Survey Participation by MPO Population Classification Population Class Total MPOs Eligible for Number Participating Percent Participation Survey 50,000-100,000 95 31 32.6% 100,000 to 200,000 96 29 30.2% 200,000 to 500,000 96 37 38.5% 500,000 to 1 million 43 13 30.2% 1 million or more 44 23 52.2% Total 374 133 35.5% 23 24 Results 25 The number of seats on each MPO Governing Board is first set during the designation of newly-formed 26 MPOs. After the initial designation, each MPO is free to adopt bylaws that dictate the number of seats 27 and voting rights on the governing board, although Federal regulations require a formal redesignation 28 process if the number of seats will change “substantially.” MPOs frequently will revisit the board seat 29 allocation after the results of each Census are released. State statute guides MPO board composition in at 30 least nine states, and in those cases MPO bylaws must conform to the statute in that state. 31 MPOs were asked to report the number of voting governing board seats by constituency. The 133 32 MPOs who responded have 2,142 total board seats. Extrapolating the data indicates there are 33 approximately 6,200 voting seats on MPO boards nationwide. 34 The mean number of board members is just over sixteen, although this number is higher than 35 other measures of central tendency. This indicates the presence of several high outliers. Many of these 36 high outliers were reported at MPOs hosted by regional councils, where the board governed both the 37 MPO and the regional council operations. 38 39 TABLE 2 Voting Board Size: Measures of Central Tendency Mean 16.1 Median 14 Mode 9
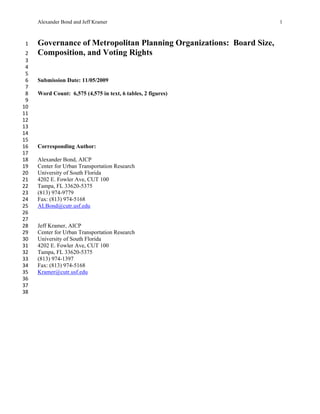
- 5. Alexander Bond and Jeff Kramer 5 1 2 Board size can vary widely. The smallest boards have only five members, while the largest in 3 this sample had seventy-three members. When ranked from largest to smallest, the top quarter have 19 or 4 more members while the bottom quarter of boards have eight or fewer members. Board size is very 5 dependent on the population of the MPO. MPOs with under 100,000 people in their planning area had a 6 mean number of board members around 9, while agencies with more than 1 million people had about 25 7 seats on the average board. Figure 1 summarizes the marked increase in board size as MPO area 8 populations grow. This is an expected result from the addition of new planning area territory, after which 9 the board must be expanded to include new local government representatives. 10 25.4 Number of Voting Board Seats 21.9 16.2 13.7 8.9 50k‐100k 100k‐200k 200k‐500k 500k‐1mill 1 million + 11 Population of MPO Planning Area 12 13 FIGURE 1 Membership size of MPO Governing Boards by population group. 14 15 There are a variety of people serving on MPO boards, although the vast majority of seats belong 16 to local elected officials—the first eligible category in Federal law. Since MPOs were created to 17 introduce local input in the transportation planning process, this is a result the research team expected. 18 Table 3 summarizes the frequency and allocation of MPO board seats. Municipal elected officials 19 (mayors, council members, or alderman) comprise the largest set of MPO board members, averaging 6.8 20 per MPO. County Commissioners (aka councilmember, selectman, or supervisor) hold the second most 21 seats, with an average of 2.9 per MPO. Seats that are not reserved, vacant, rotate among different types of 22 government, or are otherwise not defined average 1.7 seats per MPO. 23 The survey also asked if countywide elected officials were given a seat on the MPO board. These 24 positions were defined as individuals holding executive positions, such as a county executive, sheriff, 25 property appraiser, or county judge. About 30% of MPOs have such a person on their board, but the 26 average is just under 1 seat per MPO. 27 28 TABLE 3 Board Seat Allocation and Frequency
- 6. Alexander Bond and Jeff Kramer 6 Seat Type Percent of MPOs Average Number of with this Seat Type Seats Municipal Elected Officials 94.0% 6.8 County Commissioners 81.2% 2.9 State DOT 64.7% 0.9 Public Transit Agency 45.1% 0.6 Not Reserved 39.1% 1.7 Countywide Elected Official 30.1% 0.9 Regional Council 19.5% 0.2 Gubernatorial Appointee 17.3% 0.3 Aviation Authority 13.5% 0.2 Seaport Authority 12.0% 0.2 Private Sector 9.0% 0.3 Toll Authority 9.0% 0.1 School Board 6.8% 0.1 Tribal Government 6.0% 0.2 College or University 5.3% 0.1 Military Installation 3.0% <0.1 1 2 Federal law states that “appropriate state officials” should serve on MPOs. State officials serving 3 on boards can be divided into two categories: state Department of Transportation (DOT) officials and 4 gubernatorial appointees. State DOT officials are the third most common board member category— 5 nearly 65% of MPOs have a voting representative from their state DOT. On the other hand, gubernatorial 6 appointees to MPO boards are relatively rare. Only 17% of MPOs have one on their board, and in some 7 cases the appointee is a career service employee of the state DOT who is selected by the governor to 8 serve. 9 Modal transportation agencies are listed as an eligible board member in Federal law, but make up 10 only a small proportion of actual board members. Public transportation agencies are the most common 11 modal agency, and were represented on forty-five percent of MPO boards. Toll authorities are found on a 12 handful of MPO boards (9%). Seaport or aviation authorities can be found on about 10% of MPO boards. 13 Several respondents reported that since modal agencies in their region were owned and operated by a 14 municipal or county government, the agency was considered represented by county or municipal elected 15 officials and not granted an additional seat on the MPO. There are isolated examples of school boards, 16 tribal governments, college or universities, private sector representatives, and military installations 17 serving on MPO boards. 18 It may also be helpful to describe the seat types in aggregate. The pie graph in Figure 2 shows 19 the type of seat by percent of the total number of seats at all MPOs. Municipal elected officials occupy 20 42% of all board seats, with county commissioners filling another 18.2%. The number of elected officials 21 serving on MPO boards may rise to over 80% when seats “Not Reserved” are filled with extra elected 22 officials, and people holding elective office occupy ex officio modal seats.
- 7. Alexander Bond and Jeff Kramer 7 Percent of All Board Seats 8.0 1.9 3.5 Munipal Elected 5.3 County Commissioners 42.2 Not Reserved 5.3 State DOT Countywide Elected Public Transit Agency 10.6 Private Sector All Other Types 18.2 1 2 FIGURE 2 Aggregate percent of all board seats. 3 4 Voting Rights of Board Members 5 In many regions, intergovernmental politics and demographic differences mandate that the voting rights 6 of each board seat be different. Many MPOs do not have enough seats on the governing board to allocate 7 at least one to every member local government. One solution to this problem is for certain seats to 8 “rotate” among a set of member local governments. Among survey respondents, thirty-six of the 133 9 MPOs (27%) had at least one seat that rotated among member local governments. Although seat rotation 10 was found at MPOs of all sizes, the condition was most common at larger MPOs. Seat rotation may 11 become more necessary with larger regions, since new areas come into the MPO planning area or new 12 municipalities are formed. Table 4 shows the number and percent of MPOs in each population group that 13 have at least one seat that rotates. 14 15 TABLE 4 Governing Board Seat Rotation Frequency MPO Population Category Number Percent of this group 0-100,000 4 15% 100,000-200,000 5 17% 200,000-500,000 11 42% 500,000-1,000,000 3 23% 1,000,000 or more 13 57% 16 17 Some seat rotation arrangements prescribe the length of time or the office a person must hold to 18 occupy the seat. At one southeastern MPO, a board seat rotates every two years among the mayors of 19 three small barrier island municipalities. Other arrangements allocate a seat to a set of qualified local 20 governments, and let those governments choose their representative to the MPO. For example, one 21 pacific northwest MPO allocates one seat to the municipal league from an outlying county, and the league 22 is free to install or withdraw an elected official for that seat at any time. Other arrangements are even less
- 8. Alexander Bond and Jeff Kramer 8 1 formal—an MPO in the Great Plains reported one seat rotating between two small counties “at their 2 convenience.” Frequently, local governments who are rotated off the board will be assigned a non-voting 3 seat on the MPO board. 4 There is no requirement for every board member’s vote to count equally. Another solution to 5 balancing local intergovernmental politics is to adopt bylaws that allow a weighted voting scheme. 6 Weighted voting is relatively uncommon—it was found at only 13.5% of MPOs in this survey. There 7 does not appear to be a correlation between agency size and weighted voting. The most common method 8 for assigning weight to votes was by the population of the local government represented by the board 9 member. Several MPOs commented that although the MPOs bylaws laid out a weighted voting scheme, 10 it had never been exercised by the membership. 11 12 Non-Voting Board Membership 13 Non-voting board seats can be very helpful to MPO operations. Non-voting seats allow people who are 14 not qualified for full membership to be included in MPO discussions and communications, but since they 15 have no vote, they do not detract from local control of the process. 16 Eighty-four of the 133 MPOs (63%) in the survey reported having non-voting members on their 17 board. The average MPO had 3.1 nonvoting members. Among MPOs that had at least one nonvoting 18 member, the mean number was five. The presence of nonvoting members was spread evenly across 19 MPOs, but there tended to be more nonvoting seats on the boards of the larger MPOs. 20 Several dozen MPOs reported municipal and county elected officials serving as non-voting 21 members. These officials often represented small jurisdictions that did not qualify for an apportioned 22 voting board seat. In other cases, the elected officials were from jurisdictions that lie beyond the planning 23 area boundary, sometimes including jurisdictions in neighboring states. 24 Many MPOs grant the Federal Highway Administration (FHWA) Division and the Federal 25 Transit Administration (FTA) Region a non-voting seat on the board. Federal officers are excluded from 26 voting membership on the MPO, but representation by FHWA and FTA ensures that the MPO 27 proceedings are meeting the latest Federal expectations. Another frequently encountered non-voting 28 member was the chairperson of the MPO’s Citizens Advisory Committee. Citizen advisory committees 29 are discussed later in this paper. Some MPOs included minor transit operators (such as a paratransit 30 operators) as nonvoting members. 31 Some interesting examples of non-voting board members include: 32 • State legislators 33 • Chamber of Commerce representatives 34 • Chairs of adjacent MPOs 35 • Appointed city and county managers 36 • Career-service planning department directors 37 • Neighboring state DOT representatives 38 • Canadian and Mexican consular officers 39 • Rural transportation planning organization representatives 40 • State Departments of Environmental Protection representatives 41 • State or regional elderly service agency representatives 42 • Chairs of MPO advisory committees (freight, air quality, bike/ped, etc) 43 • Chairs of the region’s ridesharing/carpool agency 44 • School board representatives 45 • Seaport and airport authority representatives 46
- 9. Alexander Bond and Jeff Kramer 9 1 Advisory Committees 2 Advisory committees can play an important role in drafting MPO products and advising decision-making 3 at the governing board level. Unlike non-voting board members, advisory committee members are not 4 entitled to participate in the governing board meeting. Advisory committees provide recommendations to 5 the MPO Governing Board, help direct staff members, review proposed documents, and liaise with other 6 agencies and the general public on their issues of expertise. Typically an advisory committee has a 7 chairperson, and meets in person on a semi-regular basis. Advisory committees are not mentioned in 8 Federal law, but are sometimes required by state law. The frequency of MPO advisory committees is 9 shown in Table 5. 10 11 TABLE 5 MPO Advisory Committee Frequency Type of Committee Total Percent of all MPOs All Respondents 133 -- Technical Advisory 121 91% Bicycle and Pedestrian 59 44% Citizens Advisory 54 41% Transit 32 24% Transportation Disadvantaged 29 22% Air Quality 27 20% Congestion Management 25 19% Land Use 13 10% Freight 12 9% Corridor Management 9 7% Water 8 6% 12 13 Over 91 percent of MPOs maintain a technical advisory committee (sometimes dubbed TAC), 14 which is usually comprised of career-service employees of member local governments and modal 15 agencies. A TAC and its members can help board members to understand complex planning 16 methodologies and decipher MPO documents for their impact on each member’s constituents. A strong 17 TAC can provide leadership to MPO staff. Further, TACs can help facilitate the flow of local information 18 to MPO professional staff. 19 Other types of advisory committees are less common. Citizen advisory committees (CACs) are 20 found at 41% of MPOs. CACs are composed of non-expert citizens, often appointed by elected officials 21 or through an application process administered by the MPO. These committees are a powerful method of 22 collecting public input. They also assist board members in gauging the popularity of MPO proposals and 23 plans. Similarly, transportation disadvantaged advisory committees are found at about a fifth of MPOs. 24 Some MPOs have advisory committees devoted to one mode of transportation. A substantial 25 number of MPOs (44%) maintain a bicycle and pedestrian advisory committee. This group is often 26 charged with guiding or even approving the bicycle and pedestrian elements of all MPO documents. 27 Transit committees help guide the transit planning process within the MPO planning structure, and are 28 found at about a quarter of MPOs. Bike/Pedestrian, transit, and transportation disadvantaged committees 29 tended to be found more often at large MPOs, where these modes tend to be more developed. 30 Several MPOs reported forming ad-hoc committees to deal with specific issues. Some ad-hoc 31 committees were formed to direct cyclical documents, such as the long range transportation plan. Others 32 were formed to study a one-time issue, such as a corridor study. 33 34 Board Meeting Frequency 35 Federal law is silent on how often the MPO board should meet. Instead, individual MPO bylaws govern 36 these processes, although state statute may impose certain restrictions.
- 10. Alexander Bond and Jeff Kramer 10 1 2 TABLE 6 Frequency of Governing Board Meetings Frequency of Meeting Number Percent Monthly 72 54.1% Bi-Monthly 22 16.5% Quarterly 23 17.3% Semi-Annually 5 3.8% Other 11 8.3% 3 4 MPO boards are required by statute and rule to adopt six documents. The documents that must be 5 adopted are: a) long range transportation plan; b) transportation improvement program; c) unified 6 planning work program or simplified work plan; d) annual listing of obligated projects; e) public 7 participation plan, and f) a congestion management process (for MPOs in areas over 200,000 population). 8 Some of these documents must be updated annually, so the de facto minimum frequency of MPO 9 meetings is once per year. Table 6 summarizes the responses on how often the MPO board meets. The 10 most common meeting frequency is monthly, which was the practice at 54% of MPOs. A substantial 11 number of MPOs met less frequently. A handful met only twice per year, while 17% met quarterly and 12 another 17% met every other month. Eleven MPOs reported “Other” for this question, with several 13 explaining the MPO met “as needed.” 14 15 CONCLUSIONS 16 This study did not attempt to establish a “perfect” MPO governing board size or structure. Composing 17 the MPO board is a political process that must be customized to suit each region in a unique way. 18 Regions with many local governments may want to structure a large board, while an area with complex 19 transportation issues may desire one that has many seats for modal agencies. The important part is for 20 MPOs to understand the breadth of options available to them. Unless state statute guides MPO 21 governance, almost any board structure will pass muster under Federal law. 22 MPO board sizes have a considerable range, but were heavily focused in the area between nine 23 and eighteen members. This is a manageable size for even the smallest staff to administer, while at the 24 same time giving a voice to an appropriately diverse group. Extremely large boards–although impressive 25 in their comprehensiveness– may detract from the staff’s ability to work with individual board members 26 and unnecessarily dilute the value of each member’s time and effort. On the opposite side, extremely 27 small boards hold power too tightly and probably do not adhere to the original intent of Congress when 28 MPOs were created. Both extremes should be avoided unless they are necessary to strike an 29 intergovernmental political balance. 30 The survey showed that non-voting membership and rotating board membership are popular, 31 creative ways to be more inclusive in the transportation planning process. Non-voting membership 32 allows people not eligible for voting membership to fully participate in board level discussions. Rotating 33 board seats allow the very smallest of governments to have their voice heard at the very largest of 34 agencies. 35 Weighted voting is an oft-discussed topic in MPO circles (1). However, the survey revealed that 36 the presence of weighted voting is an exception to the rule, not the norm. Several MPOs that did have 37 weighted voting reported that it had never been used. Proper communication from professional staff, 38 early consideration of board member wishes, and thorough public involvement can virtually eliminate 39 divisive votes on the MPO floor. If no division is required, the utility of weighted voting is minimal, and 40 in fact promotes the “strong-arming” of lower-weighted members by higher-weighted ones. Further, an 41 MPO with voting seats for state officials or modal agencies will have difficulty designing a weighted 42 voting scheme. This is because it is difficult to assign weight to the votes of members who represent the 43 entire MPO area (such as a state DOT representative), or operate an agency that has no real boundary 44 (such as a port authority or transit agency).
- 11. Alexander Bond and Jeff Kramer 11 1 There is a relative lack of advisory committees across the country, with the sole exception of 2 technical advisory committees. Many MPOs that do support advisory committees reported the value of 3 receiving input in such a forum. MPOs have long struggled to involve the public in their activities (2), 4 yet less than half of MPOs have formed a citizen advisory committee. Forming a CAC is a simple way to 5 demonstrate a commitment to incorporate public input into the transportation planning process—and to 6 communicate in the opposite direction. 7 Subject committees were even less frequently encountered. These committees help bring 8 important issues to the MPO’s attention, and can be a source for ideas in solving problems. Freight and 9 land use are prominent issues today, yet committees dedicated to these issues were very rare. Freight and 10 goods movement is specifically mentioned in the planning factors of SAFETEA-LU, and effective 11 planning requires close coordination with the private sector. Similarly, planning literature strongly 12 suggests a close coordination between land use and transportation. Both freight and land use planning 13 could be advanced through dedicated advisory committees. 14 Committees dedicated to congestion management or air quality were found only at a fraction of 15 the MPOs that are required to maintain a Congestion Management Process to conduct an air quality 16 conformity analysis. Given their prominence in federal law, subject areas like transit and transportation 17 for the disadvantaged could be better integrated into the MPO process through an advisory committee 18 process. All of these are important issues that need the attention of stakeholders who want to be a part of 19 the solution. The only subject committee type that appeared on a comparatively frequent basis was 20 bicycle/pedestrian advisory committees. The reason for this is unclear, but other studies have shown that 21 bike/pedestrian planning is at a more advanced stage of integration in MPO plans than transit (3). 22 Perhaps this is one reason why bike/pedestrian committees are more common. 23 Until now, little was known about the size and composition of MPO governing boards. The 24 results of the research described in this paper should help MPOs compare themselves to their peers. 25 Certain MPOs may decide to revisit their board size, composition, and voting structure. Bringing reform 26 to the governance of the MPO can help reshape the mission, scope, and public acceptance of the agency. 27
- 12. Alexander Bond and Jeff Kramer 12 1 ACKNOWLEDGEMENT 2 3 The results presented in this paper were generated through a grant awarded by the Federal Highway 4 Administration. The contract was awarded through the Surface Transportation and Environment 5 Cooperative Research Program (STEP). Contract # DTFH61-08-C-00021 6
- 13. Alexander Bond and Jeff Kramer 13 1 2 REFERENCES 3 4 (1) Federal Highway Administration/Federal Transit Administration Transportation Planning Capacity 5 Building Program (TPCB), “Peer Exchange Report: Best Practices for Small and Medium Metropolitan 6 Planning Organizations.” Ft. Smith, AR: April 18-20, 2004. Available from: 7 http://www.planning.dot.gov/Peer/Arkansas/arkansas.htm 8 9 (2) Goode, Larry, Joseph Milazzo, Justin McCurry, Krista Tanaka, Brad Forbis, Stacie Hill, Jacob 10 Garrison, and Nicholas Guidice, “Analysis of the Governance of Metropolitan Planning Organizations in 11 the United States for Potential Applications in North Carolina.” Raleight, NC: Institute for 12 Transportation Research and Education. Report # FHWA/NC/2002-019. December 2001. Available 13 from: http://www.ncdot.org/doh/preconstruct/tpb/research/download/PPF-0100FinalReport.pdf 14 15 (3) Bond, Alexander and Jeff Kramer, “The 2008 Review of Florida’s Long Range Transportation Plans.” 16 Tampa, FL: Center for Urban Transportation Research. October 2008. Available from: 17 http://www.mpoac.org/documents/LRTP_Review.pdf 18