
Empfohlen
Empfohlen
Weitere ähnliche Inhalte
Andere mochten auch
Andere mochten auch (20)
Ähnlich wie Huete Training Phenology Kku
Ähnlich wie Huete Training Phenology Kku (20)
Huete Training Phenology Kku
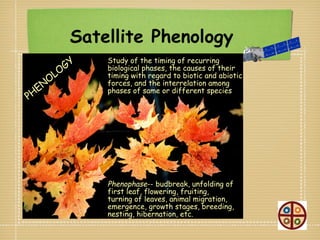
- 1. Satellite Phenology GY Study of the timing of recurring biological phases, the causes of their LO timing with regard to biotic and abiotic O EN forces, and the interrelation among phases of same or different species PH Phenophase-- budbreak, unfolding of first leaf, flowering, fruiting, turning of leaves, animal migration, emergence, growth stages, breeding, nesting, hibernation, etc.
- 2. The upper panel (A) shows molar extinction coefficient spectra for mixed carotenoids, chlorophyll a+b and anthocyanin. Lower panel (B) shows representative leaf reflectance spectra for yellow, red and green L. styraciflua leaves Sims & Gamon, 2002, Remote Sens Environ. 81, 337.
- 3. Deterioration of leaf reflectance - Leaf Age - Nutrient deficiencies - Pests/diseases
- 4. Introduction • Phenology (greek word phaino; to show or to appear) is the study of periodic biological evebts as influenced by the environment. It includes the timing of biological events, particularly in response to climatic changes to the environment. Sprouting and flowering of plants; color changes of leaves in autumn, insect hatches, hibernation, bird migrations Certain biological events, such as the time of the start of the growing season, have a key role in changing land surface/atmosphere boundary conditions such as surface roughness, albedo, humidity, etc. The phenology of ecosystems and its connection to climate is a key to understanding ongoing global change. – Phenology has historically been studied as direct observations of the timing of leaf opening, flowering, leaf fall and such events.
- 5. Phenology Phenology “reflects” the interactions (responses, feedbacks) of organisms with their environment, Phenologic variations depict a canopies’ integrated response to environmental change and influence local biogeochemical processes, photosynthesis, water cycling, soil moisture depletion, and canopy physiology, Phenology is an important indicator of climate change, global change, and disturbance (anthropogenic signal), Phenological data and models are used in agricultural production, drought monitoring, wildfire risk assessment, archaeology, and treatment of pollen allergies.
- 6. Phenology is an essential component of the biosphere Adapted from Bonan (2002) Ecol. Climatology
- 8. Global Change Influences & is Influenced by Phenology lc ycle na easo n of s c atio p lifi Am ial str te rre tes iple ula ult od t m m a les gy les olo yc l sca n he on c tia P b spa r ca por al & tem
- 9. NPN Network Structure Increasing Process Knowledge Decreasing Spatial Coverage USA-NPN Vision Statement USA-NPN will provide phenological information that can be used to understand the role of the timing of life cycle events in the biosphere. It will establish a nationwide network of phenological observations with simple and effective means to input, report, and utilize these observations, including the resources to provide the right Adapted from CENR-OSTP information at the right time for a wide range of decisions made routinely by individual citizens and by the Nation as a whole. USA-NPN Implementation Team 4/16/06 TERRA Dec. 18, 1999
- 16. Additional metrics can be derived from the annual VI cycle Seasonal integrated NDVI
- 17. 1989 1990 1991 1992 1993 1994 1995 1996 1997 1998 1999 2000 Annual summaries of the metrics can be created to assess interannual trends 2001
- 18. North America Phenology Analysis MODIS NDVI MODIS Land Cover Product North America Eurasia
- 24. Atmospheric and Sensor noise
- 25. Atmospheric and Sensor noise • Cloud contamination – throughout composite period – sub-pixel clouds • Illumination angle and viewing geometry • Atmospheric aerosols
- 26. Atmospheric and Sensor noise • Cloud contamination – throughout composite period – sub-pixel clouds • Illumination angle and viewing geometry • Atmospheric aerosols • Water vapor, haze, other contaminants
- 27. Atmospheric and Sensor noise • Cloud contamination – throughout composite period – sub-pixel clouds • Illumination angle and viewing geometry • Atmospheric aerosols • Water vapor, haze, other contaminants • Sometimes unreliable calibration
- 34. What aspect of the vegetated land surface are we measuring? DMA – first sustained flush of greenness? Half-max – primary leaf expansion? Greatest Increase – early season growth peak (perceived spring)? Inflection pt. – environmental conditions preceding first flush? …what biophysical phenomena should be represented? Application specific.
- 35. Phenologic-optical Changes in Tropical Forests • Leaf aging • Epiphylls • Litterfall • Leaf flushing & expansion • Leaf density, exposed wood & soil • Canopy shade, light & gaps • Leaf water stress • Upper and lower leaves Bohlman et al., Biotropica 30 (1998)
- 36. Use r-Defined P lace h olde r Te xt
- 37. East- West Transect (seasonal dry to perhumid) In this study we examine disturbance & regenerating forests and a north-south transect from humid rainforest - ecotone- cerrado
- 38. At the landscape level, many climate and growth models characterize tropical rainforests as having no seasonal variation in vegetation dynamics. Much of what is known about tropical forest seasonal vegetation dynamics comes from the AVHRR data, in which the phenology is often characterized as “flat”.
- 39. MODIS EVI DOY 177
- 40. MODIS Phenology Peak Date 300 350 Rainfall (mm) 250 Sakaerat 300 Bukit Soeharto Rainfall (mm) 200 250 150 200 150 100 100 50 50 0 0 1 2 3 4 5 6 7 8 9 10 11 12 1 2 3 4 5 6 7 8 9 10 11 12 Month Month
- 41. Summary The right combination of spectral, spatial, and temporal detail are needed for improved tropical forest phenology characterization for use in carbon and production models. More intense drought periods, combined with land degradation, may stress these ecosystems beyond a threshold resulting in the widespread forest drying with wildfires becoming a more dominant force. The dynamics and interplay of climate change, land-use activities, and socio-ecologic sustainability will largely determine the fate of these biologic rich ecological systems.
Hinweis der Redaktion
- This is in part due to the complexity of tropical forest canopies, where a highly diverse tree species population can result in a wide variety of phenology responses to the same or common environmental factors, such as rainfall, temperature, and photoperiod (Wright and Schaik, 1994; Reich et al., 2004; Prior et al., 2004; Kushwaha and Singh, 2005). Satellite observations with high temporal frequency AVHRR measurements are also constrained by poor spatial resolution (>4 km), limited spectral content with low optical depth of penetration through densely vegetated forest canopies, cloud contamination, and sensitivity to seasonally variable atmosphere water vapor and aerosol conditions , resulting in low spectral sensitivity for tracking temporal and spatial variability in tropical forest characteristics, including phenology (Goward et al., 1991; Kobayashi and Dye, 2005). Kobayashi and Dye (2005) found strong seasonal signals from clouds and aerosols in the AVHRR- normalized difference vegetation index (NDVI) data sets over the Amazon, which dominated the relatively weak ヤapparentユ seasonal signal from the tropical forests themselves. The NDVI essentially becomes メsaturatedモ and insensitive to the chlorophyll signal, forest biophysical properties, and more subtle phenology characteristics (Skole and Qi, 2001).