Carbon Benefits Kds
•Als PPTX, PDF herunterladen•
1 gefällt mir•254 views

The document describes a land health surveillance framework to monitor and evaluate land degradation and agroforestry interventions. The framework uses a stratified, randomized sampling approach with sentinel sites, clusters, and plots to collect biophysical data on vegetation, soils, and carbon stocks. Field measurements include woody cover assessments, soil sampling, and allometric methods to estimate biomass and carbon. The goals are to establish baselines, monitor changes over time, target priority areas for interventions, and evaluate outcomes.

Empfohlen
Empfohlen
Weitere ähnliche Inhalte
Was ist angesagt?
Was ist angesagt? (9)
Andere mochten auch
Andere mochten auch (8)
Ähnlich wie Carbon Benefits Kds
Ähnlich wie Carbon Benefits Kds (20)
Mehr von World Agroforestry (ICRAF)
Mehr von World Agroforestry (ICRAF) (20)
Kürzlich hochgeladen
Kürzlich hochgeladen (20)
Carbon Benefits Kds
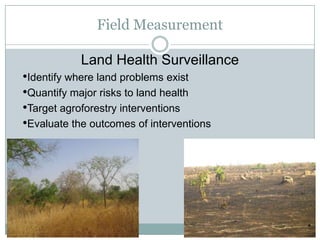
- 1. Field Measurement Land Health Surveillance •Identify where land problems exist •Quantify major risks to land health •Target agroforestry interventions •Evaluate the outcomes of interventions
- 2. Field Measurement Land Degradation the Surveillance Framework Designed to provide; biophysical baselines at landscape level (vegetation, soil condition) a monitoring and evaluation framework
- 3. Sentinel Site Surveillance Framework a spatially stratified, hierarchical, randomized sampling framework Sentinel site (100 km2) 16 Clusters (1 km2) 10 Plots (1000 m2) 4 Sub-Plots (100 m2)
- 4. LDSF sampling plot (1000 m2) with sub-plots (100 m2) •Fast •Repeatable •Functional, interpretable •Applicable everywhere •Widely tested •With local communities
- 5. Shrub biovolume by block & cluster UNEP-ICRAF West Africa Drylands Project
- 6. Intervention Targeting Priority afforestation intervention area (ha) based on woody cover ratings for each cluster (100 ha) Clusters in red have high priority due to high inherent degradation risk UNEP-ICRAF West Africa Drylands Project
- 7. Allometrics •Biovolume to biomass to C • Trees, shrubs, Species • Belowground woody biomass • Tapering coefficients; fractal branching •Infrared spectroscopy for wood moisture and density Improved wood density databases Protocols for local calibrations
- 8. Trace Gases N2O emissions in AF systems with N-fixing trees Sumatra N2O(Kg-N ha-1 y-1) Cleared Forest Coffee Shade land Coffee
- 9. Trace Gas Measurements Small chambers will be used to measure the fluxes of N2O, CO2 and CH4 to generate default factors for N2O and to estimate the soil respiration flux under different land uses
- 10. Soils Measurement Infrared Spectroscopy for rapid soil characterization • Rapid • Reproducible • Low cost • Predicts soil carbon &functional soil properties
- 11. Soil infrared spectroscopy labs VNIR Salien Sotuba Tanzania Mali FT-NIR ICRAF reference and support lab Nairobi FT-MIR Maputo Chitedze Mozambique Malawi Future locations
- 12. Digital mapping of soil carbon Local (site-level) Cref 10 km UNEP-ICRAF West Africa Drylands Project
- 13. Test site – Western Kenya Western Kenya Integrated Ecosystem Management Project
- 14. A Globally Integrated African Soil Information Service Over the course of four years farmers, extension services, planners, the private sector, policymakers and scientists will have freely available, web-enabled access to a globally integrated, evidence-based, and dynamic soil health information service that provides management, planning and policy-relevant soil information for the non-desert portions of Sub-Saharan Africa. AfricaSoils.net CIAT-TSBF, Earth Institute at Columbia University, World Agroforestry Centre, International Soil Reference Information Centre With support to CIAT-TSBF from Bill & Melinda Gates Foundation and Alliance for a Green Revolution in Africa
- 15. Randomization of Sentinel Site locations stratified by climate
- 16. Digital mapping of C (covariates, scales)
Hinweis der Redaktion
- Compared to forests, shade coffee systems with N fixing overstory emits more than 5 times as much N2O. This is equivalent to 2 t CO2e more GHG emission than the forest or 1.4 t CO2e more than the average of the other land use systems.. The plots marked coffee are a chronosequence, 1,3,7 and 10 years since planting. The Shade coffee was converted 18 years before the measurement. Whenever N fixing trees are planted on clayesy soils with adequate P, significant N2O emissions can be expected.