Project References Transportation Industry
•
0 gefällt mir•769 views

Compilation of some of my projects in the transportation industry

Empfohlen
Empfohlen
Weitere ähnliche Inhalte
Was ist angesagt?
Andere mochten auch
Andere mochten auch (14)
Ähnlich wie Project References Transportation Industry
Ähnlich wie Project References Transportation Industry (20)
Kürzlich hochgeladen
Kürzlich hochgeladen (20)
Project References Transportation Industry
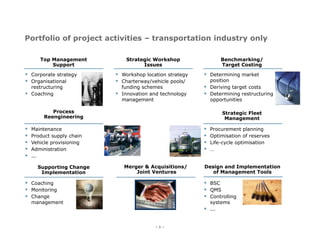
- 1. Portfolio of project activities – transportation industry only Top Management Strategic Workshop Benchmarking/ Support Issues Target Costing Corporate strategy Workshop location strategy Determining market Organisational Charterway/vehicle pools/ position restructuring funding schemes Deriving target costs Coaching Innovation and technology Determining restructuring management opportunities Process Strategic Fleet Reengineering Management Maintenance Procurement planning Product supply chain Optimisation of reserves Vehicle provisioning Life-cycle optimisation Administration … ... Supporting Change Merger & Acquisitions/ Design and Implementation Implementation Joint Ventures of Management Tools Coaching BSC Monitoring QMS Change Controlling management systems ... –1–
- 2. Project Example: Workshop location strategy –2–
- 3. Workshop location strategy and optimisation of vertical integration TOC1 TOC2 Economic and qualitative Rolling Stock 64 Rolling Stock 47 advantages of workshop co- Staff Workshop 17 Staff Workshop 15 operation of four TOC was Performance Km 2,9 Performance Km 2,0 assessed in Mio km in Mio km Broad scope of possibilities had Town A 37 km Town D to be included into analysis 13 km 30 km Calculation of synergies had to 22 km consider all aspects (running Town B 23 km 10 km costs, investment and TOC4 TOC3 Town C divestiture, IT-support, Rolling Stock 123 Rolling Stock 32 integration of supplier …) Staff Workshop 29 Staff Workshop 6 Main point was to identify Performance Km 6,0 Performance Km 0,9 in Mio km optimal location strategy in Mio km ? Centralised Maintenance Facility ? Integration of resources Pooling of Resources Advantages in Procurement ? ? –3–
- 5. Crucial information about the quot;right strategic set-upquot; can be derived by comparing capacities spent on maintenance categories Does TOC2 have the right strategy (significantly What are the reasons for higher effort on TOC4's higher effort on preventive as well as on corrective maintenance? FTE per vehicle corrective maintenance)? unit (indexed) 200% preventive mainte- 175 nance 125 100% 77% 77% 69% 75 25 -25 -75 -125 100% 100% + x 143% corrective -175 mainte- 170% nance -225 216% TOC1 TOC1 TOC2 TOC3 TOC4 Plan –5–
- 6. Example: significantly higher lifespan of major components gives VU1 an advantage [Tkm] Frequencies of different preventive maintenance actions* 1500 1.200 1.200 1.200 1.000 1000 800 600 500 500 500 500 500 400 300 280 185 100 0 Bogies Motors Compressors Couplers Brakes 1 2 3 3 3,5 4 5 4 4 5 5,5 VU 1 9 VU 2 10 10 VU 3 12 12 12 [Years] * unmounting, check, cleaning, painting, mounting –6–
- 7. Project Example: Process reengineering and restructuring –7–
- 8. A flexible three phase approach to optimize productivity, quality and costs has been used in all relevant projects Development of Positioning and Implementation of restructuring plan based target costing restructuring plan on detailed analysis Thorough benchmarking Design client specific Real, hands-on of action plans per sub- implementation function maintenance Develop realistic productivity Maintenance roadmap for action efficiency of the supply Administration chain Supply Change Supply managers quality Project planning, timing, volumes and Take responsibility Normalisation of structural cost drivers and priorities per function Deliver against performances parameters milestones Close co-operation Target costing per with all stakeholders (e.g. workshop managers, Effective transition to the function business owners unions etc.) Extensive international Employing an effective set Rigorous project experience with high class of improvement measures governance & performances and tools change management capabilities –8–
- 9. The improvement of central maintenance processes typically realise substantial savings of 20 – 40% ... Example: Redefining maintenance scheme X Step 1 Step 2 Step 3 Optimisation of Differentiation of Further differentiation workshop and planned maintenance of planned activities operations interfaces activities for each after refurbishing to clarify component several components responsibilities (different parameters Utilisation of root- influencing compo- Avoiding redundancy of cause analysis based nent lifetimes) workflows on failure statistics to Optimisation of monitor vehicle component-related performance processes and overall workflow Supporting Implementing modern instruments like planned process/task times activities: Optimising workshop controlling to ensure valid/sound data –9–
- 10. ... and the complete reengineering of important processes to stream-line process flow, realises additional savings of 10–20% 7 + 4 8 + 4 + 7 Inside and outside of vehicle 2 5 5 5 + 9 9 4 + 6 + 11 Legend: + + 1. Check v-belt, 1 Part clamp or renew A/C on demand + W1.1 2. Check + refill 4 grease, oil, cooling water 12 3. Check+ refill centralised Part lubrication 13 + 15 Battery + 7 + 4 10 7 4 + 3 12 2 4. Grease cardan- W1.1.2 shaft, bearings, articulations, locks 5. Check interior decoration 3 + 4 3 Start 6. Check driver's seat, retightening on End demand 7. Retightening of wheel nuts with torque spanner 8. ... 3 + 4 3 Below vehicle Start – 10 –
- 11. Process analysis of preventive maintenance - example - number of mechanics: 1 Process time % of total time work time: 49 min ca. 60% set-up time: 25 min ca. 30% Suggested Improvements personal time: 8 min ca. 10% Picking material in advance Optimising of process work total time: 1h 22 min flow: defining specific work flow (order of things that need to be done) First perform preventive maintenance – than Optimised process time corrective jobs (as far as necessary) work time: 49 min Use the right tools set-up time: 10 min personal time: 5 min total time: 1h 4min Reduction of process time ~ 20% – 11 –
- 12. In the same way, other processes like quot;cleaning and shuntingquot; have been analysed and optimised Example bus 5 shunting 4 3 Parking lot 2 1 shunting (5 min) shunting cleaning (6-7 min) fuelling (4 min) walking 6 temporary parking space – 12 –
- 13. Improving service-quality factors such as quot;Punctualityquot; requires a comprehensive analysis of a complex network of interdependencies 1a Planning Environ- Capacity Capacity ment Meet utilisation utilisation deadlines junctions lines Share of amend- ments Punctuality Time table Fixed including running failures times 1b Planning during 2 Operations period Departure- Share of Additional traffic Excess dwell punctuality cancelled supply (capacities times 1. station trains of tracks / hubs) Share of partly Secured cancelled connections trains 3 Rolling stock 4 Infrastructure Availability of Availability of Delay due to Availability of rolling stock resources constructions infrastructure sites – 13 –
- 14. In the assessment of operational processes influencing punctuality, key process drivers have to be taken into account Factor Quality driver Environmental impact Process to specify manual measurement has already to be running times Nav-system/GIS-systems considered when defining running Capacity Permanent up date times: utilisation Ideal running junctions Differentiation of Definition of intervals time vs. running running times time under Separation into the type of quot;Defined days operational running conditions timequot; Transfer relations Weather Connections conditions Definition of dwell times Passenger volume Quality of Capacity measurement utilisation lines Definition of turnaroung Technische Definition of Mindestwendezeiten turnaround times Betriebliche Mindestwendezeiten Sicherheitswendezeiten bei Interlining – 14 –
- 15. Availability of rolling stock as a key factor influencing punctuality is driven by various parameters and business processes Factor Quality driver Information flow driver-control centre-workshop Responsibilities Fault management Procedures of changing trains Availability of staff Work time organisation HR-development (qualifications) Availability Investment planning rolling stock Availability of resources (material, rolling stock …) Asset management Tender specification Beschaffungsplanung Fleet management Investitionsplanung Reservemanagement – 15 –
- 16. Project Sample: IT-Structure, IT-Processes & Management Tools – 16 –
- 17. The objective has to be a simple and standardized dataflow in all workshops Dataflow model for all workshop locations Additional personnel data Work- and work- Standardized GUI (vacation, illness etc.) order times in the entered by work-order workshops personnel Operational Data Question of interfaces Data interface SAP-CO SAP-PM SAP-HR or (for distribution) Booking of work-order SAP-MM materials System of parents System of parents Warehouse/ Procurement Data The handling and distribution of the personnel data will probably constitute the most difficult problem during implementation – 17 –
- 18. In order to implement such a dataflow model a comprehensive IT-plan has to be devised Phase 1 Phase 2 Phase 3 Determining the Determining the Drafting of an requirements required investment implementation plan Of particular concern e.g.: Hardware (if necessary Definition of project Work-order preparation adaptation/expansion) milestones (SAP-configuration) Software content Cause of failure Quantification of training time recording effort Constituting Work-order recording External implementation implementation teams Barcode system support and defining time- Operational data to schedule per team adjust/validate maintenance strategy Interfaces to other IT- systems (system integration) Training of personnel The existing IT-plan has to be validated and, if necessary, altered in accordance with the criteria above Implementation of IT transformation expected in 2007 – 18 –
- 19. Companies should implement a feed back loop in their workshop IT-landscape to ensure up-to-date maintenance strategies Definition of content and intervals Failure Preventive maintenance Corrective maintenance Inspection Service Diagnosis No failure Failure Correction Failure statistics Periodic check of Root cause analysis requirements Technical improvements Documentation – 19 –
- 20. To supervise maintenance strategies and workshop activities, we design/implement performance-based IT-controlling systems Project example: MDBF (quot;Mean Distance Between Failuresquot;) MDBF – vehicle A, type A, MDBF – component 1 component 1, ... type A ... MDBF – vehicle ... type A ... MDBF – safety- ... relevant ... MDBF – passenger- affecting MDBF – ... non-safety- ... relevant MDBF MDBF – ... safety- ... MDBF – non- relevant passenger- affecting MDBF – ... non-safety- ... relevant Executive level, controlling, Head of workshop, Technical office, head of workshop technical office foreman – 20 –
- 21. The following IT-based work-order/personnel data recording and handling process is best suited for all workshops 1 2 3 IT-recording of employee times IT-Recording/Validation of IT-Validation (on sample) (Work, Overtime, work-order vacation, illness etc. of recorded data etc.) (barcode assisted) Data entry Responsibility Data entry Responsibility Data entry Responsibility Mechanic work-order leader team leader work-order leader workshop head workshop head The mechanic records his Validation checks of Direct overview of the time at a terminal using a recorded personnel times levels of all personnel time- barcode system only via samples accounts Autom. alteration of data if Additional validation Data recorders also have e.g. shift-change of usual checks of recorded times the right to sign-off on work-time from ... till ... on a sample basis vacation, illness etc. through work-order Reducing overtime leader/workshop head Paperless IT-archiving of (< 1 day) after team utilising daily SAP- vacation requests, medical leader agrees using the reporting records using e.g. PDFs time-recording terminal for recording The envisioned process flow requires a specific profile of system access rights in SAP for the process owners – 21 –
- 22. The optimised process of IT-based time and work-order recordings should be as follows Login at terminal via card reader using e.g. employee number Entry of work-order/notification number using barcode Existing work-order? yes no Entry work-time Selecting notification short content if not already Assigning materials to work- text already if necessary selection of recorded at the order prepared in failure code warehouse system Additional yes entry? Entry work-time no Assigning materials to if not already Logout notification recorded yes Additional entry? no Logout – 22 –
- 23. A sound failure management system is based on standardized processes (incl. triggers) and flow of information Driver calls in failure Escalation-level 1: quot;Remote diagnosticsquot; and attempt to remove failure through Control-centre Escalation-level 2: Attempt to remove failure Control-centre through mobile operations manager Decision of whether to exchange vehicle (Escalation-level 3) vehicle continues Has vehicle to be yes no towed? Until the yes no end of the yes no line? workshop is workshop is vehicle continues Control-centre informed informed until end of day organises vehicle exchange towing vehicle towing vehicle driver hands over leaves leaves failure card new vehicle is workshop new vehicle is sent out is informed sent out defective vehicle defective vehicle workshop enters workshop enters workshop is informed defective vehicle enters workshop Repairs Repairs Repairs Repairs – 23 –
- 24. The information flow of the failure management system's processes has to be properly mapped into the IT-system Data flow diagram Driver calls in failure if on-board diagnostics can be directly linked into a Control-centre digital radio service timely entry (e.g. failure code in SAP-PM) of faliure data through Control-centre (in particular in case of vehicle Digital operational exchange) log for management of vehicle Workshop is informed (work- movements and positioning, if order leader or mechanics on present call) SAP-PM Workshop Cell of on-call management system mechanics SAP-HR – 24 –
- 25. Project Sample: Asset renewal strategy – 25 –
- 26. Comprehensive improvement of capital costs plus process improvements lead to realistic savings of 10 – 15% Optimising Fleet Optimising Standardisation Structure Procurement Optimise investment Standardisation of Price benchmarks strategy at a minimum vehicle equipment of total costs Package pricing of Homogenous fleet quot;extrasquot; Optimising vehicle lifetimes Adaptation of vehicle Adjustment of level of standards to detail of the tender to quot;Best practicequot; vehicle requirements appropriate level reserve Conditions for Reduction of fleet size warranties (subsequent to optimisation of reserves) Economies of scale in procurement interaction Optimal replacement time Homogeneity of fleet – 26 –
- 27. Example: Calculation of optimal economic asset lifetime by taking various individual asset parameters into account - Type A, running performance x km - [TEUR] [TEUR] Chain net present value Net present value Optimum 1 2 3 4 5 6 7 8 9 10 11 12 13 14 15 16 17 18 Vehicle's age [years] Calculation must be based on a company's individual parameters such as failure frequencies, lifetime of major components, running performance, configuration etc. – 27 –
- 28. Example: Economic assessment of different engine technology strategies (Diesel versus Natural Gas) Overview of cost comparison Additional investments until 2018 versus Diesel Buses: ca. 7,1 Mio € Infrastructure: ca. 2,5 Mio € Health and safety: ca. 0,8 Mio € Total ca. 10,4 Mio € Additional annual costs until 2018 versus Diesel Capital costs buses: ca. + 0,80 Mio € Maintenance costs: ca. + 0,60 to + 0,80 Mio € Fuel costs: ca. – 0,40 Mio € Capital costs infrastructure: ca. + 0,25 Mio € Running costs infrastructure: ca. + 0,28 to + 0,33 Mio € Costs quot;health and safetyquot;: ca. + 0,14 Mio € Costs due to adjusted processes: ca. + 0,02 to + 0,08 Mio € Total: ca. +1,69 to +2,00 Mio € From an economic perspective, a technology switch towards buses powered by Natural Gas motors is not recommendable – 28 –