1. Publishable Final Report 1-16 January 00
JOE3-CT-950038
COMPACT METHANOL REFORMER TEST
Design, Construction and Operation of a 25 kW Unit
J. Bøgild Hansen, B. Fastrup, S.L. Jørgensen, M. Boe
Haldor Topsøe A/S, Denmark
B. Emonts, T. Grube, B. Höhlein, R. Peters, A. Tschauder
Forschungszentrum Jülich GmbH, Germany
H. Schmidt, W. Preidel
Siemens AG, Germany
Contract Number: JOE3-CT-950038
PUBLISHABLE REPORT
Research funded in part by
THE EUROPEAN COMMISSION
In the framework of the
Non Nuclear Energy Programme
JOULE III
2. Publishable Final Report January 00
JOE3-CT-038 2
1. Abstract
In the future, drive systems for vehicles with polymer electrolyte membrane fuel cells
(PEMFC) may be the environmentally most acceptable alternative to conventional drives with
internal combustion engines. The energy carrier is neither gasoline nor diesel as in combustion
engines today, but methanol, which is converted on-board into a hydrogen-rich synthesis gas
in a reforming reaction with water. After removal of carbon monoxide in a gas-cleaning step,
the conditioned synthesis gas is converted into electricity in the fuel cell using air as the
oxidant. The electric energy thus generated serves to supply the electric drive system of the
vehicle.
On the basis of the overall process design, a compact methanol reformer (CMR) was designed
and constructed by Haldor Topsøe A/S. A test facility was prepared and assembled at
Forschungszentrum Jülich. Siemens constructed and supplied a 1 kW PEMFC. Final function
tests with the PEMFC and the integrated CMR were carried out to determine the performance
and the dynamic behaviour. With regard to the 50-kW(H2)-compact methanol reformer, a
special technical design of a catalytic burner was made. The burner units with a total power
output of 16 kW were constructed and tested under different stages of constant and alternating
load. If selecting a specific catalyst loading of 40 g Pt/m2
, the burner emissions are below the
SULEV standard. The stationary performance test of the CMR shows a specific hydrogen
production of 6.7 m3
N/(kg cat hour) for a methanol conversion rate of 95% at 280°C.
Measurements of the transient behaviour of the CMR clearly show a response time of about
20 s reaching 99% of the demanded hydrogen flow due to the limited performance of the test
facility control system. Thin palladium membranes deposited on ceramic tubes have been
prepared. The measured hydrogen permeability through the Pd-layer has been as high as
150 Nm3
/m2
/hr/bar0.5
. The best membranes were only 3-4 microns thick. The adhesion of the
Pd-film to the ceramic support is very good, even after 1000 hours on stream. Pinholes in the
membranes lead to a small amount of CO in the permeate, but the complete elimination of this
has been demonstrated by selective CO methanantion employing space velocities above
1,000,000 h-1
at 200ºC.
3. Publishable Final Report January 00
JOE3-CT-038 3
2. Partnership
Haldor Topsøe A/S, Nymøllevej 55, DK-2800 Lyngby, Denmark
John Bøgild Hansen
Forschungszentrum Jülich GmbH, D-52425, Jülich, Germany
Bernd Emonts
Siemens AG, ZTEN1, D-91050 Erlangen, Germany
Harald Schmidt
3. Objectives
The overall objective of this JOULE III project was the design, construction and operation of a
compact methanol reformer, including gas cleaning in combination with a PEMFC and the
interfaces as part of a passenger car drive system based on experience and results from the
partners.
The technical objective of HTAS was to design a compact reformer (50 kW hydrogen
capacity) integrated with a catalytic converter, which provides heat for the endothermic
reforming reaction. The design should fulfil the criteria for vehicle application, e.g. low
weight and volume, and should be capable of rapid variation in load as well as start-up. The
design was based on overall heat and mass balances for the total system, including the gas-
cleaning step and PEMFC. A prototype using a catalytic burner from FZJ should be construc-
ted and test runs carried out. The methanol decomposition catalyst for the unit should be
manufactured by HTAS. The unit should be delivered to FZJ for detailed tests. HTAS also has
the technical goal of developing a membrane selective for hydrogen permeation based on thin
Pd-membranes supported on a ceramic carrier. The aim was to manufacture a prototype and
have it tested at FZJ.
FZJ was to design and construct a catalytic combuster for the CMR. Its performance would be
pre-screened before it was delivered to HTAS for installation as part of the CMR. An energy
management strategy for the total system had to be evaluated, ultimately selecting the
optimum. The energy storage system had to be integrated into the total drive system.
On the basis of the process design of the test-drive system, FZJ had to prepare a test facility
which included units delivered by the partners, energy storage system, auxiliary units, supply
of methanol and process materials, control engineering and power electronics, gas analysis,
data collection, and management. After delivering the test stand, FZJ had to operate the test
drive system in long-term test runs, starting with the final function tests. The main goal was to
operate the CMR in cyclic tests based on modified driving cycles.
FZJ had to collect and to document the test results for the evaluation, which had to be worked
out together with the partners. Based on the experimental results, specific energy
consumption, emissions and costs for full fuel cycles (FFC) for road traffic (passenger cars)
and fuel production as well as fuel transportation had to be calculated for the methanol/
PEMFC powered cars. Comparison with other alternatives would be made.
Siemens had to construct a Solid Polymer Fuel Cell stack generating a power of 1 kW and had
to conduct endurance tests under H2/air operation in order to establish its performance
4. Publishable Final Report January 00
JOE3-CT-038 4
characteristics. This stack had to be delivered to FZJ, where it should be combined with the
methanol reformer and gas-cleaning step and should be operated with cleaned-up reformate.
The fuel-cell stack should be examined after use.
4. Technical Description
The partners have collaborated on specifying the foreseen performance of the different units
delivered to the project. This has resulted in a flowsheet giving all the material and energy
streams in the system. A simplified version is shown as Figure 1.
Figure 1
Realistic efficiencies have been assumed for the air blowers and pumps needed for the total
system. The system has been calculated for a total maximum electricity production of 25 kW.
This requires a methanol flow of 10.4 kg/h resulting in a hydrogen production of 20.4 Nm3
/h
in the compact methanol reformer. As the membrane system developed was not foreseen to be
100% selective due to small cracks in the system, it is foreseen to apply a methanation step
downstream the membrane. Based on the maximum tolerable amount fuel from the membrane
to the catalytic burner in order not to have a fuel surplus, a hydrogen recovery of 82% from
the membrane was calculated. The hydrogen utilization in the fuel cell was predicted to be
92.5%.
The detailed design of the compact methanol reformer integrates a catalytic reformer, a
catalytic combustion section, consisting of 6 individual burners, and 4 heat exchangers into
one single unit. It is the demand to a compact unit that has led to the integration of the
different sections instead of arranging them separately connected by piping, which would be
the conventional approach.
Heat is consumed by the catalytic reforming and is also needed to evaporate the
methanol/water feed to the reformer. The heat is supplied by a heat transport system.
Throughout the heat transport system, the temperatures are rather uniform.
Air
Storage
Water
Fuel
Cell
(PEM)
Anode
Cathode
Cooler
Reformer
Pd/Ag-
Membrane
Methanol
Air
Exhaust Gas
Q
Gearbox
Driving Cycle
Electronic
Subsystem
E-Motor
Catalytic
Burner
5. Publishable Final Report January 00
JOE3-CT-038 5
The sensible heat in the hot flue gas from the catalytic burner is utilized by means of heat
exchange with the incoming streams, methanol/water feed and combustion air. Furthermore,
the unit is designed to have a low heat loss to its surroundings by placing the hotter parts of
the unit at the centre encapsulated by the colder parts. A picture of the CMR is shown on
Figure 2.
Figure 2 – CMR
With respect to the gas clean-up unit, thin Pd-membranes supported on ceramics were
selected as the most attractive.
Massive, non-supported Pd-membranes are commercially available but have a thickness of 80
– 100 microns, which for this project means that the needed amount of Pd would be 1100 to
1740 g, which is clearly unacceptable from a cost point of view.
With 3 – 4 microns thick membranes, the cost can be brought down to acceptable levels as
seen in Table 1, which shows the initially estimated Pd amount and the actual amount found
in the project.
6. Publishable Final Report January 00
JOE3-CT-038 6
Table 1 – Use of Pd-membranes as gas clean-up
Operating Conditions
Inlet gas 66.8% H2
2.6% CO
20.5% CO2
9.9% H2O
0.2% MeOH
Pressure 20 bar g (feed-side)
0.5 bar g (sweep side)
Temperature 350Û&
Demands H2 delivery: 17 Nm3
/hr
H2 yield: 85%
Membrane Properties First Estimate Updated
Area 552 cm2
2310 cm2
No. of tubes* 11 46
Weight of Ceramic 330 g 1380 g
Mass of Pd 2.51 g 10.5 g
Price of Pd 9 ECU 100 ECU
* Tubes: Dv•Di•L = 10 mm•7 mm•250 mm – Pd prices increased by a factor 2.6 during 95-99
Due to small cracks in the thin membranes, a leakage flow from the feed side to the permeate
side of the membrane will occur leading to small amounts of carbon monoxide and carbon
dioxide in the permeate. In order to remove the carbon monoxide from the permeate, a second
gas-cleaning step must be foreseen. In this project, a methanation step has been chosen.
Carbon monoxide is converted together with hydrogen into methane and water according to:
CO + 3 H2 → CH4 + H2O (1)
As an undesired side reaction, the methanation of carbon dioxide occurs:
CO2 + 4 H2 → CH4 + 2 H2O (2)
A catalyst had to be found that was more selective for the methanation of carbon monoxide
than of carbon dioxide.
The catalytic burner in the compact reformer has the function to provide the thermal energy
required for the reforming reaction, and to quantitatively convert all the gases from the
system, which still contains flammable fractions, into carbon dioxide and water. This requires
the following of the catalytic burner:
• The emissions of CO, nitrogen oxides and hydrocarbons must be below the SULEV
standard through appropriate burner design.
• The operating range is to be selected so as to prevent flashbacks since these leads to a
disruption of the fuel supply and thus interruption of operation.
7. Publishable Final Report January 00
JOE3-CT-038 7
• Different fuels of various compositions are supplied to the burner. Moreover, inert gases
also leave the drive system through the burner. Attention must be paid to the influence of
the emission balance.
• Furthermore, the burner must not change its properties throughout the lifetime of the drive
system, i.e. it must have adequate long-term stability.
The basic burner structure is a ceramic, hollow cylinder to which fuel gas premixed with air is
supplied internally. The outer cylinder surface is provided with a wire mesh coated with noble
metal on which the catalytic combustion reaction takes place. In order to control the
combustion process, the temperature is measured both on the outer side, i.e. on the catalyst,
and on the inner side of the hollow cylinder by use of thermocouples. The burner has the
following properties: a density of 311 kg/m3
and the amount of catalyst on the wire mesh is
20 g/m2
with an active layer thickness of 0.26 mm. A picture of the burner is shown on Figure
3 below.
Figure 3
The PEM fuel-cell system is defined as a stack containing 8 cells and an additional
humidification system of the fuel gas and the air. The fuel-cell stack will produce an open
clamp voltage of 8.4 V. The rated power will be 930 W at 5.6 V and 165 A. The current
density of the MEAs is 300 mA/cm² and the cell voltage 0.7 V. Therefore, the power density
is 210 mW/cm². The active size of a cell is 552 cm². The system is designed for a pressure of
1.5 bar abs on the anode and the cathode side, respectively. The Siemens PEMFC is designed
to operate at 70ºC.
8. Publishable Final Report January 00
JOE3-CT-038 8
5. Results and Conclusion
The completed CMR was delivered to FZJ and built into the completed test stand as shown on
Figure 4.
The Siemens PEM fuel cell was investigated in a first set of experiments. The I/U
characteristics were measured varying stack temperature (T), hydrogen and air pressure (pF),
nitrogen pressure (P(N2)), purge rate (PR), and air ratio (X) in the maximum ranges possible
with the test stand. The I/U characteristics with the highest and the lowest voltage at a certain
current are plotted in Figure 5. The highest stack voltages were observed at a hydrogen and air
pressure of 0.8 bar (g), a temperature of 60°C, an air ratio of 3.0, and a purge rate of 2.0.
Current densities above 120 mA/cm2
could not be investigated because of the flow operation
range of the flow controllers that were chosen for a maximum power of 1 kW at an air ratio of
2.0 and a purge rate of 1.25. The lowest stack voltages were observed at a pressure of
0.49 bar g, a temperature of 35.1°C, an air ratio of 2.0, and a purge rate of 1.5. The difference
between both characteristics is lower at low power densities than at high current densities. The
difference increases from 200 mV at 8 mA/cm2
up to 350 mV at 120 mA/cm2
. It can be
assumed that the influence of the parameters will increase further with increasing current
density.
Figure 4 Complete test stand
9. Publishable Final Report January 00
JOE3-CT-038 9
Figure 5
The dynamic operation of the fuel cell has also been investigated. For this purpose, the
performance characteristic of the New European Driving Cycle (NEDC) has been scaled to
the power range of the fuel cell of 1 kWE. For the sake of controllability of the mass flow
controller, however, a minimum power of 50 W was defined. This assumption is moreover in
compliance with the electric power requirements of a real vehicle since this permanently
requires electrical energy for operating the ancillary components.
Essential parameters of the fuel cell like the hydrogen and air volume flow, current intensity,
and overall voltage were investigated. The mass flow controller thus supplies as much
hydrogen to the fuel cell as is necessary. It can be shown, however, that the mass flow
controller does not assume a much lower new value rapidly enough. When plotting the
hydrogen volume flow and the power over time conformance is less pronounced. This is
above all due to the fact that the overall voltage drops with increasing current (see Figure 6).
In conclusion, however, it can be stated that it is basically possible to simulate a load profile
as could arise in a real traffic situation in the test rig.
On the basis of investigations concerning long-term stability, conversion of different fuels and
flashback behaviour, a burner unit was designed, constructed and manufactured for the
compact reformer. The power density for the nominal load case was fixed at 50 kW/m2
. This
value is a compromise. Higher power densities are favourable for the emission behaviour of
the burner since the temperature, and thus the conversion of the fuel gases, increases with
rising power density. However, high power densities lead to a degeneration of the catalyst due
to long-term behaviour indicated by high emission values. Lower power densities have a
positive effect on flashback behaviour in addition to increasing long-term stability. In the case
of a burner diameter of 80 mm, it is possible to accommodate six catalytic burners in an
annular arrangement in the bottom section of the compact reformer. Since a total power output
of 16 kW must be provided in the nominal load case, the height of the individual burners
determined from the optimum power density determined is 212 mm.
5.5
6.0
6.5
7.0
7.5
8.0
0 50 100 150 200 250
Current Density / [mA / cm2
]
Stack
Voltage
/
[V]
Best Case:
pF = 0.8 bar(g)
T = 60 °C
λ = 3.0
PR = 2.0
Worst Case:
pF = 0.49 bar(g)
T = 35.1 °C
λ = 2.0
PR = 1.5
10. Publishable Final Report January 00
JOE3-CT-038 10
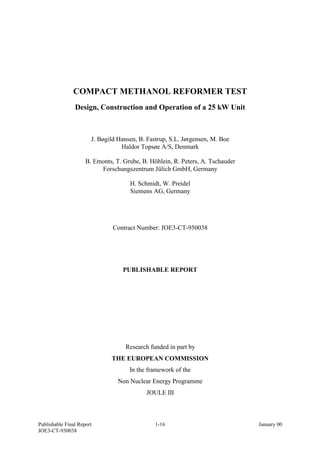
Figure 6 - Time characteristics of overall voltage and current intensity
The catalytic burner was also operated dynamically simulating the full NEDC and the
different emissions measured. The results have been integrated and compared to the SULEV
and EURO IV standards as shown in Table 2.
Table 2
Emissions Experimental results
mg/km
SULEV standard
mg/km
EURO IV standard
mg/km
CO 0.3 625 1000
NOx < 0.01 12 80
HC 0.9 6 100
It can be seen that the burners (the only source of emissions from a PEMFC car) fulfil even
the super ultra-low emission standard by large margins.
The compact methanol reformer has been operated in a test mode at 260°C and 280°C up to
hydrogen production rates of 5 Nm3
/(kg cat h) and 7 Nm3
/(kg cat h), respectively. In order to
accommodate the Pd-membrane, the system pressure was chosen to be 21 bar. The compact
methanol reformer performance is compared in terms of methanol conversion and dry CO
concentration with the experiments of a single tube filled with a catalyst loading of 35.5 g in a
tube of 25 cm length and a diameter of 12.2 mm. These dimensions correspond to the
construction data of the CMR.
In Figure 8, the methanol conversion rate is sketched as a function of the specific hydrogen for
the CMR and for a single reactor tube at two temperatures, i.e. 260°C and 280°C. As shown,
the methanol conversion rates of the CMR are somewhat lower than those for the single tube
0
1
2
3
4
5
6
7
8
9
10
0 200 400 600 800 1000 1200
time/s
overall
voltage/V
0
20
40
60
80
100
120
140
160
180
200
current
intensity/A
overall voltage/V
current intensity/A
11. Publishable Final Report January 00
JOE3-CT-038 11
considering a comparable load, i.e. an equal specific hydrogen production. At 280°C, a
methanol conversion of 95% is reached at a production rate of 6.7 Nm3
/(kg cat h) for the
CMR and 7.87 Nm3
/(kg cat h) for the single tube. The high pressure of 21 bar for the CMR
experiments leads to a lower equilibrium conversion. The equilibrium methanol conversion
can be determined to 99.2% at 280°C and 98.1% at 260°C. The experiments clearly shows a
limitation of the methanol conversion at low loads and higher pressures. The methanol
conversion rate of the CMR provides 86% of the design value derived from experiments with
single tubes. Taking into account that the CMR consists of a bundle of tubes, the efficiency of
such a scale-up is very good.
Figure 7
In the following section, the CMR performance with regard to transients will be discussed.
The experiments were performed by load changes, for example from 5% up to 10%, from
10% up to 20%, from 20% up to 40%, and from 40% up to 70%. These partial loads are
related to the maximum flow of the methanol liquid flow controller. The partial loads related
to the design value of the CMR are by a factor of 1.15 higher, for example the load change of
the liquid flow controller from 40 up to 70% leads to a load change of the CMR from 46.1%
up to 80.7%. Figure 8 shows the signal of the control system for the methanol liquid flow
controller, the resulting methanol flow passing into the reformer and the response functions
concerning the hydrogen and the carbon dioxide flow out of the CMR. As shown, the signal to
the liquid flow controller for methanol changes during a time interval of 10 seconds. The
change in the input flow of methanol is finished after a period of 20 seconds. The hydrogen
and the carbon dioxide flow at the reformer exit follow the input flow of methanol
immediately without any delay. The hydrogen flow response is in fact determined by the
transients of the delivery system for the methanol/water feed.
90
91
92
93
94
95
96
97
98
99
100
0 1 2 3 4 5 6 7 8 9 10
Theoretical specific hydrogen production / m³N /(h kgCat.)
Methanol
conversion
rate
/
%
280 °C, 3.8 bar, single tube
280 °C, 21 bar, CMR
260 °C, 3.8 bar, single tube
260 °C, 21 bar, CMR
12. Publishable Final Report January 00
JOE3-CT-038 12
Figure 8
In the next section, the energy balance of the CMR will be discussed. Figure 9 shows the
efficiency of the CMR as a function of the partial load of the CMR at 260°C and 280°C. This
efficiency is defined as the ratio of the enthalpy flow (Lower Heating Value, LHV) of
hydrogen outlet the reformer to the input enthalpy flow (LHV) of methanol and the heating
values of the burner fuel. During the first tests of the CMR, the catalytic burner is fed with
methanol and partly hydrogen, while for the balance of plant calculations done by HTAS, it is
assumed that the catalytic burner will be fed with hydrogen, methanol, methane, and carbon
monoxide coming from the gas-cleaning system and the fuel cell. The efficiencies from the
BoP-calculations amount to 80.7% at full load and 90% at 25% partial load. Additional
calculations with a dynamic simulation tool considering the fuel processing system in the
NEDC result in an average efficiency of 87%. As shown in Figure 9, the efficiency calculated
by the measured flows from the test facility clearly shows a dependence on load. Starting at a
low partial load of 6%, the efficiency of the CMR is 60%. At 25% load the efficiency
increases up to 78% which is near to the value of 80% for partial loads between 50% and full
load. Especially at a temperature of 260°C, the efficiency slightly decreases with increasing
load due to a decreasing methanol conversion rate. The efficiency of the CMR is with a
maximum of 82% at 280°C for a load between 70%-80% somewhat higher than the design
value. The lower efficiency at lower loads is mainly due to the burner operation mode at low
loads.
0
4.000
8.000
12.000
16.000
20.000
24.000
28.000
0 60 120 180 240 300
t / s
V
/
Nl/h
0%
10%
20%
30%
40%
50%
60%
70%
Load
V_H2 V_CO2
Load (set point) Load (current value)
13. Publishable Final Report January 00
JOE3-CT-038 13
Figure 9
Thin palladium membrane deposited on the inner side of ceramic tubes has been prepared.
The measured hydrogen permeability through the Pd-layer has been as high as
150 Nm3
/m2
/hr/bar0.5
. The best membranes were 3-4 microns thick, so the requirements for
diminishing the cost of noble Pd-metal have been fulfilled.
The adhesion of the Pd-film to the alumina support is very good, even after 1000 hours on
stream.
The developed membranes are not 100% selective with respect to hydrogen due to pinholes.
The number of pinholes and thus the rate of leakage of CO and CO2 have been gradually
reduced throughout the project. However, the CO content in the permeate is still not low
enough to be tolerated by the fuel cell.
Measurements with high pressure reformate gas indicated that the hydrogen permeability is
significantly smaller than expected from the results obtained in pure hydrogen. In addition, it
depends on the hydrogen yield, which is defined as
[ ]
(%)
Nl/hr
membrane
of
side
-
feed
to
gas
reformed
in
H
100
[Nl/hr]
membrane
he
through t
permeated
H
Yield
H
2
2
2
⋅
=
The measured diffusion capacities of three different Pd-membranes are shown on Figure 10.
The diffusion capacity of these membranes in pure hydrogen varied by more than a factor of
two; yet they are not very different in reformate gas.
50
55
60
65
70
75
80
85
90
95
100
0 10 20 30 40 50 60 70 80 90 100
Partial load CMR / %
Efficiency
/
%
260 °C
280 °C
Design Values
Average CMR efficiency during New European Driving Cycle
14. Publishable Final Report January 00
JOE3-CT-038 14
Figure 10
We have verified that the main reason for this discrepancy is CO poisoning of the membrane.
Figure 11 shows the effect of adding CO to a stream of pure hydrogen.
Figure 11. The relative effect of CO in the hydrogen feed (20 bar g)
0
0,05
0,1
0,15
0,2
0,25
0,3
0 20 40 60 80 100
Hydrogen Yield [%]
0,0
0,2
0,4
0,6
0,8
1,0
0 5 10 15 20 25 30
% CO inlet
350 C
15. Publishable Final Report January 00
JOE3-CT-038 15
The CO poisoning is temperature dependent. This gives rise to increased activation energy for
the diffusion capacity in reformate gas (Fig. 12).
Figure 12
Due to the small number of pinholes in even the best membranes, experiments were carried
out at FZJ using a special methanation catalyst MC-4 delivered by HTAS. Different leak rates
were simulated at various temperatures. The results are shown in Figure 13.
Figure 13
Leak Rate
1 %
2 %
4 %
0 300000 600000 900000 1200000 1500000
Space Velocity / (1/h)
0
20
40
60
80
CO
2
Conversion
Rate
/
%
350 °C
200 °C
250 °C
300 °C
16. Publishable Final Report January 00
JOE3-CT-038 16
For all the experiments, the conversion of CO to CH4 was quantitative. It can be seen that CO2
methanation can be completely avoided at 200ºC with space velocities above 1,000,000 h-1
.
6. Exploitation Plans and Anticipated Benefits
Presently, there are different views concerning the start of a mass market for PEMFC vehicles.
Some car manufacturers (e.g. Daimler Chrysler and GM/Opel) still announce that a mass
market will start in 2004 whereas other car manufacturers expect a mass market not before
2010. In Japan, NEDO revealed that the costs of PEMFC cars in 2004 would be three times
the costs of a conventional car at that time. Five of the biggest Japanese car manufacturers
expect that there will be at least another twenty years before PEMFC vehicles come into a
mass market.
Considering these statements, it is not possible at the moment to make an exploitation and
marketing plan for the PEMFC system for the near future. Ultimately, the customer plays an
important role in future fuel-cell scenarios. The start of a mass market for PEMFC vehicles
has to be prepared by car manufacturers, fuel providers (e.g. infrastructure for methanol) and
government (tax and other regulations).
The partners have, however, gained valuable insight into the different units supplied to the
project and it is anticipated that some of the units can be used in the shorter term for other
applications, f.inst. stationary or marine PEMFC plants where the requirements to cost and
dynamic behaviour are less stringent.
All in all, the anticipated benefits to society will be less pollution, higher energy conversion
efficiency and less dependence on crude oil derived enrage.