
Empfohlen
Empfohlen
Weitere ähnliche Inhalte
Was ist angesagt?
Was ist angesagt? (20)
Andere mochten auch
Andere mochten auch (12)
Ähnlich wie Thesis Defence_April2015_Yugaa
Ähnlich wie Thesis Defence_April2015_Yugaa (20)
Thesis Defence_April2015_Yugaa
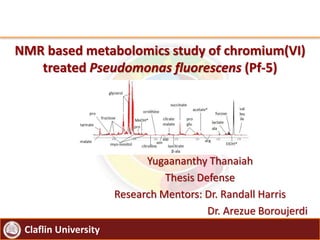
- 1. Claflin University NMR based metabolomics study of chromium(VI) treated Pseudomonas fluorescens (Pf-5) Yugaananthy Thanaiah Thesis Defense Research Mentors: Dr. Randall Harris Dr. Arezue Boroujerdi
- 2. Claflin University Outline • Introduction – Bioremediation – Chromium – Pseudomonas fluorescens – Pf5 – Metabolomics study • Methodology – Sample Collection and Chemical Preparation – Data collection using NMR – Data analysis using PCA • Results and Discussion • Future Work • Acknowledgements
- 3. Claflin University Bioremediation • “Bio-remediate" means to use biological organisms to solve an environmental problem such as cleaning of contaminated soil or groundwater. • Bioaugmentation - bacterial cultures are externally added to the waste site to speed up the rate of degradation of a contaminant. • Bioremediation is an environmental friendly and less expensive way to clean the contaminated sites. • EPA had listed nearly 1700 sites as NPL sites under Super Fund. http://www.epa.gov/superfund/sites/npl/
- 4. Claflin University Chromium • Chromium contamination was found in 1127 sites out of the 1699 NPL sites. • Chromium is a heavy metal. Naturally occurring Cr forms are Cr(III), Cr(VI). Most prevalent is Cr(III). • Chromium(III): Less toxic, trace amount is essential nutrient in human body. Chromium(VI): highly toxic, imposes many health hazards, has been discovered as a strong carcinogen. • Chromium is mainly released to the environment as industrial waste. Main contributors are chemical, leather and textile manufacturing.
- 5. Claflin University Chromium Contamination • Chromium(VI) levels found in some NPL sites: – Ground water sample near Aircraft plant in NY: 1400 µg/L Cr(IV) = 1400 ppb – The sample from NOVACO Industries: • Due to Chromic acid spill, the concentration of Chromium in wells and ground water was increased up to 9.40 x 10⁸ ppb (940 000 mg/L) • The standard concentration of Chromium(VI) after remediation is expected to be < 50 ppb • Drinking water standard for Chromium according to WHO Standard: – 50 ppb total chromium – 0.2ppb Cr(VI) • Pseudomonas fluorescens (LB300) has been reported to reduce highly toxic hexavalent chromium (Cr6+)to a less toxic trivalent chromium(Cr3+). http://www.epa.gov/superfund/sites/npl/
- 6. Claflin University Hypothesis We hypothesized that the metabolism pattern observed in Pseudomonas fluorescens (Pf5) will be different because of the effect of chromium(VI). Objective To identify the metabolic pathway differences between the Pf-5 control sample and stress sample(Chromium (VI)) at different time intervals with NMR based metabolomics. “Lawrence H. Bopp, and Henry L. Ehrlich. "Chromate Resistance and Reduction in Pseudomonas Fluorescens Strain LB300- Springer." Chromate Resistance and Reduction in Pseudomonas Fluorescens Strain LB300 - Springer. Archives of Microbiology, 01 Sept. 1988. Web. 06 June 2014.”
- 7. Claflin University Pseudomonas fluorescens – Pf5 • Obligate gram-negative bacteria • Optimum growth temperature : 25°C-30 °C • Has been found to have role in destroying certain toxins and pollutants: styrene, polycyclic aromatic hydrocarbons, and TNT. • Exhibits bio-control properties and produces antibiotic Mupirocin.
- 8. Claflin University Metabolomics study • Study of collection of all metabolites in a biological cell, tissue, organ or organism. • Metabolites are the end products of cellular processes which act as specific fingerprints. • Environmental metabolomics focuses on the study of interactions between organisms and their environment. • This approach has many advantages for studying organism–environment interactions and for assessing the effect of environmental stress at the molecular level.
- 9. Claflin University • Sample collection and chemical preparation • Data collection using NMR • Data analysis using PCA • Significant metabolite identification • Probable pathway Analysis • Biomarker Identification and Biological Interpretation Methodology
- 10. Claflin University Sample collection and chemical preparation 5 mL LB Broth Control: 20 mL LB Broth Chromium Stress: 19.5 μL of K₂Cr₂O₇ 20 mL LB Broth Polar Layer Non-Polar Layer
- 11. Claflin University NMR Spectra 1D and 2D spectra 1D spectra: 1H or 13C information 2D spectra: 1H and 13C information 1D: Shows metabolic profile or metabolic fingerprint at given state Each sample = one spectra Data Collection using NMR
- 12. Claflin University Data analysis using PCA Principal Component Analysis (PCA) • Statistical technique that takes a large number of data sets and identifies the pattern in the data. • Extract the most important information from the data table. • Compress the size of the data set by keeping only the important information.
- 13. Claflin University • Address the chemical shift variability across spectra • Spectra are divided into small regions called “Buckets” • Ideally contains one peak per bucket • Compare the changes within the bucket from each NMR spectra 96,000 buckets to analyze 0.0-10.0ppm NMR spectrum 0.005ppm/variable bucket widths 2000 buckets x 48 samples Principal Component Analysis (PCA)
- 14. Claflin University 14 Scores Plot: each NMR sample = NMR spectrum = one point Loadings plot: each bucket = one point = ~ one metabolite Directions in the Scores plot correspond to the directions in the Loadings plot Principal Component Analysis (PCA) Identification of significant MetabolitesIdentification of metabolic Profile Separation A B C D
- 15. Claflin University Growth Curve and Survival Rate of Pf-5 upon exposure to different Chromium(VI) levels 0 0.2 0.4 0.6 0.8 1 1.2 1.4 1.6 1.8 2 0 4 8 12 16 20 24 Absorbance Time (hrs) Growth Curve of Pf 50 ppm 25 ppm 50 ppm 100 ppm 200 ppm 1 ppm = 1000 ppb 0.00E+00 1.00E+08 2.00E+08 3.00E+08 4.00E+08 5.00E+08 6.00E+08 0 25 50 100 200 BacterialCulture/mL Chromium(VI) Concentration (ppm)
- 16. Claflin University Study of Biological Variability among the group: Constant OD Vs Variable OD The biological variability among the group was decreased by matching the ODs during sample collection.
- 17. Claflin University Growth Curve of Pf-5 0.00 0.20 0.40 0.60 0.80 1.00 1.20 1.40 0.00 3.00 6.00 9.00 12.00 15.00 18.00 21.00 24.00 Absorbance Time (hrs) Control Chromium stressed Comparative to the control sample, lower growth rate and survival rate was observed in the stress sample(Chromium(VI)). 0.00E+00 5.00E+08 1.00E+09 1.50E+09 2.00E+09 0 6 12 24 0 ppm 50 ppm
- 18. Claflin University 7.50 5.00 2.50 ppm 24h Cont. 6h Cr 24h Cr 6h Cont. Data Collection : 1D Spectra
- 19. Claflin University PCA : Control Vs Stress sample(Chromium(VI)) at different time intervals Distinct metabolic profile separation is observed between each sample groups.
- 20. Claflin University Distinct metabolic profile separation is observed between control sample and stress sample at 6hrs. Distinct metabolic profile separation is observed between control sample and stress sample at 24hrs. DM = 6.1137 DM = 8.075 Effect of Chromium(VI) Stress: PCA Scores Plot of Control sample Vs Stress samples at 6hrs and 24 hrs
- 21. Claflin University Distinct metabolic profile separation is observed between stress samples at 6hrs and 24hrs. Distinct metabolic profile separation is observed between control samples at 6hrs and 24hrs. DM = 5.6314 DM = 5.203 Time Effect: PCA Scores Plot of Control sample and Stress samples at 6hrs Vs 24 hrs
- 22. Claflin University Mahalanobis Distance and F-Critical values Statistical Parameters 24HCr6+_24HControl 6HCr6+_6HControl 24HCr6+_6HCr6+ 24HControl_6HControl DM 6.1137 8.075 5.6314 5.203 T2 112.1317 195.6154 95.1381 81.2131 F-True 50.4593 88.0269 42.8122 36.5459 F-Critical (95%) 4.96 4.96 4.96 4.96 Significant Status Yes Yes Yes Yes The F-true value greater than the F-critical value revealed that the separation between the groups are statistically significant.
- 23. Claflin University Potential Significant Metabolites Metabolites FC Avg 6H FC Avg 24H Glutamate 1.7483 0.3915 acetate 1.6237 1.0000 lactate 1.5412 1.0000 succinate 1.2832 1.0000 betaine 0.7597 0.8685 ornithine 0.4610 1.0000 glycerol 1.5329 1.7735 alanine 1.0000 2.0295 3-hydroxyisovalerate 2.2283 2.4960 dimethylsulfone 1.4476 2.5784 isobutyrate 2.0363 2.6977 formate 1.7860 2.8607 valine 1.8719 2.9586 adenine 1.0000 3.5554 leucine 1.9470 3.5792
- 24. Claflin University Fold Change Analysis of the Metabolites Fold change is equal to the concentration ratio of the metabolite expressed in the Stress sample to the Control sample at a given time point. The fold change value greater than one means the concentration of a specific metabolite is higher in the stress sample than the control sample.
- 25. Claflin University Probable Significant Metabolic Pathways
- 26. Claflin University Discussion • The metabolism pattern observed in Pseudomonas fluorescens (Pf5) was hypothesized to be different because of the effect of chromium. • PCA analysis confirmed that there is distinct metabolic profile separation between the control and stress samples. • The metabolic profile separation suggests that the chromium(VI) stress could have induced a change in the metabolic pathway. • Potential significant metabolites have been identified by assigning the corresponding NMR peaks using Chenomx NMR suite. • Probable metabolic pathways which could have been changed due to chromium(VI) stress were identified using MetaboAnalyst.
- 27. Claflin University 27 • Reconfirmation of the significant metabolites • Identification of the critical metabolic pathway responsible for Chromium(VI) resistance in Pseudomonas fluorescens Pf -5. • Biomarker Identification and Biological Interpretation. Future Work
- 28. Claflin University Acknowledgement • My research mentors Dr. Randall Harris and Dr. Arezue Boroujerdi. • My committee members Dr. Chowdhury and Dr. Raja. • Claflin University, Department of Biology and Department of Chemistry. • Department of Energy-Environmental Management (DE- EM0000479) . • My research partners Jessica A. Fuller and Kareem Altidor.
- 29. Claflin University References • Goodpaster, A. M., & Kennedy, M. A. (2011). Quantification and statistical significance analysis of group separation in NMR-based. Chemometrics and Intelligent Laboratory Systems, 109, 162–170. • kamauludeen, S. P. (2003). Bioremediation of Chromium contaminated environments. Indian Journal of Experimental Biology, 972-985. • Kim, H. K., & Verpoorte, Y. H. (2011). NMR-based plant metabolomics: where do we stand, where do we go? Trends in Biotechnology, 29(6), 268-275. • Lardon, I., Eyckmans, M., Vu, T. N., Laukens, K., Boeck, G. D., & Dommisse, R. (2013). 1H-NMR study of the metabolome of a moderately hypoxiatolerant fish, the common carp (Cyprinus carpio). Metabolomics, 9, 1216–1227. doi:DOI 10.1007/s11306-013-0540-y • Lindon, J. K. (2008). Metabonomics. NATURE, 455, 1054-1056. • Lloyd, J. R. (2003). Microbial reduction of metals and radionuclides. FEMS Microbiology Reviews, 411- 425. • Marc Valls, V. d. (2002). Exploiting the genetic and biochemical capacities of bacteria. FEMS Microbiology Reviews, 327-338. • Rajendran, P., Muthukrishnan, J., & Gunasekaran. (2003). Microbes in heavy metal remediation. Indian Journal of Experimental Biology, 935-944. • Southam, A. D., Easton, J. M., Stentiford, G. D., Ludwig, C., & Viant, T. N. (2008). Metabolic Changes in Flatfish Hepatic Tumours Revealed by NMR-Based Metabolomics and Metabolic Correlation Networks. Journal of Proteome Research, 7, 5277–5285.
Hinweis der Redaktion
- OD : Concentration of the bacterial in the suspension