
Empfohlen
Empfohlen
Weitere ähnliche Inhalte
Was ist angesagt?
Was ist angesagt? (14)
Ähnlich wie Nu Skin Investor Day 2022 Slides.pdf
Ähnlich wie Nu Skin Investor Day 2022 Slides.pdf (20)
Kürzlich hochgeladen
Kürzlich hochgeladen (20)
Nu Skin Investor Day 2022 Slides.pdf
- 1. Important information regarding forward-looking statements: This presentation contains forward-looking statements within the meaning of federal and state securities laws that represent the company’s current expectations and beliefs. All statements other than statements of historical fact are “forward-looking statements” and include, but are not limited to, statements of management’s expectations regarding the company’s transformation, strategies and initiatives (including related top-line and bottom-line growth through 2025); management’s expectations regarding the company’s performance, sales force and customer base, affiliates, digital tools, social commerce business, operational improvements, future market size, future products and product introductions; statements about future changes to the company’s business model and compensation plan; projections regarding revenue, margins, expenses, operating income, earnings per share, foreign currency fluctuations, tax rates, sources and uses of cash, dividends and other financial items; statements of belief; and statements of assumptions underlying any of the foregoing. In some cases, you can identify these statements by forward-looking words such as “believe,” “expect,” “enable,” “guidance,” “vision,” “outlook,” “project,” “anticipate,” “prospects,” “commit,” “achieve,” “estimate,” “intend,” “plan,” “likely,” “will,” “would,” “could,” “may,” “might,” the negative of these words and other similar words. The forward-looking statements and related assumptions involve risks and uncertainties that could cause actual results and outcomes to differ materially from any forward-looking statements or views expressed herein. These risks and uncertainties include, but are not limited to, the following: • risk that epidemics, including the ongoing COVID-19 pandemic, and other crises could negatively impact our business; • adverse publicity related to the company's business, products, industry or any legal actions or complaints by the company's sales force or others; • management’s preferences and decisions on how to manage the business, which could change in the future; • risk of lower future revenue or higher costs than anticipated, causing declines in the company’s margins and/or earnings; • risk that direct selling laws and regulations in any of the company's markets, including the United States and Mainland China, may be modified, interpreted or enforced in a manner that results in negative changes to the company's business model or negatively impacts its revenue, sales force or business, including through the interruption of sales activities, loss of licenses, increased scrutiny of sales force actions, imposition of fines, or any other adverse actions or events; • any failure of current or planned initiatives or products to generate interest among the company's sales force and customers and generate sponsoring and selling activities on a sustained basis; • political, legal, tax and regulatory uncertainties associated with operating in international markets, including Mainland China; • uncertainty regarding meeting restrictions and other government scrutiny in Mainland China, as well as negative media and consumer sentiment in Mainland China on our business operations and results; • risk of foreign-currency fluctuations and the currency translation impact on the company's business associated with these fluctuations; • uncertainties regarding the future financial performance of the businesses the company has acquired; • risks related to accurately predicting, delivering or maintaining sufficient quantities of products to support planned initiatives or launch strategies, and increased risk of inventory write-offs if the company over-forecasts demand for a product or changes its planned initiatives or launch strategies; • regulatory risks associated with the company's products, which could require the company to modify its claims or inhibit its ability to import or continue selling a product in a market if the product is determined to be a medical device or if the company is unable to register the product in a timely manner under applicable regulatory requirements; • unpredictable economic conditions and events globally, including trade policies and tariffs; • the company's future tax-planning initiatives; any prospective or retrospective increases in duties on the company's products imported into the company's markets outside of the United States; and any adverse results of tax audits or unfavorable changes to tax laws in the company's various markets; and • continued competitive pressures in the company's markets. The company's financial performance and the forward-looking statements contained herein are further qualified by a detailed discussion of associated risks set forth in the documents filed by the company with the Securities and Exchange Commission, including its recently filed Form 10-K. The forward-looking statements set forth the company's beliefs as of the date that such information was first provided and the company assumes no duty to update the forward-looking statements contained in this presentation to reflect any change except as required by law.
- 2. Type your title here Date Nu Skin Investor Day February 2022
- 4. Meeting Agenda Introduction & Welcome Q&A 2021 Review Introduce Nu Vision 2025
- 5. OUR MISSION To be a global force for good by empowering people to improve lives with innovative products, rewarding opportunities and an enriching culture.
- 6. Q4 & 2021 Year-end Update • Annual revenue growth of 4%, or 11% compared to 2019. • Social Commerce continues to fuel west growth, led by US market. • Collagen+ and Meta introductions and launches in most markets. • Increased geographic balance • China and Southeast Asia continue to lag despite social commerce exploration • Ongoing macro-environmental COVID impacted events and promotional activities in the east.
- 9. SOCIAL MEDIA
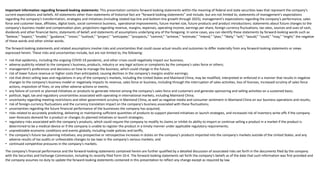
- 10. Social Commerce Market Size And Growth Prospects, 2017-2018 (USD Billion) 3,500 3,000 2,500 2,000 1,500 1,000 500 2017 2028 2026 2025 2024 2023 2022 2021 2020 2019 2018 North America Europe Asia Pacific LATAM Middle East & Africa Source: USBAEC, IMA, GSMA, DSA, D&B Hoovers, Company Annual Reports, Primary Interviews, and Grand View Research The social commerce market was valued at USD 474.76 billion in 2020 and is predicted to reach USD 3,369.82 billion by 2028, growing at a CAGR of 28.4% from 2021 to 2028. MACRO-TRENDS: GLOBAL SOCIAL COMMERCE Beauty and Wellness are both top 5 growers within social channels with 34% and 21% respective CAGRs through 2028 2027 4,000
- 11. NU VISION 2025 To become the world’s leading integrated beauty and wellness company, powered by our dynamic affiliate opportunity platform
- 12. EmpowerMe Personalized Beauty and Wellness Strategy Provide personalized customer experiences that enable deeper relationships and greater lifetime value via connected device systems
- 13. *Source Euromonitor International Ltd; Retail Value RSP terms; all channels; 2017 and 2018. Includes at-home Skin Care Devices exclusively paired with topical consumable of same brand. Based on Euromonitor custom research methodology, Jan/Feb2019. Includes electric facial cleansers as defined in Passport database; does not include hair care/removal, body shavers, or oral care appliances.
- 15. AFFILIATE-POWERED SOCIAL COMMERCE Expand the scale and reach of our business opportunity via global adoption of Customer-focused, Affiliate-powered, Social commerce business model.
- 16. INTEGRATED DIGITAL ECOSYSTEM Seamless, mobile-first, digital experiences to enable company & affiliates to attract, connect & nurture customers through their personal journey with Nu Skin.
- 17. Nu Skin Enterprises’ Strategic Pivot The world’s leading direct selling company. The world’s leading integrated beauty and wellness company, powered by our dynamic affiliate opportunity platform. (Nu Vision 2025)
- 20. SAVED 131 TONS OF PLASTIC AND OVER 34 TONS OF PAPER FIRST BEAUTY COMPANY TO LAUNCH THE ECO-PAK ALL PACKAGING RECYCLED, RECYCLABLE, REUSABLE, REDUCED OR RENEWABLE BY 2030
- 21. 1. Introduce EmpowerMe Personalized beauty & wellness strategy with IO connected devices 2. Accelerate our Affiliate-powered Social Commerce business model 3. Delight our customers with our integrated digital ecosystem Nu Vision 2025 Strategic Imperatives:
- 22. $3.4 Trillion by 2028 Jump 7x in next 7 years PERSONALIZATION GLOBAL MARKET SIZE: BEAUTY & PERSONAL CARE GLOBAL MARKET SIZE: HEALTH & WELLNESS OPPORTUNITY *SOURCE: Euromonitor International, Beauty and Personal Care Global Market Size and Health and Wellness Global Market Size, 2020-2021
- 23. Nu Skin VERA App nuskin.com Nu Skin STELA App Assessment Tools Social Commerce Multiplier Behavioral Insights Enhanced Sharing Tools Create | Discover Platform Personalized Product Connected IoT Devices Science Backed Clinically Proven Product | Services Subscriptions PRODUCT TECHNOLOGY COMMUNITY EMPOWERME “ “ 598 97
- 25. Nu Skin VERA App nuskin.com Nu Skin STELA App Assessment Tools Social Commerce Multiplier Behavioral Insights Enhanced Sharing Tools Create | Discover Platform Personalized Product Connected IoT Devices Science Backed Clinically Proven Product | Services Subscriptions PRODUCT TECHNOLOGY COMMUNITY NEW WAY EMPOWERME OLD WAY PRODUCT “ “ 598 97
- 27. Nu Skin VERA App nuskin.com Nu Skin STELA App Assessment Tools Social Commerce Multiplier Behavioral Insights Enhanced Sharing Tools Create | Discover Platform Personalized Product Connected IoT Devices Science Backed Clinically Proven Product | Services Subscriptions PRODUCT TECHNOLOGY COMMUNITY EMPOWERME “ “ 598 97 1. Empower affiliates to attract, connect and nurture customers 2. Increase product consumption 3. Attract new customers and affiliates 4. Increase recurring revenue 5. Increase lifetime value The strategy includes:
- 28. Skin Beauty Wellness Scanner Assessments Weight Mind Discover Yourself TECHNOLOGY Sarah PROPRIETARY ALGORITHM CONNECT ATTRACT NURTURE VIRTUAL TRY-ON SKIN AGING METABOLISM SUPPORT DULLNESS DRY SKIN SCS SCORE 26,000 SLEEP BETTER CUSTOMER
- 31. ageLOC® Meta
- 33. Only 1 in 8 people is considered metabolically healthy.* *Araújo J, Cai J, Stevens J. Preva. Metab Syndr Relat Disord. 2019;17(1):46-52. doi:10.1089/met.2018.0105 https://www.frontiersin.org/research-topics/13570/modern-lifestyle-and-health-how-changes-in-the-environment-impacts-immune-function-and-physiology **Nu Skin Meta Supplement Consumer Concept Testing, September 2020
- 34. of consumers agree that today’s lifestyle negatively impacts our bodies ** *Araújo J, Cai J, Stevens J. Preva. Metab Syndr Relat Disord. 2019;17(1):46-52. doi:10.1089/met.2018.0105 https://www.frontiersin.org/research-topics/13570/modern-lifestyle-and-health-how-changes-in-the-environment-impacts-immune-function-and-physiology **Nu Skin Meta Supplement Consumer Concept Testing, September 2020 90% Only 1 in 8 people is considered metabolically healthy.*
- 36. THE PROOF IS IN THE PLUS
- 37. GROWING TREND The direct sales channel is driving the highest revenue share. Source: Grand View Research, Women Health & Beauty Supplements Market Size, Share & Trends Analysis Report, May 2020 The health and beauty supplement market is expected to reach $68.9 billion by 2026.
- 39. . CLINICALLY PROVEN TO PROVIDE BETTER COMPLEMENTARY BENEFITS 0 5 10 15 20 25 30 35 40 45 50 Placebo LumiSpa® Collagen+ and LumiSpa® Overall Appearance* *Over clinical baseline after 4 months according to expert visual grading
- 42. Nu Skin VERA App nuskin.com Nu Skin STELA App Assessment Tools Social Commerce Multiplier Behavioral Insights Enhanced Sharing Tools Create | Discover Platform Personalized Product Connected IoT Devices Science Backed Clinically Proven Product | Services Subscriptions PRODUCT TECHNOLOGY COMMUNITY EMPOWERME “ “ 598 97 Retention Subscription Lifetime Value
- 44. PRODUCT PRODUCT
- 45. 0 20 40 60 80 100 120 140 0 2,000 4,000 6,000 8,000 10,000 12,000 14,000 0 50,000 100,000 150,000 200,000 250,000 300,000 350,000 400,000 Q4 2020 Q3 2021 Q4 2021 Reported Revenue (Ms) Sales Leaders Customers Q4 2020 Q3 2021 Q4 2021 Q4 2020 Q3 2021 Q4 2021
- 46. 0 10 20 30 40 50 60 70 80 90 0 1,000 2,000 3,000 4,000 5,000 6,000 7,000 8,000 0 50,000 100,000 150,000 200,000 250,000 300,000 Reported Revenue (Ms) Sales Leaders Customers Q4 2020 Q3 2021 Q4 2021 Q4 2020 Q3 2021 Q4 2021 Q4 2020 Q3 2021 Q4 2021
- 47. 0 20 40 60 80 100 120 140 160 0 5,000 10,000 15,000 20,000 25,000 0 50,000 100,000 150,000 200,000 250,000 300,000 350,000 400,000 Reported Revenue (Ms) Sales Leaders Customers Q4 2020 Q3 2021 Q4 2021 Q4 2020 Q3 2021 Q4 2021 Q4 2020 Q3 2021 Q4 2021
- 48. 0 10 20 30 40 50 60 0 500 1,000 1,500 2,000 2,500 3,000 3,500 4,000 4,500 5,000 0 10,000 20,000 30,000 40,000 50,000 60,000 70,000 80,000 Reported Revenue (Ms) Sales Leaders Customers Q4 2020 Q3 2021 Q4 2021 Q4 2020 Q3 2021 Q4 2021 Q4 2020 Q3 2021 Q4 2021
- 49. 0 10 20 30 40 50 60 70 80 90 100 0 1,000 2,000 3,000 4,000 5,000 6,000 7,000 8,000 9,000 10,000 0 20,000 40,000 60,000 80,000 100,000 120,000 140,000 160,000 Reported Revenue (Ms) Sales Leaders Customers Q4 2020 Q3 2021 Q4 2021 Q4 2020 Q3 2021 Q4 2021 Q4 2020 Q3 2021 Q4 2021
- 50. 0 20 40 60 80 100 0 2,000 4,000 6,000 8,000 10,000 0 20,000 40,000 60,000 80,000 100,000 120,000 140,000 160,000 180,000 200,000 Reported Revenue (Ms) Sales Leaders Customers Q4 2020 Q3 2021 Q4 2021 Q4 2020 Q3 2021 Q4 2021 Q4 2020 Q3 2021 Q4 2021
- 51. 0 20 40 60 80 100 120 140 0 1,000 2,000 3,000 4,000 5,000 6,000 7,000 8,000 0 20,000 40,000 60,000 80,000 100,000 120,000 140,000 Reported Revenue (Ms) Sales Leaders Customers Q4 2020 Q3 2021 Q4 2021 Q4 2020 Q3 2021 Q4 2021 Q4 2020 Q3 2021 Q4 2021
- 52. Projected Revenue Growth Mainland China (5) to 5% Americas 6 to 12% South Korea 2 to 6% Southeast Asia/Pac (10) to (5)% Japan (1) to 4% Hong Kong/Taiwan (5) to 5% EMEA 8 to 13% 2 0 2 2 Consolidated Local Currency Growth 0 to 5% Global FX Impact (1) to (2)% Consolidated GAAP Growth (1) to 3% CONSTANT CURRENCY
- 53. Annual Fusion Calendar (Sample) • Monthly/quarterly promos & launches • Attract new customers & affiliates • Annual hero products • Attract new customers & affiliates • Top brand campaigns • Customer loyalty • Affiliate retention • Subscriptions ATTRACT CONNECT NURTURE
- 54. Building Online Communities Let’s Nu Run Contactless, Mission-based Running Events Nu Beat VR Bike Challenge Program Zoom in Now Run Online Group Workout Connect Now Instagram Mission Challenge
- 55. WeChat Program Sales Leader Social Commerce Adoption Customer Acquisition Expanding our reach to new audiences.
- 56. HELPS BOOST COLLAGEN & ELASTIN PRODUCTION IN YOUR SKIN. HELPS VISIBLY REDUCE FINE LINES & WRINKLES. CLINICALLY PROVEN TO HELP YOU LOOK MORE YOUTHFUL.
- 57. - 6,000 12,000 18,000 24,000 30,000 6/1/21 7/1/21 8/1/21 9/1/21 10/1/2111/1/2112/1/21 1/1/22 Collagen+ Subscription (US) LifePak Nano (US) Number of Customer Subscriptions Source: Nu Skin Internal Data 6/2021-1/2022
- 58. $- $20 $40 $60 $80 $100 $120 $140 $160 $180 $200 2018 2019 2020 2021 Manufacturing Segment Overview (in Millions)
- 59. • $673.4 M of revenue • FX negative impact of 2% • 120 basis point non-GAAP gross margin improvement • Lingering COVID-19 impact and restrictions FINANCIAL HIGHLIGHTS Q4 2021
- 60. • Revenue $2.70 B, 4% YOY revenue improvement, 11% YOY compared to 2019 • 70 basis point gross margin improvement • 90 basis point increase non-GAAP operating margin • Repurchased $80.4 M of stock – 3% • Generated $142 M cash from operations • Increased dividend for 21st year in early 2022 FINANCIAL HIGHLIGHTS 2021
- 61. Q 1 2 0 2 2 Guidance Overview Q1 Revenue Q1 EPS $560 - $590 M $0.65 - $0.75 (2) to (3)% foreign currency impact 21 to 25% tax rate
- 62. (1) to +3% revenue growth (1) to (2)% foreign currency impact Annual Revenue $2.66 - 2.77 B EPS $4.05 – 4.45 Operating Margin 11 – 11.5% (2) to 8%* 25% to 30% tax rate * Non GAAP – see reconciliation 2 0 2 2 Guidance Overview
- 63. 2019 2020 *2021 2022 Forecast 76% 74.5% 75.2% 75-76% * Non GAAP – see reconciliation Gross Margin
- 64. 2019 2020 2021 2022 Forecast % O F R E V E N U E 39.5% 39.5% 39.6% 39-40% Selling Expense
- 65. 2019 2020 2021 2022 Forecast 25.4% 25.0% 24.7% 24-25% G&A Expense
- 66. 2019 2020 *2021 2022 Forecast *Non-GAAP, see reconciliation 11% 10% 10.9% 11-11.5% Operating Margin
- 67. 2019 2020 2021 2022 Forecast $-12.9 $-1.3 $-1.5 $-2 to $-6 Other Income/Expense
- 68. 2019 2020 * 2021 2022 Forecast 32.0% 25.3% 26.9% 25%-30% Tax Rate *Non-GAAP, see reconciliation
- 69. 2019 2020 *2021 2022 Forecast Earnings Per Share $3.10 $3.63 $4.14 $4.05 - $4.45 *Non-GAAP, see reconciliation
- 70. Annual Dividend $0.20 $0.24 $0.28 $0.32 $0.36 $0.40 $0.42 $0.44 $0.46 $0.50 $0.59 $0.80 $1.20 $1.38 $1.40 $1.42 $1.44 $1.46 $1.48 $1.50 $1.52 $1.54 2001 2002 2003 2004 2005 2006 2007 2008 2009 2010 2011 2012 2013 2014 2015 2016 2017 2018 2019 2020 2021 2022 (proj) 21 YEARS OF GROWTH
- 71. Cash Overview • xxxx 2 0 2 1 C A S H H I G H L I G H T S Cash From Operations $250-300M CASH FLOW 2022 BREAKOUT Depreciation & Amortization $80M CAPEX $70-90M +$15M for China Facility
- 72. NU VISION 2025 To become the world’s leading integrated beauty & wellness company, powered by our dynamic affiliate opportunity platform
- 73. Q&A Nu Skin Investor Day
- 74. NON-GAAP RECONCILIATION TABLES NU SKIN ENTERPRISES, INC. Reconciliation of Earnings Per Share Excluding Impact of Restructuring and Impairment to GAAP Earnings Per Share (in thousands, except per share amounts) Years Ended December 31, 2021 Net income $ 147,266 Impact of restructuring and impairment: Restructuring and impairment 51,870 Inventory write-off 6,656 Income tax impact 6,933 Adjusted net income $ 212,725 Diluted earnings per share $ 2.86 Diluted earnings per share, excluding restructuring and impairment impact $ 4.14 Weighted-average common shares outstanding (000s): 51,427 NU SKIN ENTERPRISES, INC. Reconciliation of Effective Tax Rate Excluding Impact of Restructuring to GAAP Effective Tax Rate (in thousands, except per share amounts) Years Ended December 31, 2021 Provision for income taxes $ 85,193 Impact of restructuring on tax provision (6,933) Provision for income taxes, excluding impact of restructuring $ 78,260 Income before provision for income taxes $ 232,459 Impact of restructuring and impairment: Restructuring and impairment 51,870 Inventory write-off 6,656 Income before provision for income taxes, excluding restructuring and impairment impact $ 290,985 Effective tax rate 36.6% Effective tax rate, excluding restructuring and impairment impact 26.9%
- 75. NON-GAAP RECONCILIATION TABLES NU SKIN ENTERPRISES, INC. Reconciliation of Gross Margin Excluding Impact of Restructuring and Impairment to GAAP Gross Margin (in thousands, except per share amounts) NU SKIN ENTERPRISES, INC. Reconciliation of Operating Margin Excluding Impact of Restructuring to GAAP Operating Margin (in thousands, except per share amounts) Three Months Ended Years Ended December 31, December 31, 2021 2020 2021 2020 Operating income $ 20,319 $ 88,697 $ 233,992 $ 257,564 Impact of restructuring and impairment: Restructuring and impairment 51,870 — 51,870 — Inventory write-off 6,656 — 6,656 — Adjusted operating income $ 78,845 $ 88,697 $ 292,518 $ 257,564 Operating margin 3.0% 11.9% 8.7% 10.0% Operating margin, excluding restructuring and impairment impact 11.7% 11.9% 10.9% 10.0% Operating margin improvement (8.9)% (1.3)% Operating margin improvement, excluding restructuring and impairment impact (0.2)% 0.9% Revenue $ 673,436 $ 748,193 $ 2,695,669 $ 2,581,934 Three Months Ended Years Ended December 31, December 31, 2021 2020 2021 2020 Gross Profit $ 499,661 $ 553,442 $ 2,020,446 $ 1,923,906 Impact of restructuring and impairment: Inventory write-off 6,656 — 6,656 — Adjusted Gross Profit $ 506,317 $ 553,442 $ 2,027,102 $ 1,923,906 Gross margin 74.2% 74.0% 75.0% 74.5% Gross margin, excluding restructuring and impairment impact 75.2% 74.0% 75.2% 74.5% Gross margin improvement 0.2% 0.5% Gross margin improvement, excluding restructuring and impairment impact 1.2% 0.7% Revenue $ 673,436 $ 748,193 $ 2,695,669 $ 2,581,934
- 76. Non-GAAP Financial Measures: Constant-currency revenue change is a non-GAAP financial measure that removes the impact of fluctuations in foreign-currency exchange rates, thereby facilitating period-to- period comparisons of the company’s performance. It is calculated by translating the current period’s revenue at the same average exchange rates in effect during the applicable prior-year period and then comparing that amount to the prior-year period’s revenue. The company believes that constant-currency revenue change is useful to investors, lenders and analysts because such information enables them to gauge the impact of foreign-currency fluctuations on the company’s revenue from period to period. NON-GAAP – CONSTANT CURRENCY The following table sets forth revenue growth % for the years ended December 31, 2021 and projected 2022 for each of our reportable segments : 2021 2022 Projected Nu Skin: Reported Change Constant-Currency Change Reported Change Constant-Currency Change Mainland China -9% -15% -5 to 5% -5 to 5% Americas 21% 20% 5 to 10% 6 to 12% South Korea 9% 6% 0 to 4% 2 to 6% Southeast Asia/Pacific -7% -9% -10 to -5% -10 to -5% Japan -3% 0% -5 to 0% -1 to 4% EMEA 23% 18% 5 to 10% 8 to 13% Hong Kong/Taiwan 1% -2% -5 to 5% -5 to 5% Total Nu Skin 4% 1% -1 to 3% 0 to 5% Manufacturing 16% 16% -5 to 5% -5 to 5%
- 77. THANK YOU