Empfohlen

Empfohlen
Weitere ähnliche Inhalte
Andere mochten auch
Andere mochten auch (9)
Ähnlich wie Poster EAGE2014
Ähnlich wie Poster EAGE2014 (20)
Poster EAGE2014
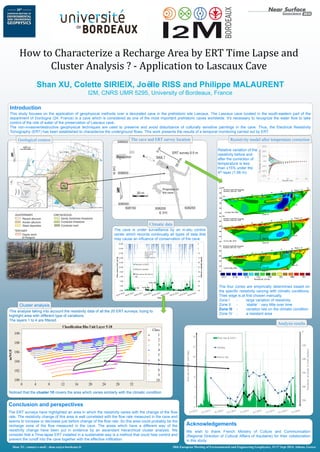
- 1. This analysis taking into account the resistivity data of all the 20 ERT surveys, trying to highlight area with different type of variations. The layers 1 to 4 are filtered. Noticed that the cluster 10 covers the area which varies similarly with the climatic condition. How to Characterize a Recharge Area by ERT Time Lapse and Cluster Analysis ? - Application to Lascaux Cave Shan XU, Colette SIRIEIX, Joëlle RISS and Philippe MALAURENT I2M, CNRS UMR 5295, University of Bordeaux, France 20th European Meeting of Environmental and Engineering Geophysics, 15-17 Sept 2014, Athens, Greece Introduction This study focuses on the application of geophysical methods over a decorated cave in the prehistoric site Lascaux. The Lascaux cave located in the south-eastern part of the department of Dordogne (24, France) is a cave which is considered as one of the most important prehistoric caves worldwide. It’s necessary to recognize the water flow to take control of the role of water of the preservation of Lascaux cave. The non-invasive/destructive geophysical techniques are used to preserve and avoid disturbance of culturally sensitive paintings in the cave. Thus, the Electrical Resistivity Tomography (ERT) has been established to characterize the underground flows. This work presents the results of a temporal monitoring carried out by ERT. The cave is under surveillance by an in-situ control center which records continually all types of data that may cause an influence of conservation of the cave. Acknowledgements We wish to thank French Ministry of Culture and Communication (Regional Direction of Cultural Affairs of Aquitaine) for their collaboration in this study. Shan XU, contact e-mail : shan.xu@u-bordeaux.fr lascaux.culture.fr The four zones are empirically determined based on the specific resistivity varying with climatic conditions. Their edge is at first chosen manually. Zone I - large variation of resistivity Zone II - ‘stable’ : vary little over time Zone III - variation lies on the climatic condition Zone IV - a resistant area Relative variation of the resistivity before and after the correction of temperature is less than ±15% under the 4th layer (1.06 m). -30% -20% -10% 0% 10% 20% 30% 0 5 10 15 20 %changeofresistivity Depth (m) Conclusion and perspectives The ERT surveys have highlighted an area in which the resistivity varies with the change of the flow rate. The resistivity change of this area is well correlated with the flow rate measured in the cave and seems to increase or decrease just before change of the flow rate. So this area could probably be the recharge zone of the flow measured in the cave. The areas which have a different way of the resistivity change have been put in evidence by an ascendant hierarchical cluster analysis. We consider that a Time-lapse ERT installed in a sustainable way is a method that could help control and prevent the runoff into the cave together with the effective infiltration. Geological context The cave and ERT survey location Resistivity model after temperature correction Climatic data Cluster analysis Analysis results