Weitere ähnliche Inhalte
Ähnlich wie Cash Budget Project
Ähnlich wie Cash Budget Project (20)
Cash Budget Project
- 1. 0 0 0 0 0 0 0 0 0 0 0 0 0 0
Des Moines
Franchise Sioux City Franchise
St. Paul
Franchise Year
Investment Tax
Credit
Double
Declining
Balance
Sum of Years
Digits
Total
Depreciation
for the Year
Book Value at
year end
Estimate
Selection
Ansari
0% 0% 0% 0% 0% 0% 0% 0% 0% 0% 0% 0% 0% 0%
Sales 1,560,000.00$ 1,200,000.00$ 960,000.00$ 1 39,000.00$ 100,286.00$ 139,286.00$ 250,714.00$ size 3,500 $2,000
Utilities 21,600.00$ 42,000.00$ 9,600.00$ 2 71,633.00$ 71,633.00$ 179,081.00$ Sales Estimates Advertising Food Costs Payroll Costs tax 10% Franchise Fee 4% Liquor License 1,000.00$ Rent $20 Paper Products 1.50% Laundry 0.60% Cash Short 0.50% Utilities 70% Repairs Salary 40 Bonus 1.50% year 1 year 2 year 3
Repairs 4,800.00$ 12,000.00$ 15,600.00$ 3 59,694.00$ 59,694.00$ 119,387.00$ year 1 1,280,000.00$ Year 1 75,000.00$ Year 1 35% Year 1 20% 256,000.00$ Year 1 51,200.00$ Year 1 2,200.00$ Year 1 $70,000 Year 1 19,200.00$ Year 1 7,680.00$ Year 1 6,400.00$ Year 1 29,400.00$ Year 1 14,000.00$ Year 1 40,000.00$ Year 1 -$ 50,000 50,000 50,000
Insurance 6,000.00$ 12,000.00$ 8,000.00$ 4 47,755.00$ 47,755.00$ 71,632.00$ year 2 1,400,000.00$ Year 2 75,000.00$ Year 2 35% Year 2 20% 280,000.00$ Year 2 56,000.00$ Year 2 1,200.00$ Year 2 $70,000 Year 2 21,000.00$ Year 2 8,400.00$ Year 2 7,000.00$ Year 2 31,400.00$ Year 2 14,000.00$ Year 2 40,000.00$ Year 2 -$ 50000 50000 50000
Telephone 4,800.00$ 10,000.00$ 14,400.00$ 5 35,816.00$ 35,816.00$ 35,816.00$ year 3 1,520,000.00$ Year 3 75,000.00$ Year 3 35% Year 3 20% 304,000.00$ Year 3 60,800.00$ Year 3 1,200.00$ Year 3 $70,000 Year 3 22,800.00$ Year 3 9,120.00$ Year 3 7,600.00$ Year 3 33,400.00$ Year 3 14,000.00$ Year 3 40,000.00$ Year 3 -$
6 23,877.00$ 23,877.00$ 11,939.00$ Cash Sales 40.00%
7 11,939.00$ 11,939.00$ -$ Bank Credit 57.00% 95%
Non-Bank 3.00%
Credit Expense 2.10%
January February March April May June July August September October November December January February March April May June July August September October November December January February March April May June July August September October November December January February March April May
Revenues
Cash Sales 42,667$ 42,667$ 42,667$ 42,667$ 42,667$ 42,667$ 42,667$ 42,667$ 42,667$ 42,667$ 42,667$ 42,667$ 46,667$ 46,667$ 46,667$ 46,667$ 46,667$ 46,667$ 46,667$ 46,667$ 46,667$ 46,667$ 46,667$ 46,667$ 50,667$ 50,667$ 50,667$ 50,667$ 50,667$ 50,667$ 50,667$ 50,667$ 50,667$ 50,667$ 50,667$ 50,667$ 50,667$ 50,667$ 50,667$
Credit Sales 60,800$ 60,800$ 60,800$ 60,800$ 60,800$ 60,800$ 60,800$ 60,800$ 60,800$ 60,800$ 60,800$ 60,800$ 66,500$ 66,500$ 66,500$ 66,500$ 66,500$ 66,500$ 66,500$ 66,500$ 66,500$ 66,500$ 66,500$ 66,500$ 72,200$ 72,200$ 72,200$ 72,200$ 72,200$ 72,200$ 72,200$ 72,200$ 72,200$ 72,200$ 72,200$ 72,200$ 72,200$ 72,200$ 72,200$
Non bank sales -$ 3,200$ 3,200$ 3,200$ 3,200$ 3,200$ 3,200$ 3,200$ 3,200$ 3,200$ 3,200$ 3,200$ 3,200$ 3,500$ 3,500$ 3,500$ 3,500$ 3,500$ 3,500$ 3,500$ 3,500$ 3,500$ 3,500$ 3,500$ 3,500$ 3,800$ 3,800$ 3,800$ 3,800$ 3,800$ 3,800$ 3,800$ 3,800$ 3,800$ 3,800$ 3,800$ 3,800$ 3,800$ 3,800$
Expenses
Advertising 6,250$ 6,250$ 6,250$ 6,250$ 6,250$ 6,250$ 6,250$ 6,250$ 6,250$ 6,250$ 6,250$ 6,250$ 6,250$ 6,250$ 6,250$ 6,250$ 6,250$ 6,250$ 6,250$ 6,250$ 6,250$ 6,250$ 6,250$ 6,250$ 6,250$ 6,250$ 6,250$ 6,250$ 6,250$ 6,250$ 6,250$ 6,250$ 6,250$ 6,250$ 6,250$ 6,250$ -$ -$ -$
Food Costs 37,333$ 37,333$ 37,333$ 37,333$ 37,333$ 37,333$ 37,333$ 37,333$ 37,333$ 37,333$ 37,333$ 37,333$ 40,833$ 40,833$ 40,833$ 40,833$ 40,833$ 40,833$ 40,833$ 40,833$ 40,833$ 40,833$ 40,833$ 40,833$ 44,333$ 44,333$ 44,333$ 44,333$ 44,333$ 44,333$ 44,333$ 44,333$ 44,333$ 44,333$ 44,333$ 44,333$ 44,333$ 44,333$ 44,333$
Payroll Costs 21,333$ 21,333$ 21,333$ 21,333$ 21,333$ 21,333$ 21,333$ 21,333$ 21,333$ 21,333$ 21,333$ 21,333$ 23,333$ 23,333$ 23,333$ 23,333$ 23,333$ 23,333$ 23,333$ 23,333$ 23,333$ 23,333$ 23,333$ 23,333$ 25,333$ 25,333$ 25,333$ 25,333$ 25,333$ 25,333$ 25,333$ 25,333$ 25,333$ 25,333$ 25,333$ 25,333$ 25,333$ 25,333$ 25,333$
Payroll Tax 2,133$ 2,133$ 2,133$ 2,133$ 2,133$ 2,133$ 2,133$ 2,133$ 2,133$ 2,133$ 2,133$ 2,133$ 2,333$ 2,333$ 2,333$ 2,333$ 2,333$ 2,333$ 2,333$ 2,333$ 2,333$ 2,333$ 2,333$ 2,333$ 2,533$ 2,533$ 2,533$ 2,533$ 2,533$ 2,533$ 2,533$ 2,533$ 2,533$ 2,533$ 2,533$ 2,533$ 2,533$ 2,533$ 2,533$
Franchise Fee 54,267$ 4,267$ 4,267$ 4,267$ 4,267$ 4,267$ 4,267$ 4,267$ 4,267$ 4,267$ 4,267$ 4,267$ 4,667$ 4,667$ 4,667$ 4,667$ 4,667$ 4,667$ 4,667$ 4,667$ 4,667$ 4,667$ 4,667$ 4,667$ 5,067$ 5,067$ 5,067$ 5,067$ 5,067$ 5,067$ 5,067$ 5,067$ 5,067$ 5,067$ 5,067$ 5,067$ 5,067$ 5,067$ 5,067$
Liquor License 2,200$ -$ -$ -$ -$ -$ -$ -$ -$ -$ -$ -$ 1,200$ -$ -$ -$ -$ -$ -$ -$ -$ -$ -$ -$ 1,200$ -$ -$ -$ -$ -$ -$ -$ -$ -$ -$ -$ 1,200$ -$ -$
Inventory 15,000$ -$ -$ -$ -$ -$ -$ -$ -$ -$ -$ -$ -$ -$ -$ -$ -$ -$ -$ -$ -$ -$ -$ -$ -$ -$ -$ -$ -$ -$ -$ -$ -$ -$ -$ -$ 15,000$ -$ -$
Rent 5,833$ 5,833$ 5,833$ 5,833$ 5,833$ 5,833$ 5,833$ 5,833$ 5,833$ 5,833$ 5,833$ 5,833$ 5,833$ 5,833$ 5,833$ 5,833$ 5,833$ 5,833$ 5,833$ 5,833$ 5,833$ 5,833$ 5,833$ 5,833$ 5,833$ 5,833$ 5,833$ 5,833$ 5,833$ 5,833$ 5,833$ 5,833$ 5,833$ 5,833$ 5,833$ 5,833$ 5,833$ 5,833$ 5,833$
Paper Products 1,600$ 1,600$ 1,600$ 1,600$ 1,600$ 1,600$ 1,600$ 1,600$ 1,600$ 1,600$ 1,600$ 1,600$ 1,750$ 1,750$ 1,750$ 1,750$ 1,750$ 1,750$ 1,750$ 1,750$ 1,750$ 1,750$ 1,750$ 1,750$ 1,900$ 1,900$ 1,900$ 1,900$ 1,900$ 1,900$ 1,900$ 1,900$ 1,900$ 1,900$ 1,900$ 1,900$ 1,900$ 1,900$ 1,900$
Laundry/maintence 640$ 640$ 640$ 640$ 640$ 640$ 640$ 640$ 640$ 640$ 640$ 640$ 700$ 700$ 700$ 700$ 700$ 700$ 700$ 700$ 700$ 700$ 700$ 700$ 760$ 760$ 760$ 760$ 760$ 760$ 760$ 760$ 760$ 760$ 760$ 760$ 760$ 760$ 760$
Cash Short 533$ 533$ 533$ 533$ 533$ 533$ 533$ 533$ 533$ 533$ 533$ 533$ 583$ 583$ 583$ 583$ 583$ 583$ 583$ 583$ 583$ 583$ 583$ 583$ 633$ 633$ 633$ 633$ 633$ 633$ 633$ 633$ 633$ 633$ 633$ 633$ 633$ 633$ 633$
Utlities -$ 2,450$ 2,450$ 2,450$ 2,450$ 2,450$ 2,450$ 2,450$ 2,450$ 2,450$ 2,450$ 2,450$ 2,450$ 2,617$ 2,617$ 2,617$ 2,617$ 2,617$ 2,617$ 2,617$ 2,617$ 2,617$ 2,617$ 2,617$ 2,617$ 2,783$ 2,783$ 2,783$ 2,783$ 2,783$ 2,783$ 2,783$ 2,783$ 2,783$ 2,783$ 2,783$ 2,783$ 2,783$ 2,783$
Credit Card Charge 1,344$ 1,344$ 1,344$ 1,344$ 1,344$ 1,344$ 1,344$ 1,344$ 1,344$ 1,344$ 1,344$ 1,344$ 1,470$ 1,470$ 1,470$ 1,470$ 1,470$ 1,470$ 1,470$ 1,470$ 1,470$ 1,470$ 1,470$ 1,470$ 1,596$ 1,596$ 1,596$ 1,596$ 1,596$ 1,596$ 1,596$ 1,596$ 1,596$ 1,596$ 1,596$ 1,596$ 1,596$ 1,596$ 1,596$
Repairs -$ 1,167$ 1,167$ 1,167$ 1,167$ 1,167$ 1,167$ 1,167$ 1,167$ 1,167$ 1,167$ 1,167$ 1,167$ 1,167$ 1,167$ 1,167$ 1,167$ 1,167$ 1,167$ 1,167$ 1,167$ 1,167$ 1,167$ 1,167$ 1,167$ 1,167$ 1,167$ 1,167$ 1,167$ 1,167$ 1,167$ 1,167$ 1,167$ 1,167$ 1,167$ 1,167$ 1,167$ 1,167$ 1,167$
Insurance -$ 1,000$ 1,000$ 1,000$ 1,000$ 1,000$ 1,000$ 1,000$ 1,000$ 1,000$ 1,000$ 1,000$ 1,000$ 1,000$ 1,000$ 1,000$ 1,000$ 1,000$ 1,000$ 1,000$ 1,000$ 1,000$ 1,000$ 1,000$ 1,000$ 1,000$ 1,000$ 1,000$ 1,000$ 1,000$ 1,000$ 1,000$ 1,000$ 1,000$ 1,000$ 1,000$ 1,000$ 1,000$ 1,000$
Telephone -$ 833$ 833$ 833$ 833$ 833$ 833$ 833$ 833$ 833$ 833$ 833$ 833$ 833$ 833$ 833$ 833$ 833$ 833$ 833$ 833$ 833$ 833$ 833$ 833$ 833$ 833$ 833$ 833$ 833$ 833$ 833$ 833$ 833$ 833$ 833$ 833$ 833$ 833$
Income Tax -$ -$ -$ -$ -$ -$ -$ -$ -$ -$ -$ -$ -$ (39,000)$ -$ -$ -$ -$ -$ -$ -$ -$ -$ -$ -$ 36,394$ -$ -$ -$ -$ -$ -$ -$ -$ -$ -$ -$ 71,943$ -$
Fixed Asset Purchase 390,000$
Professional Service 300$ 300$ 300$ 300$ 300$ 300$ 300$ 300$ 300$ 300$ 300$ 300$ 300$ 300$ 300$ 300$ 300$ 300$ 300$ 300$ 300$ 300$ 300$ 300$ 300$ 300$ 300$ 300$ 300$ 300$ 300$ 300$ 300$ 300$ 300$ 300$ 300$ 300$ 300$
Salary 3,333$ 3,333$ 3,333$ 3,333$ 3,333$ 3,333$ 3,333$ 3,333$ 3,333$ 3,333$ 3,333$ 3,333$ 3,333$ 3,333$ 3,333$ 3,333$ 3,333$ 3,333$ 3,333$ 3,333$ 3,333$ 3,333$ 3,333$ 3,333$ 3,333$ 3,333$ 3,333$ 3,333$ 3,333$ 3,333$ 3,333$ 3,333$ 3,333$ 3,333$ 3,333$ 3,333$ 3,333$ 3,333$ 3,333$
Bonus -$ -$ -$ -$ -$ -$ -$ -$ -$ -$ -$ -$ -$ -$ -$ -$ -$ -$ -$ -$ -$ -$ -$ -$ -$ -$ -$ -$ -$ -$ -$ -$ -$ -$ -$ -$ -$ -$ -$
8 Interest Expense Avg. Borrowing
buffer 20,000.00$ Interest 8% 51,195$ 213,311$
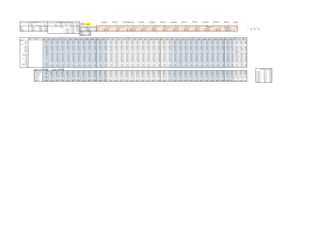
Beginning cash balance 50,000$ 20,000$ 33,592$ 47,184$ 60,775$ 74,367$ 87,959$ 101,551$ 115,142$ 128,734$ 142,326$ 155,918$ 20,000$ 36,603$ 93,538$ 111,474$ 129,410$ 147,346$ 165,282$ 183,218$ 201,153$ 219,089$ 237,025$ 254,961$ 20,000$ 41,636$ 28,211$ 51,180$ 74,149$ 97,118$ 120,087$ 143,057$ 166,026$ 188,995$ 211,964$ 234,933$ 251,675$ 264,735$ 222,053$ 50,000$ 51,195$ 213,311$
Cash from operations 103,467$ 106,667$ 106,667$ 106,667$ 106,667$ 106,667$ 106,667$ 106,667$ 106,667$ 106,667$ 106,667$ 106,667$ 116,367$ 116,667$ 116,667$ 116,667$ 116,667$ 116,667$ 116,667$ 116,667$ 116,667$ 116,667$ 116,667$ 116,667$ 126,367$ 126,667$ 126,667$ 126,667$ 126,667$ 126,667$ 126,667$ 126,667$ 126,667$ 126,667$ 126,667$ 126,667$ 126,667$ 126,667$ 126,667$ 75,000$ 46,716$ 194,652$
Total available cash 153,467$ 126,667$ 140,258$ 153,850$ 167,442$ 181,034$ 194,626$ 208,217$ 221,809$ 235,401$ 248,993$ 262,584$ 136,367$ 153,269$ 210,205$ 228,141$ 246,077$ 264,013$ 281,948$ 299,884$ 317,820$ 335,756$ 353,692$ 371,628$ 146,367$ 168,302$ 154,878$ 177,847$ 200,816$ 223,785$ 246,754$ 269,723$ 292,692$ 315,662$ 338,631$ 361,600$ 378,341$ 391,402$ 348,719$ 100,000$ 42,736$ 178,069$
less disbursements 542,101$ 90,351$ 90,351$ 90,351$ 90,351$ 90,351$ 90,351$ 90,351$ 90,351$ 90,351$ 90,351$ 90,351$ 98,037$ 58,003$ 97,003$ 97,003$ 97,003$ 97,003$ 97,003$ 97,003$ 97,003$ 97,003$ 97,003$ 97,003$ 104,689$ 140,050$ 103,656$ 103,656$ 103,656$ 103,656$ 103,656$ 103,656$ 103,656$ 103,656$ 103,656$ 103,656$ 113,606$ 169,349$ 97,406$ 125,000$ 38,756$ 161,485$
interest expense -$ 2,724$ 2,724$ 2,724$ 2,724$ 2,724$ 2,724$ 2,724$ 2,724$ 2,724$ 2,724$ 2,724$ 1,727$ 1,727$ 1,727$ 1,727$ 1,727$ 1,727$ 1,727$ 1,727$ 1,727$ 1,727$ 1,727$ 1,727$ 42$ 42$ 42$ 42$ 42$ 42$ 42$ 42$ 42$ 42$ 42$ 42$ -$ -$ -$ 150,000$ 34,776$ 144,902$
Cash balance (388,634)$ 33,592$ 47,184$ 60,775$ 74,367$ 87,959$ 101,551$ 115,142$ 128,734$ 142,326$ 155,918$ 169,510$ 36,603$ 93,538$ 111,474$ 129,410$ 147,346$ 165,282$ 183,218$ 201,153$ 219,089$ 237,025$ 254,961$ 272,897$ 41,636$ 28,211$ 51,180$ 74,149$ 97,118$ 120,087$ 143,057$ 166,026$ 188,995$ 211,964$ 234,933$ 257,902$ 264,735$ 222,053$ 251,313$ 175,000$ 30,796$ 128,319$
add borrowing 408,634$ -$ -$ -$ -$ -$ -$ -$ -$ -$ -$ -$ -$ -$ -$ -$ -$ -$ -$ -$ -$ -$ -$ -$ -$ -$ -$ -$ -$ -$ -$ -$ -$ -$ -$ -$ -$ -$ -$ 200,000$ 26,816$ 111,735$
payments -$ -$ -$ -$ -$ -$ -$ -$ -$ -$ -$ 149,510$ -$ -$ -$ -$ -$ -$ -$ -$ -$ -$ -$ 252,897$ -$ -$ -$ -$ -$ -$ -$ -$ -$ -$ -$ 6,228$ -$ -$ -$ 225,000$ 22,836$ 95,152$
total borrowing 408,634$ 408,634$ 408,634$ 408,634$ 408,634$ 408,634$ 408,634$ 408,634$ 408,634$ 408,634$ 408,634$ 259,124$ 259,124$ 259,124$ 259,124$ 259,124$ 259,124$ 259,124$ 259,124$ 259,124$ 259,124$ 259,124$ 259,124$ 6,228$ 6,228$ 6,228$ 6,228$ 6,228$ 6,228$ 6,228$ 6,228$ 6,228$ 6,228$ 6,228$ 6,228$ -$ -$ -$ -$ 250,000$ 18,856$ 78,569$
Ending cash 20,000$ 33,592$ 47,184$ 60,775$ 74,367$ 87,959$ 101,551$ 115,142$ 128,734$ 142,326$ 155,918$ 20,000$ 36,603$ 93,538$ 111,474$ 129,410$ 147,346$ 165,282$ 183,218$ 201,153$ 219,089$ 237,025$ 254,961$ 20,000$ 41,636$ 28,211$ 51,180$ 74,149$ 97,118$ 120,087$ 143,057$ 166,026$ 188,995$ 211,964$ 234,933$ 251,675$ 264,735$ 222,053$ 251,313$ 275,000$ 14,876$ 61,985$
300,000$ 11,633$ 48,472$
Year 4
Other Franchise Utility Costs Exhibit 1: Fixed Asset Depreciation Schedule
Year 1 year 2 year 3
- 2. Net Sales 1,280,000.00$ Net Sales 1,400,000.00$ Net Sales 1,520,000.00$
Cost of Goods Sold 448,000.00$ Cost of Goods Sold 490,000.00$ Cost of Goods Sold 532,000.00$
Gross Margin 832,000.00$ Gross Margin 910,000.00$ Gross Margin 988,000.00$
Operating Expense: Operating Expense: Operating Expense:
Advertising 75,000.00$ Advertising 75,000.00$ Advertising 75,000.00$
Payroll Cost 256,000.00$ Payroll Cost 280,000.00$ Payroll Cost 304,000.00$
Payroll Tax 25,600.00$ Payroll Tax 28,000.00$ Payroll Tax 30,400.00$
Franchise fee 51,200.00$ Franchise fee 56,000.00$ Franchise fee 60,800.00$
Liquor License 1,200.00$ Liquor License 1,200.00$ Liquor License 1,200.00$
Rent 70,000.00$ Rent 70,000.00$ Rent 70,000.00$
Paper Products 19,200.00$ Paper Products 21,000.00$ Paper Products 22,800.00$
Laundry 7,680.00$ Laundry 8,400.00$ Laundry 9,120.00$
Credit Card Charges 17,598.00$ Credit Chard Charges 17,766.00$ Credit Card Charges 17,556.00$
Cash Short 6,400.00$ Cash Short 7,000.00$ Cash Short 7,600.00$
Utilities 29,400.00$ Utilities 31,400.00$ Utilities 33,400.00$
Repairs 14,000.00$ Repairs 14,000.00$ Repairs 14,000.00$
Insurance 12,000.00$ Insurance 12,000.00$ Insurance 12,000.00$
Telephone 10,000.00$ Telephone 10,000.00$ Telephone 10,000.00$
Profesional Service 3,600.00$ Profesional Service 3,600.00$ Profesional Service 3,600.00$
Salary 40,000.00$ Salary 40,000.00$ Salary 40,000.00$
Bonus ‐$ Bonus ‐$ Bonus ‐$
EBITDA 193,122.00$ EBITDA 234,634.00$ EBITDA 276,524.00$
Depreciation 139,286.00$ Depreciation 71,633.00$ Depreciation 59,694.00$
Amortization $10,200.00 Amortization 10,200.00$ Amortization 10,200.00$
EBIT 43,636.00$ EBIT 152,801.00$ EBIT 206,630.00$
Interest Expense 29,966.49$ Interest Expense 20,729.96$ Interest Expense 498.22$
EBT 13,669.51$ EBT 132,071.04$ EBT 206,131.78$
Income Tax (39,000.00)$ Income Tax 36,394.10$ Income Tax 71,943.25$
Net Income 52,669.51$ Net Income 95,676.94$ Net Income 134,188.52$
Income Statement
For the Year ending February 31, 2006
Income Statement
For the Year ending February 31, 2004
Income Statement
For the Year ending February 31, 2005
- 4. Based on the information given we think the restaurant has the potential to be good investment for Harshini Ansari.
The first year of operations shows a net income of roughly $50,000, and borrowing of over $400,000, which will not be paid off until the end of year
three. This high amount of debt, coupled with her low personal contribution, makes the investment risky. The added factor that the investment is a
restaurant, one of the most‐likely‐to‐fail businesses that are started, we would encourage Ansari use caution when making the investment decision.
Having acknowledged the risk, there is profit to be made from the investment.
The restuarant is projected to be profitable in years two and three, and a decreasing level of debt as the loan is payed off means that the risk will
decrease as well. She may want to consider finding a partner. If the partner also invests $50,000, the risk is split between both partners and the overall
interest expense and debt burden is decreased. A table of our findings concerning starting cash and interest expense and average borrowing can be
found in the cash budget sheet. We also considered Waller's estimates to see what the difference was between the two sets of estimates. By selecting
the last name via the dropdown in the Cash Budget sheet, the cash budget and Income Statement will be changed to reflect that set of estimates.
Spinners were added to all expense numbers to factor in growth potential in any specific expense.