Pakistani Call girls in Sharjah 0505086370 Sharjah Call girls
Alameda County CA Strategic Plan FY 2017
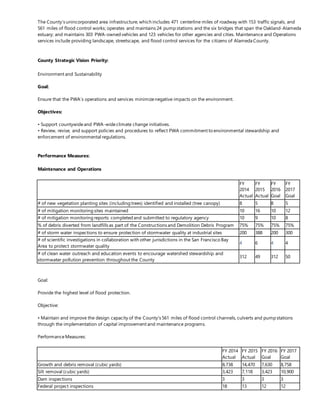
1. The County’s unincorporated area infrastructure, which includes 471 centerline miles of roadway with 153 traffic signals, and
561 miles of flood control works; operates and maintains 24 pump stations and the six bridges that span the Oakland-Alameda
estuary; and maintains 303 PWA-owned vehicles and 123 vehicles for other agencies and cities. Maintenance and Operations
services include providing landscape, streetscape, and flood control services for the citizens of Alameda County.
County Strategic Vision Priority:
Environment and Sustainability
Goal:
Ensure that the PWA’s operations and services minimizenegative impacts on the environment.
Objectives:
• Support countywideand PWA-wideclimate change initiatives.
• Review, revise, and support policies and procedures to reflect PWA commitment to environmental stewardship and
enforcement of environmental regulations.
Performance Measures:
Maintenance and Operations
FY
2014
Actual
FY
2015
Actual
FY
2016
Goal
FY
2017
Goal
# of new vegetation planting sites (including trees) identified and installed (tree canopy) 8 5 8 5
# of mitigation monitoring sites maintained 10 16 10 12
# of mitigation monitoring reports completed and submitted to regulatory agency 10 9 10 8
% of debris diverted from landfills as part of the Constructions and Demolition Debris Program 75% 75% 75% 75%
# of storm water inspections to ensure protection of stormwater quality at industrial sites 200 388 200 300
# of scientific investigations in collaboration with other jurisdictions in the San Francisco Bay
Area to protect stormwater quality
4 6 4 4
# of clean water outreach and education events to encourage watershed stewardship and
stormwater pollution prevention throughout the County
312 49 312 50
Goal:
Provide the highest level of flood protection.
Objective:
• Maintain and improve the design capacity of the County's 561 miles of flood control channels, culverts and pump stations
through the implementation of capital improvement and maintenance programs.
PerformanceMeasures:
FY 2014
Actual
FY 2015
Actual
FY 2016
Goal
FY 2017
Goal
Growth and debris removal (cubic yards) 8,738 14,470 7,630 8,758
Silt removal (cubic yards) 3,423 7,118 3,423 10,900
Dam inspections 3 3 3 3
Federal project inspections 18 13 12 12
2. # of flood control projects constructed 8 6 8 6
# of completed plans, specifications and estimates for current capital projects 10 9 10 7
County Strategic Vision Priority: Safe and Livable Communities
Goal:
Provide service levels that optimize infrastructure life cycleand minimize deferred maintenance.
Objectives:
• Ensure that permitted encroachments into the County's infrastructure adhere to applicable standards and codes.
• Implement and improve service levels to the County Service Area programs.
PerformanceMeasures:
FY
2014
Actual
FY
2015
Actual
FY
2016
Goal
FY
2017
Goal
# of district encroachment, watercourse and grading permits inspected 60 55 60 60
# of roadway, utility and move permits 1,500 2181 1,800 2,000
# of stakeholder meetings conducted in County Service Areas to determine service levels
provided
12 12 12 12
# of annual reports along with supporting work plans prepared for the County Service Areas 7 7 7 7
Goal:
Maximize mobility through safe and well-maintained roadway systems.
Objective:
• Improve traffic safety and efficiency through traffic management, signing and striping, traffic calming, speed enforcement,
and operational improvements.
PerformanceMeasures:
FY
2014
Actual
FY
2015
Actual
FY
2016
Goal
FY
2017
Goal
# of roadways on which engineering and traffic surveys were performed to support the Radar
Enforcement Program
35 18 35 20
# of traffic calming plans installed in the community 2 3 3 3
# of work orders processed to improve traffic safety and operations in the community 90 126 75 120
County Strategic Vision Priority: Housing
Goal:
Ensure that development and building construction adhere to applicable State and County plans, codes and ordinances.
Objectives:
• Provide an effectiveand efficient Building Permit Center.
3. • Ensure that development projects, encroachments and all residential and commercial structures conform to applicable State
and County plans, codes, ordinances and accepted County roadway and flood control design criteria.
PerformanceMeasures:
FY
2014
Actual
FY
2015
Actual
FY
2016
Goal
FY
2017
Goal
% of inspections provided on the day requested 100% 100% 100% 100%
# of next-day inspections service provided for requests received by 12:00 am 100% 100% 100% 100%
Building plans for small size projects reviewed within one week of submittal 85% 85% 80% 80%
Building plans for medium size projects reviewed within two weeks of submittal 85% 85% 80% 80%
Building plans for new construction reviewed within four weeks submittal 80% 80% 80% 50%
All building inspectors trained as disaster service workers 100% 100% 100% 100%
% of permit tracking, issuance, and other building inspection services conducted online or by
phone
50% 55% 60% 60%
Create, revise, and update informational handouts for customers 8 10 10 10
# of approved flood control projects for development within cities 22 44 25 45
# of district encroachment, watercourse and grading permits issued 55 55 75 60
# of approved development projects 15 14 15 15
County Strategic Vision Priority: Transportation
Goal:
Maximize mobility through safe and well-maintained roadway systems
.
Objectives:
• Improve safety for pedestrians, bicyclists, and motorists throughout the County by implementing capital improvement and
maintenanceprograms while leveraging appropriate funding and technologies.
• Take on leadership and collaborative roles and engage in partnerships to address transportation challenges.
PerformanceMeasures:
FY
2014
Actual
FY
2015
Actual
FY
2016
Goal
FY
2017
Goal
# of road capital projects constructed 12 13 14 14
# of completed plans, specifications and estimates for current capital projects 10 17 10 10
# of transportation grant applications submitted 14 20 15 20
Total amount of State and federal grants procured for road capital projects (millions) $2.5 $3.4 $3.0 $3.0
% of roadway miles rehabilitated 9 5.7 9 10
Miles of slurry seal installed 6.5 0 5 5
Miles of overlay installed 9.4 7.22 10 9
# of ramps installed for the disabled 55 20 60 60
# of local, regional, and State meetings attended to advocate for and develop funding for
transportation projects
100 120 110 125
Street sweeping (curb miles) 10,174 9,898 13,657 13,738
Drop inlet cleaning/inspection (each) 6,450 7,630 6,285 8,325
Total lane miles maintained 990 990 990 990
Urban lane miles 652 652 652 652
Rural lane miles 338 338 338 338