The Impact of Zambia's Child Grant Program (CGP) on Child Height
•Als PPTX, PDF herunterladen•
0 gefällt mir•524 views

An examination of the effect of Zambias Child Grant Program on child height. The CGP is an unconditional cash transfer targeted at rural households with children under age 5.

Empfohlen
Empfohlen
Weitere ähnliche Inhalte
Was ist angesagt?
Was ist angesagt? (20)
Ähnlich wie The Impact of Zambia's Child Grant Program (CGP) on Child Height
Ähnlich wie The Impact of Zambia's Child Grant Program (CGP) on Child Height (20)
Mehr von The Transfer Project
Mehr von The Transfer Project (20)
Kürzlich hochgeladen
Kürzlich hochgeladen (20)
The Impact of Zambia's Child Grant Program (CGP) on Child Height
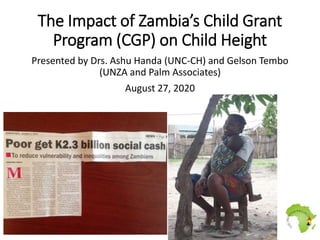
- 1. The Impact of Zambia’s Child Grant Program (CGP) on Child Height Presented by Drs. Ashu Handa (UNC-CH) and Gelson Tembo (UNZA and Palm Associates) August 27, 2020
- 2. Evolution of social cash transfers in Zambia GRZ budget contribution went from US$5m to US$35m in 2014, US$45m in 2015 and US$66m in 2018 0 100000 200000 300000 400000 500000 600000 700000 2003 2005 2007 2009 2011 2013 2015 2017 2019 Households Reached by Cash Transfers in Zambia CGP, MCP pilotsKalomo, Chipata pilots 628,000 hhlds 15% of population Merger into one harmonized program, scale-up
- 3. The Child Grant Program (CGP) • One of two pilots initiated in 2010 to test alternative cash transfer designs • Implemented by Ministry of Community Development and Social Services (MCDSS) • Target: Any households with a child under 3 enrolled • Unconditional cash transfer, 55 Kwacha per month (increased over time), paid in cash bi-monthly • No differentiation by household size • Three districts: Shangombo, Kalabo and Kaputa
- 4. Survey waves and sample size N=2519 Treatment Group=1259 (45 CWACs) Control Group=1260 (45 CWACs) 2010 Baseline 2012 24m follow-up (N=2298) 2013 36m follow-up (N=2459) 2014 48m follow-up (N=2423) 2017 84m follow-up (N=2138) Longitudinal cluster randomized control trial Stage 1: Randomly selection CWACs for the study (30 per district) Stage 2: Randomly assign CWACs to intervention or control, 15 per district in each group [45 intervention CWACs, 45 control]
- 5. 5 Random selection of CWACs at MCDSS
- 6. Access to Kalabo and Shangombo improved dramatically over the study period Baseline 2010 2017 follow-up
- 7. Baseline extreme poverty rates much higher than rural households (mean consumption per person per day US$0.30) 65 95.5 0 10 20 30 40 50 60 70 80 90 100 Extreme Poverty Extreme Poverty Rates of CGP households at Baseline All Zambia Rural CGP
- 8. CGP households much more food insecure than all rural households 5.4 21 0 5 10 15 20 25 30 35 40 45 50 <2 meals per day Percentage eating <2 meals per day All Zambia Rural CGP
- 9. Demographic profile of CGP households0.02.04.06.08.1 Density 0 20 40 60 80 100 Age in years preschoolers prime-age adults
- 10. And how it’s changing over time 0 .01.02.03.04.05 0 20 40 60 80 100 age_final 2010 2014 Ageing of the study households Pre-school children ageing
- 11. Age distribution of young children at 48-month wave 0 .005 .01 .015 .02 Density 0 10 20 30 40 50 60 70 80 90 100 110 120 Age of child in months Children born during the study (fully treated) N=5,389 children Started receiving cash in first year of life
- 12. Core methodology: Compare trend in control group vs. trend in treatment group 30 35 40 45 50 55 60 65 70 75 80 Baseline 24-months 36-months 48-months Per capita consumption ZMW Treatment Control Subtract this portion to get net effect of program Net impact of Program (ZMW20)
- 13. Can we expect an unconditional cash transfer to improve child nutrition? • Systematic review by Manley, Gitter, Slavchevska (2013) covered 17 programs and 21 studies (CCTs and UCTs) • Did not find evidence of significant positive effects of CTs on nutritional status • Updated review by de Groot (2017) found similar results • Evidence to date suggests that cash alone is not enough to improve child nutritional status—why is this?
- 14. Conceptual framework for child nutrition: Cash can directly affect food pillar, but may not affect other two pillars. Supply side factors influence many aspects of caring behavior and disease environment Source: Adapted from Black, Allen et al. (2008)
- 15. Main Results
- 16. Trends in stunting over time by study arm: No significant differences 0.1 0.15 0.2 0.25 0.3 0.35 0.4 0.45 0.5 Baseline 24-months 36-months 48-months Stunting rates for 0-36 month old children at each wave (repeated cross-sections) Treatment Control
- 17. Trends in height for age z-score over time by study arm: No significant differences -1.7 -1.5 -1.3 -1.1 -0.9 -0.7 -0.5 Baseline 24-months 36-months 48-months HAZ for 0-36 month old children at each wave (repeated cross-sections) Treatment Control
- 18. Regression estimates of impact on height for age z- score: no statistically significant effects -0.4 -0.3 -0.2 -0.1 0 0.1 0.2 0.3 0.4 Pooled cross section Cohort 0-36 at baseline Panel 0-11 at baseline Born into sample CGP impacts on HAZ at 48-month wave All Boys Girls
- 19. Regression estimates of impact on stunting (<-2 HAZ): no statistically significant effects -0.2 -0.15 -0.1 -0.05 0 0.05 0.1 0.15 0.2 Pooled cross section Cohort 0-36 at baseline Panel 0-11 at baseline Born into sample CGP impacts on stunting at 48-month wave All Boys Girls
- 20. Did the CGP affect any of the three pathways to child nutrition? Yes! 24-month 36-month 48-month Plausible mechanisms Environmental inputs Household has access to toilet facilities n/a + NS Household uses clean water source n/a + NS Roof of dwelling made of purchased material n/a NS NS Floor of dwelling made of purchased material n/a + NS Wall of dwelling made of purchased material n/a NS NS Food inputs Child meal frequency (three or more) [19-32 percentage points] + + + Household food expenditure per capita [16-28 percent] + + + Child consumed food from four or more food groups n/a n/a NS Child consumed protein rich foods [13 percentage points] n/a n/a + Child consumed dairy products [10 percentage points] n/a n/a + Health inputs and behaviour Household owns a mosquito net NS NS NS Child sick during last two weeks NS NS NS Child has health card NS NS NS Child taken to well-baby or under-five clinic in last six months NS NS + Child received vitamin A dose NS n/a n/a Child received one BCG, three Polio, three DPT and one measles vaccines NS n/a n/a
- 21. Supply-side constraints high in these communities: Health facility survey conducted in study CWACs at baseline • Over 50% of health facilities in these CWACs are health posts or dispensaries (32 facilities total) • Less than 20% of health facilities have at least one registered nurse on staff • Only 6% had electricity, 8% had protected water source
- 22. Almost all provide well-baby clinic and ANC, fewer provide treatment for acute malnutrition Services provided in 32 health facilities in study CWACs VARIABLES mean Outpatient consultations 0.677 Obstetric 0.484 Well-baby clinic 0.935 Antenatal 0.871 Family planning 0.774 Mobile clinic 0.387 Treatment for acute malnutrition for children 0.387 Child health day/ immunization campaign 0.742
- 23. Drugs, supplies available on day of survey in 32 health facilities
- 24. Other observations: CGP had very large productive effects, and improved overall household food security and consumption dramatically Total consumption pc [24m] [36m] Food security scale (HFIAS) [24m] [36m] Overall asset index [24m] [36m] Relative poverty index [24m] [36m] Incomes & Revenues index (SD) [24m] [36m] Finance & Debt index (SD) [24m] [36m] Material needs index (5-17)[24m] [36m] Schooling index (11-17) [24m] [36m] Anthropometric index (11-17) [24m] [36m] -.2 0 .2 .4 .6 .8 Effect size in SDs of the control group Endlines 1&2 (24&36-months) at a glance Intent-to-Treat effects (CGP) - indices
- 25. And even generated a significant income multiplier among households: every Kwacha transferred generated an additional 0.49 Kwacha CGP Annual value of transfer (A) 660 Savings 61 Loan repayment 27 Consumption 800 Livestock value 48 Productive tools value 50 Total spending (consumption + spending) (B) 986 Estimated multiplier (B/A) 1.49 Impacts are based on econometric results and averaged across all follow-up surveys. Estimates for productive tools and livestock derived by multiplying average increase (numbers) by market price. Only statistically significant impacts are considered.
- 26. Discussion and programmatic implications 1 • CGP generated large impacts on virtually all aspects of household well-being, EXCEPT for child nutrition • CGP did improve the food pathway, which is directly affected by cash: meal frequency, diet diversity, IYCF • Other pathways are dependent on infrastructure (water and sanitation, electricity) and supply-side factors (health services) rather than cash, CGP could not be expected to affect these
- 27. Discussion and programmatic implications 2 • Key issue: Are nutritional inputs ‘complementary’? Our results suggest that they are • Improving food access alone, without improving hygienic practices like handwashing or the disease environment (potable water, latrines) cannot reduce chronic malnutrition • Implication is that programs must work together to improve all three pathways at the same time • Social Cash Transfer is addressing the food pathway; targeting SUN interventions to these households may have a better chance of reducing stunting due to input complementarity – is this possible?
Hinweis der Redaktion
- Long pilot phase from 2003 (Kalomo, Chipata), then MCP and CGP in 2010-2014, and finally merging of programs and scale-up in 2015
- Comparison is from LCMS data, rural
- Compared to LCMS rural
- Children born into the study were fully treated—families received cash transfer for their whole lives
- WE will use regression models, so that we can control for other factors like age of child, characteristics of mother, etc
- Cash transfer directly can influence first pillar, and maybe second and third pillars, but necessarily. If these inputs are COMPLEMENTARY, then simply increasing one alone will not boost child nutritional status. Supply side factors will
- WE will use regression models, so that we can control for other factors like age of child, characteristics of mother, etc
- WE will use regression models, so that we can control for other factors like age of child, characteristics of mother, etc
- Meal frequency and diet diversity improved significantly