The Estonian Economy, No. 2 - July 27, 2012
•
0 gefällt mir•369 views

The Estonian Economy, No. 2 - July 27, 2012: Unemployment, albeit falling, poses challenges

Empfohlen
Empfohlen
Weitere ähnliche Inhalte
Was ist angesagt?
Was ist angesagt? (10)
Andere mochten auch
Andere mochten auch (7)
Ähnlich wie The Estonian Economy, No. 2 - July 27, 2012
Ähnlich wie The Estonian Economy, No. 2 - July 27, 2012 (20)
Mehr von Swedbank
Mehr von Swedbank (20)
Kürzlich hochgeladen
Kürzlich hochgeladen (20)
The Estonian Economy, No. 2 - July 27, 2012
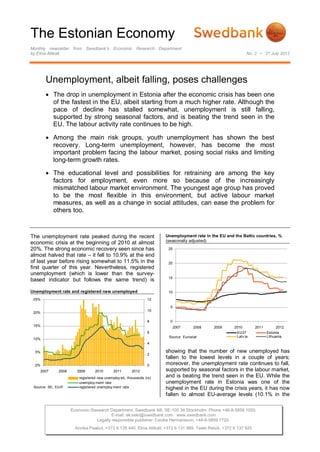
- 1. The Estonian Economy Monthly newsletter from Swedbank’s Economic Research Department by Elina Allikalt No. 2 • 27 July 2012 Unemployment, albeit falling, poses challenges The drop in unemployment in Estonia after the economic crisis has been one of the fastest in the EU, albeit starting from a much higher rate. Although the pace of decline has stalled somewhat, unemployment is still falling, supported by strong seasonal factors, and is beating the trend seen in the EU. The labour activity rate continues to be high. Among the main risk groups, youth unemployment has shown the best recovery. Long-term unemployment, however, has become the most important problem facing the labour market, posing social risks and limiting long-term growth rates. The educational level and possibilities for retraining are among the key factors for employment, even more so because of the increasingly mismatched labour market environment. The youngest age group has proved to be the most flexible in this environment, but active labour market measures, as well as a change in social attitudes, can ease the problem for others too. The unemployment rate peaked during the recent Unemployment rate in the EU and the Baltic countries, % (seasonally adjusted) economic crisis at the beginning of 2010 at almost 20%. The strong economic recovery seen since has 25 almost halved that rate – it fell to 10.9% at the end of last year before rising somewhat to 11.5% in the 20 first quarter of this year. Nevertheless, registered unemployment (which is lower than the survey- 15 based indicator but follows the same trend) is Unemployment rate and registered new unemployed 10 25% 12 5 10 20% 8 0 15% 2007 2008 2009 2010 2011 2012 6 EU27 Estonia Source: Eurostat Latv ia Lithuania 10% 4 5% showing that the number of new unemployed has 2 fallen to the lowest levels in a couple of years; 0% 0 moreover, the unemployment rate continues to fall, 2007 2008 2009 2010 2011 2012 supported by seasonal factors in the labour market, registered new unemploy ed, thousands (rs) and is beating the trend seen in the EU. While the unemploy ment rate unemployment rate in Estonia was one of the Source: SE, EUIF registered unemploy ment rate highest in the EU during the crisis years, it has now fallen to almost EU-average levels (10.1% in the Economic Research Department. Swedbank AB. SE-105 34 Stockholm. Phone +46-8-5859 1000. E-mail: ek.sekr@swedbank.com www.swedbank.com Legally responsible publisher: Cecilia Hermansson, +46-8-5859 7720. Annika Paabut, +372 6 135 440. Elina Allikalt, +372 6 131 989. Teele Reivik, +372 6 137 925
- 2. The Estonian Economy Monthly newsletter from Swedbank’s Economic Research Department, continued Nr 2 • 27 July 2012 first quarter). Nevertheless, despite positive in the construction and transport sectors) has developments, there are still risks in the labour helped to ease the youth unemployment problem. market regarding future developments, including The young labour force has proved to be the most the impact from continuous euro area recession. flexible age group after the crisis – in addition to the strongest employment growth, the share of long- The crisis and the subsequent recovery in the term unemployment for this group is the smallest Estonian labour market have been characterised by (about 40% of the total) of all other age groups. growing activity rates1; these are also the main After unsuccessful job searches, many young reason why unemployment has not fallen more people have chosen to continue their previously rapidly amidst strong employment growth. The unfinished studies, supported by a special state- activity rate has picked up the most among the initiated programme. Nevertheless, youth youngest and the eldest labour market participants, unemployment is still much higher than in other age while that of the biggest age group (25-49 year groups; thus it is important not to lose the olds) has largely remained unchanged. momentum of recent positive developments, Activity rate in the main age groups, % especially considering the important position of this group in an aging and declining population. 90 Unemployment in the main risk groups 80 (thousands) 70 70 60 60 50 50 40 40 30 20 30 2004 2005 2006 2007 2008 2009 2010 2011 10 Source: SE 15-24 25-49 50-69 Total 0 2007 2008 2009 2010 2011 2012 Conflicting developments in the main risk 15-24 y o non-Estonians Source: SE 50-69 y o long-term unemploy ed groups Unemployment in the main labour market risk 2 Unemployment rate by age groups groups – the youngest (15-24-year-olds), the eldest (50-64-year-olds), long-term unemployed, 45% and non-Estonians – has been declining amidst 40% overall labour market improvements. The strength 35% of the recovery, however, has varied across groups. 30% The best improvement has been witnessed 25% amongst young people, where the unemployment rate has almost halved from its peak of 40% at the 20% beginning of 2010 to 23%, now close to the EU 15% average. A big part of this development can be linked to the fall in activity of the construction sector 10% (which employed many young men) during the 5% crisis and its steady recovery during recent years. 0% In addition, an increase in pendulum migration (e.g., 2007 2008 2009 2010 2011 2012 Source: SE 15-24 25-49 50-69 Developments in the unemployment of elderly 1 The share of working-age population that is either employed people have been similarly positive – their or actively looking for a job. unemployment rate is down from 17% in 2010 to 2 According to the Labour Market Services and Benefits Act. below 10% at the beginning of this year. This has 2 (5)
- 3. The Estonian Economy Monthly newsletter from Swedbank’s Economic Research Department, continued Nr 2 • 27 July 2012 been supported by strongly rising employment as of long-term unemployed peaked at the beginning well as activity. The increase in activity is affected, of 2010 and has now declined by only about 20%. on the one hand, by the rising pension age of Even more, the share of long-term unemployed in women and, on the other hand, by the growing total unemployment has held steady above 50% number of budget-constrained people. since the beginning of 2011, even increasing to 59% in the first quarter of 2012 (one of the highest The unemployment rate of non-Estonians, who are in the EU); these are levels that were seen only considered to have a disadvantaged position in the briefly more than 10 years ago, when the economy labour market due to their presumably weaker was experiencing large structural changes following language skills, has always been higher than that of the Russian financial crisis. The increasing problem Estonians. During the crisis, the non-Estonians of long-term unemployment – together with its suffered more due to their higher employment in the effects on the individual, the society, and long-term manufacturing, retail, and construction sectors, as economic growth, as well as the growing risk of its well as in craft and related trade occupational long-term costs – has been discussed more segments. The unemployment rate shot up to 28% publicly recently; however, measures to forestall at the beginning of 2010 but has now fallen to and alleviate it are still scarce. around 17%. Although the rise in unemployment during the crisis hit evenly across regions, the Unemployment by duration heavily industrial northeast region of Estonia (where (thousands) the non-Estonian workforce is the largest), which 140 has always had a higher-than-average unemployment rate, was affected exceptionally 120 harder.3 Research has shown, however, that the non-Estonians have the lowest mobility in entering 100 the labour market3, and that, even with good 80 language skills, the non-Estonians can suffer from discrimination in their job searches compared with 60 native Estonians4. 40 Unemployment rate in northeast Estonia 20 30% 0 25% 2007 2008 2009 2010 2011 2012 up to 12 months more than 12 months 20% Source: SE 15% Discouraged persons 40% 18 10% 35% 16 5% 14 30% 12 0% 25% 2005 2006 2007 2008 2009 2010 2011 2012 10 20% 8 North-east region The rest of Estonia Source: SE 15% 6 10% The most dissapointing developments have been in 4 the area of long-term unemployment. The number 5% 2 0% 0 2005 2006 2007 2008 2009 2010 2011 2012 total, thousands (rs) Source: SE as a % of unemploy ed persons 3 Working Papers of Eesti Pank No 1/2011. „Labour market mobility during a recession: the case of Estonia“ 4 Master’s thesis by Evelyn Uudmäe (University of Tartu, 2012) „The role of typical Estonian and Russian sounding names in the hiring process based on the examples from Tallinn.“ 3 (5)
- 4. The Estonian Economy Monthly newsletter from Swedbank’s Economic Research Department, continued Nr 2 • 27 July 2012 On the positive side, active labour market measures flexible as its willingness and ability to learn and 5 and changes in laws have increased the incentives change career profiles is on average better than to remain active even after a long period of others. This difference in age profiles is best visible unemployment. Nonactivity due to discouragement in long-term unemployment – its share in the oldest has not increased significantly, especially compared age group is almost 70%, while amongst the with the increase in long-term unemployment. The youngest it is around 40%. Even more, as is visible number of discouraged people is more than twice in the chart, amongst the eldest age group, as small as it was a decade ago. unemployment increases the most for those with the highest-level education, even more than for Education, training, and labour market peers with a lower-level educational profile; this measures – the key factors indicates greater inflexibility in retraining for this On average, the lower the educational level, the group. higher the possibility of becoming unemployed and, in turn, of remaining unemployed. Inefficient skills Ratio of particiaptions in active measures (% of registered unemployed) and a low educational level are considered to be the main reasons for unsuccessful (re)entrance to 70% employment. While people with the lowest 60% Other educational level have the highest unemployment rates in every age group (see chart below), they 50% account for only about 20% of total unemployment. Wage The largest share of unemployed (about half of the 40% subsidy total) has a upper-secondary education. This Job search educational level covers most of the special-skill 30% training workers, who are the most likely in need of 20% retraining due to structural changes in the economy. Work Although people with the highest educational level related 10% training have the lowest unemployment rate (except the Career eldest), they make up only about 30% of total 0% counselling unemployment. 2008 2009 2010 2011 Unemployment rate by age group and educational level in Source: EUIF 2011 35% Although public expenditure on active labour market 6 measures is quite low in Estonia, there was a 30% considerable increase in the usage of labour market 25% training programmes7 last year. Amongst these, work-related training was the most used active 20% measure (see chart); this helps to raise 15% qualifications of unemployed with a low education level and nonefficient language skills, i.e., factors 10% that are amongst the main unemployment risks. 5% Job-search training, which helps the unemployed to become more competitive in their job hunts, has 0% increased in popularity. Wage subsidies, which Av erage 15-24 25-34 35-44 45-54 55-64 encourage employers to hire long-term total below upper secondary education unemployed, have been well received by market upper secondary education Source: SE tertiary education participants as well – in 2011, almost 5,000 unemployed were hired through this measure. Although the unemployment rate is the highest in all educational levels among the youngest age group, this group has proved to be more mobile and 6 0.2% of GDP in 2010, being one of the lowest among OECD member states; OECD average was 0.7% of GDP. OECD Employment Outlook 2012 5 7 For example, registering as an unemployed and actively These measures are offered by the Estonian Unemployment searching for job guarantee access to basic state health care Insurance Fund (EUIF) and are partially cofinanced by the EU services. structural funds. 4 (5)
- 5. The Estonian Economy Monthly newsletter from Swedbank’s Economic Research Department, continued Nr 2 • 27 July 2012 Several social tax changes were introduced two the crisis to almost 10% now), it is still twice as years ago that aimed to encourage employers to small as the EU average. Part-time employment hire, in addition to long-term unemployed, part-time can be very useful in encouraging unemployed of workers. While part-time employment has increased several risk groups to enter employment or remain in popularity (from 6-7% of total employment before employed. Swedbank Economic Research Department Swedbank’s monthly newsletter The Estonian Economy is published as a service to our SE-105 34 Stockholm customers. We believe that we have used reliable sources and methods in the preparation Phone +46-8-5859 1028 of the analyses reported in this publication. However, we cannot guarantee the accuracy or ek.sekr@swedbank.com completeness of the report and cannot be held responsible for any error or omission in the www.swedbank.com underlying material or its use. Readers are encouraged to base any (investment) decisions on other material as well. Neither Swedbank nor its employees may be held responsible for Legally responsible publisher losses or damages, direct or indirect, owing to any errors or omissions in Swedbank’s Cecilia Hermansson, +46-8-5859 7720 monthly newsletter The Estonian Economy. Annika Paabut +372 6 135 440 Elina Allikalt +372 6 131 989 Teele Reivik +372 6 137 925 5 (5)