1. Swedbank – Interim report January-March 2014 Page 1 of 56
First quarter 2014
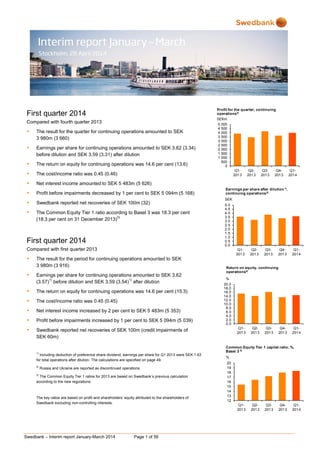
Compared with fourth quarter 2013
The result for the quarter for continuing operations amounted to SEK
3 980m (3 660)
Earnings per share for continuing operations amounted to SEK 3.62 (3.34)
before dilution and SEK 3.59 (3.31) after dilution
The return on equity for continuing operations was 14.6 per cent (13.6)
The cost/income ratio was 0.45 (0.46)
Net interest income amounted to SEK 5 483m (5 626)
Profit before impairments decreased by 1 per cent to SEK 5 094m (5 168)
Swedbank reported net recoveries of SEK 100m (32)
The Common Equity Tier 1 ratio according to Basel 3 was 18.3 per cent
(18.3 per cent on 31 December 2013)
3)
First quarter 2014
Compared with first quarter 2013
The result for the period for continuing operations amounted to SEK
3 980m (3 916)
Earnings per share for continuing operations amounted to SEK 3.62
(3.57)
1)
before dilution and SEK 3.59 (3.54)
1)
after dilution
The return on equity for continuing operations was 14.6 per cent (15.3)
The cost/income ratio was 0.45 (0.45)
Net interest income increased by 2 per cent to SEK 5 483m (5 353)
Profit before impairments increased by 1 per cent to SEK 5 094m (5 039)
Swedbank reported net recoveries of SEK 100m (credit impairments of
SEK 60m)
1)
Including deduction of preference share dividend, earnings per share for Q1 2013 were SEK 1.63
for total operations after dilution. The calculations are specified on page 49.
2)
Russia and Ukraine are reported as discontinued operations.
3)
The Common Equity Tier 1 ratios for 2013 are based on Swedbank’s previous calculation
according to the new regulations.
The key ratios are based on profit and shareholders’ equity attributed to the shareholders of
Swedbank excluding non-controlling interests.
0
500
1 000
1 500
2 000
2 500
3 000
3 500
4 000
4 500
5 000
Q1-
2013
Q2-
2013
Q3-
2013
Q4-
2013
Q1-
2014
SEKm
Profit for the quarter, continuing
operations2)
0.0
0.5
1.0
1.5
2.0
2.5
3.0
3.5
4.0
4.5
5.0
Q1-
2013
Q2-
2013
Q3-
2013
Q4-
2013
Q1-
2014
SEK
Earnings per share after dilution1)
,
continuing operations2)
0.0
2.0
4.0
6.0
8.0
10.0
12.0
14.0
16.0
18.0
20.0
Q1-
2013
Q2-
2013
Q3-
2013
Q4-
2013
Q1-
2014
%
Return on equity, continuing
operations2)
12
13
14
15
16
17
18
19
20
Q1-
2013
Q2-
2013
Q3-
2013
Q4-
2013
Q1-
2014
%
Common Equity Tier 1 capital ratio, %,
Basel 3 3)
2. Swedbank – Interim report January-March 2014 Page 2 of 56
CEO Comment
The Swedish economy continued to show signs of
strength during the first three months of 2014. Growth
accelerated, mainly driven by higher domestic demand.
At the same time the quarter was overshadowed by the
events in Ukraine, creating uncertainty in the
international economy. Sanctions against Russia have
been limited to date, but if ratcheted up could threaten
global growth, particularly in Europe. Although the Baltic
countries are particularly vulnerable in the event of
sanctions against and by Russia, to date we have not
seen any financial effects of the crisis in our business.
Stable profit
Swedbank’s profit for the first quarter was stable with a
return on equity for continuing operations of 14.6 per
cent. Lower market rates negatively affected net interest
income within Swedish Banking, while loan repricing
and higher Euribor rates contributed positively within
Baltic Banking. Customer activity within LC&I is good,
with interest in IPOs and the favourable stock market
climate benefiting earnings. The intensive efforts to
further improve cost efficiencies and productivity in all
the bank's operations are continuing.
Our Common Equity Tier 1 ratio was unchanged during
the quarter at 18.3 per cent according to Basel 3. We
are still awaiting a decision on how future capital
requirements will be implemented in Sweden so that we
can then establish new capital targets.
Stability and low risk create opportunities
Thanks to the bank's low risk and strong capitalisation,
we were able to obtain financing on very good terms
during the quarter. In February Swedbank issued
EUR 750m in subordinated notes at the lowest price for
this type of bond for any bank in the world since the
Lehman Brothers bankruptcy. Competitive funding is
essential in order to offer quality solutions that provide
value to our customers.
Greater insight leads to improved customer value
Work to improve customer value continues. The results
of last winter's extensive customer survey, where 40
000 of our customers responded to questions on how
they see us and what we offer, gives every branch
insight into which areas they need to improve and
develop. The challenge for us at the retail level is to
better serve customers with more complex needs and
improve service for business customers. Our advisors
play an important role in this regard. At the same time
we know that our customers are satisfied with our digital
services.
Use of the Swish payment solution, which is shared by a
number of banks, has steadily increased to slightly over
one million users. During the first quarter no less than
three hundred thousand customers joined Swish. Our
customers and those of the savings banks reported the
biggest increase, and our customers completed nearly a
million transactions valued at almost a half billion
Swedish kronor during the first quarter. Increasing
digitalisation allows us to reduce the number of manual
routines and simplify our product development and
range of services. This frees up resources that can be
spent on more and improved customer meetings. The
work we have begun to reallocate resources to activities
closer to customers while also improving efficiencies in
internal processes is vital to the bank's future profitability
and competitiveness.
Our Baltic operations have developed positively and are
setting an example for the other business areas.
Customer satisfaction is high, profitability is good and
efficiencies are improving, despite our lending not being
larger than deposits in these markets. Our business
model in the Baltic countries shows that greater
customer value can be created in a cost-effective way
that benefits the customer and the bank.
Stronger market position in southern Sweden
In February we announced our acquisition of
Sparbanken Öresund, which makes us stronger in an
important growth region. The integration is progressing
at full speed and a plan is already in place for the most
important parts of the new structure. The acquisition has
been approved by Sparbanken Öresund’s ownership
foundations and the Swedish Competition Authority. We
are now waiting for a final decision from the Swedish
Financial Supervisory Authority to finalise the actual
integration. Our customers in southern Sweden now
have the benefit of a full-service bank while maintaining
the familiarity of their local bank. During the quarter I
met many employees and customers of Sparbanken
Öresund and was able to see for myself the dynamism,
professionalism and drive that distinguish the entire
region. I look forward to welcoming all of them as
employees and customers of Swedbank.
A sustainable housing market
In March the Swedish Bankers’ Association issued an
amortisation recommendation that everyone who takes
out a new mortgage also receive an individualised
amortisation schedule for the parts of their mortgage
with a loan-to-value ratio of over seventy per cent. This
will help our customers to strengthen their personal
finances over the long term, but will not resolve the
housing shortage in growing regions. More long-term
efforts are needed to achieve a balance in the housing
market, where we will gladly play a role in helping to
finance new construction.
Outlook
During my travels in Sweden and the Baltic countries I
meet many business leaders, individuals and politicians
and have seen a growing sense of optimism at the
same time that uncertainty about the global economy is
impacting their willingness to invest. In the Baltic
countries, the events in Ukraine have created
uncertainty, which will probably further delay an
anticipated increase in credit demand. I will continue to
spend much of my time supporting the organisation in
meeting with customers, but also on increasing cost
awareness and making sure that the energy my
colleagues have is used to create better and simpler
processes. It is critical we ensure that we can offer
competitive products and services to our customers in
the long term. In June we are also taking a big step
when we move our head office to new, modern and
more cost-effective premises, which will facilitate greater
efficiencies and cooperation between departments.
Looking forward to seeing you soon in Sundbyberg!
Michael Wolf
President and CEO
3. Swedbank – Interim report January-March 2014 Page 3 of 56
Table of contents
Page
Financial summary 4
Overview 5
Market 5
Important events during the quarter 5
First quarter 2014 compared with fourth quarter 2013 5
Result 5
First quarter 2014 compared with first quarter 2013 6
Result 6
Credit and asset quality 7
Funding and liquidity 8
Ratings 9
Capital and capital adequacy 9
Market risk 10
Operational risks 10
Other events 10
Events after 31 March 2014 11
Business segments
Swedish Banking 12
Large Corporates & Institutions 14
Baltic Banking 16
Group Functions & Other 18
Eliminations 20
Product areas 21
Financial information
Group
Income statement, condensed 26
Statement of comprehensive income, condensed 27
Key ratios 27
Balance sheet, condensed 28
Statement of changes in equity, condensed 29
Cash flow statement, condensed 30
Notes 30
Parent company 51
Signatures of the Board of Directors and the President 55
Review report 55
Contact information 56
More detailed information can be found in Swedbank’s fact book, www.swedbank.com/ir, under Financial information and
publications.
4. Swedbank – Interim report January-March 2014 Page 4 of 56
Financial summary
Income statement Q1 Q4 Q1
SEKm 2014 2013 % 2013 %
Net interest income 5 483 5 626 -3 5 353 2
Net commissions 2 693 2 699 0 2 388 13
Net gains and losses on financial items at fair value 345 461 -25 557 -38
Other income 799 866 -8 784 2
Total income 9 320 9 652 -3 9 082 3
Staff costs 2 437 2 574 -5 2 358 3
Other expenses 1 789 1 910 -6 1 685 6
Total expenses 4 226 4 484 -6 4 043 5
Profit before impairments 5 094 5 168 -1 5 039 1
Impairment of intangible assets 0 12 0
Impairment of tangible assets 135 311 -57 85 59
Credit impairments -100 -32 60
Operating profit 5 059 4 877 4 4 894 3
Tax expense 1 074 1 212 -11 976 10
Profit for the period from continuing operations 3 985 3 665 9 3 918 2
Profit for the period from discontinued operations, after tax -27 -48 -44 -390 -93
Profit for the period 3 958 3 617 9 3 528 12
Profit for the period attributable to the shareholders of
Swedbank AB 3 953 3 612 9 3 525 12
Q1 Q4 Q1
Key ratios and data per share 2014 2013 2013
Return on equity, continuing operations, % 14.6 13.6 15.3
Return on equity, total operations, % 14.5 13.4 13.8
Earnings per share before dilution,
continuing operations, SEK 1)
3.62 3.34 3.57
Earnings per share after dilution,
continuing operations, SEK 1)
3.59 3.31 3.54
Cost/income ratio 0.45 0.46 0.45
Loan/deposit ratio, % 195 203 189
Common Equity Tier 1 capital ratio, %, Basel 3 2)
18.3 18.3 16.4
Tier 1 capital ratio, %, Basel 3 2)
19.4 19.6 17.8
Total capital ratio, %, Basel 3 2)
22.0 20.7 19.4
Credit impairment ratio, % -0.03 -0.01 0.02
Share of impaired loans, gross, % 0.45 0.55 0.77
Total provision ratio for impaired loans, % 60 54 57
Balance sheet data 31 Mar 31 Dec 31 Mar
SEKbn 2014 2013 % 2013 %
Loans to the public 1 279 1 265 1 1 237 3
Deposits and borrowings from the public 655 621 5 650 1
Shareholders' equity 102 110 -7 96 7
Total assets 1 922 1 824 5 1 920 0
Risk exposure amount, Basel 3 2)
449 441 2 465 -3
1)
Including deduction of the preference share dividend, earnings per share for Q1 2013 were SEK 1.63 for total operations after dilution. The calculations are
specified on page 49.
2)
The capital ratios for 2013 are based on Swedbank’s previous calculation according to the new regulations.
The key ratios are based on profit and shareholders’ equity attributable to shareholders of Swedbank.
5. Swedbank – Interim report January-March 2014 Page 5 of 56
Overview
Market
The global economy is growing with North America and
Europe remaining a linchpin in the recovery, while the
expansion in emerging markets has slowed. In EMU
countries, the slow recovery continues, but low inflation
and resource utilisation have at the same time
increased the risk of deflation. Additional monetary
stimulus from the European Central Bank (ECB)
therefore cannot be ruled out. Russia's annexation of
Crimea and increased military activity around Ukraine
have raised geopolitical tensions. Sanctions against
Russia have been limited to date, but a worsening
conflict could jeopardise growth, particularly in Europe.
Since the beginning of the year long-term bond yields
have fallen in Europe and the US despite the Federal
Reserve’s reduced bond buying. Low global inflation,
geopolitical uncertainty and expectations of continued
low benchmark rates pushed bond yields lower.
Swedish economic growth accelerated during the fourth
quarter of 2013 driven by stronger domestic demand
and increased inventory investment. Exports were kept
in check by weak external demand, but improved in late
2013. On average, GDP rose by 1.5 per cent in 2013.
The National Institute of Economic Research’s
confidence indicators for the first quarter indicate a
continued recovery in the Swedish economy. Despite
stronger growth, inflation was significantly lower than
expected in the first quarter, increasing pressure on the
Riksbank to cut the repo rate further, even though it was
held unchanged at the most recent rate meeting in April.
Growth in the Baltic economies slowed in 2013, mainly
due to sluggish export demand. Private spending
continued to grow, driven by a strong domestic labour
market. Investments in Estonia and Latvia were very
low, while Lithuania reported good growth but from a
low level. Of the three Baltic economies, Latvia had the
strongest GDP growth in 2013 (4.1 per cent), followed
by Lithuania (3.3 per cent) and Estonia (0.8 per cent). In
early 2014 household confidence was positive in
keeping with the lower unemployment. A further
reduction in inflation in recent months has continued to
strengthen household buying power. Lower global
commodity prices and a relatively strong euro have
reduced price pressures. Manufacturing expectations
are unchanged, although the risk of a downturn has
increased due to the conflict between Russia and
Ukraine. A decline in trade with Russia will adversely
affect the Baltic countries in 2014 at the same time that
a recovery in the EU will generate positive growth. The
direct impact from Russia will be on specific companies
and sectors, especially manufacturing and
transportation. If the conflict escalates, the Baltic
countries would see a greater impact on investment and
consumption, negatively affecting the entire economy.
The Stockholm stock exchange (OMXSPI) gained 3.9
per cent during the first quarter. The Tallinn stock
exchange (OMXTGI) fell by 2.6 per cent and the Riga
stock exchange (OMXRGI) by 9.6 per cent, while the
Vilnius stock exchange (OMXVGI) gained 7.1 per cent.
Important events during the quarter
During the first quarter Swedbank acquired Sparbanken
Öresund. Through a simultaneous structural deal, a new
regional bank – Sparbanken Skåne – was formed.
Swedbank’s holding in Sparbanken Skåne will be 22 per
cent. The deal is consistent with Swedbank’s aim to
build a stronger position in its home markets and offer
greater opportunities for long-term value creation for
customers and shareholders. The acquisition has been
approved by Sparbanken Öresund’s ownership
foundations and the Swedish Competition Authority. The
deal is contingent on the approval of the Swedish
Financial Supervisory Authority, which is expected to
announce its decision in the second quarter 2014. Only
then will Sparbanken Öresund be consolidated in
Swedbank’s accounts. The positive impact on 2014
results is estimated at SEK 200m after tax. The deal
increases the risk exposure amount by SEK 16bn, while
the Common Equity Tier 1 capital ratio is negatively
affected by 0.6 percentage points. In connection with
the acquisition, earlier cost guidance for 2014 was
adjusted upwards by SEK 650m. Previous guidance had
estimated costs at the same level as 2013. Lars
Ljungälv has been appointed new head of Swedbank's
Southern Region and will be a member of Swedbank’s
Group Executive Committee
First quarter 2014
Compared with fourth quarter 2013
Result
Profit before impairments decreased by 1 per cent to
SEK 5 094m (5 168). LC&I contributed positively. Baltic
Banking’s result was stable, while Group Treasury
within Group Functions & Other accounted for the
largest decrease. Profit before impairments also
declined slightly within Swedish Banking.
Profit before
impairments
by business segment Q1 Q4 Q1
SEKm 2014 2013 2013
Swedish Banking 2 979 3 010 2 979
Large Corporates &
Institutions 1 265 1 109 1 074
Baltic Banking 858 853 728
Group Functions & Other -8 205 284
Total excl FX effects 5 094 5 177 5 065
FX effects -9 -26
Total 5 094 5 168 5 039
Net recoveries amounted to SEK 100m (32). Swedish
Banking reported lower credit impairments than in the
previous quarter and LC&I posted net recoveries. Baltic
Banking reported continued net recoveries, but slightly
lower than in the previous quarter.
Tangible asset writedowns amounted to SEK 135m
(311) and relate to the writedown of Ektornet’s property
values. The large part of the writedowns is attributable
to Ukraine and the US. No intangible asset writedowns
were reported during the quarter (12).
Quarterly results rose by 9 per cent to SEK 3 953m
(3 612), mainly due to lower expenses, tangible assets
writedowns and tax expenses. The result for continuing
operations was SEK 3 980m (3 660). The result for
discontinued operations was SEK -27m (-48) and mainly
relates to the result from the Russian operations.
The return on equity for continuing operations was 14.6
per cent (13.6). The cost/income ratio was 0.45 (0.46).
6. Swedbank – Interim report January-March 2014 Page 6 of 56
Income decreased by 3 per cent to SEK 9 320m
(9 652), mainly due to lower net interest income, but
also lower net gains and losses on financial items at fair
value and lower other income. Net interest income was
stable.
Net interest income decreased by 3 per cent to SEK
5 483m (5 626). All business segments except Baltic
Banking reported lower net interest income. Nearly half
of the decrease is due to the fewer number of days
during the first quarter compared with the fourth quarter.
Lower market interest rates affected Swedish Banking’s
net interest income negatively. Higher market rates
contributed positively within Baltic Banking. The margin
on corporate lending within LC&I was stable, but with
slight margin pressure on new lending. Mortgage
margins for the Swedish portfolio as a whole were
stable.
Net commissions were stable at SEK 2 693m (2 699).
The trend for LC&I was positive, with one-off income of
SEK 30m strengthening the result. Income was stable
within Swedish Banking but decreased in Baltic Banking
and Group Functions & Other. Higher income from
equity trading, lending and real estate brokerage
contributed positively. Income from cards and payments
decreased on a seasonal basis. Income from Corporate
Finance remained strong, but was lower than in the
previous quarter. The fourth quarter 2013 contained
performance-related asset management income of SEK
38m (0).
Net gains and losses on financial items at fair value
decreased to SEK 345m (461). Trading income from
corporate bonds and equities within LC&I contributed
positively. Group Treasury accounted for the largest part
of the decrease, mainly due to the effects of covered
bond repurchases, which over time have a positive
effect on net interest income. A negative translation
difference of SEK 74m was reported during the quarter
in Ektornet within Group Functions & Other related to
the depreciation of the Ukrainian currency, the hryvnia.
Other income decreased by 8 per cent to SEK 799m
(866). Sales activity within Ektornet remained good, but
the transactions shrunk in size, which had a negative
effect. During the first quarter a property in Russia was
sold, which had a positive effect of SEK 83m within
Group Functions & Other.
Expenses decreased by 6 per cent to SEK 4 226m
(4 484) compared with the previous quarter, when
expenses were seasonally higher for marketing,
consultants and IT. Variable staff costs decreased
compared with the previous quarter. During the first
quarter SEK 79m was expensed for the forthcoming
move of the head office, compared with SEK 16m in the
fourth quarter. Fourth quarter expenses included
redeployment provisions of SEK 100m within Group
Functions & Other. Depreciation/amortisation was
higher during the fourth quarter due to a one-off effect
associated with the leasing operations in Estonia.
Expense analysis
Group Q1 Q4 Q1
SEKm 2014 2013 2013
Swedish Banking 2 443 2 526 2 399
Large Corporates &
Institutions 834 876 722
Baltic Banking 607 666 613
Group Functions & Other
and Eliminations 342 413 325
Total excl FX effects 4 226 4 482 4 059
FX effects 0 2 -16
Total expenses 4 226 4 484 4 043
The number of full-time positions was stable during the
quarter. The number increased slightly within Swedish
Banking and LC&I, while the increase was higher within
Group Functions & Other, partly due to a higher number
of IT related personnel. The number of full-time
positions within Baltic Banking declined by 82.
The tax expense amounted to SEK 1 074m (1 212),
corresponding to an effective tax rate of 21.2 per cent
(24.9). During the first quarter 2014 Swedbank AB
adopted a new policy for profit distributions from the
Baltic operations, whereby around 60 per cent of profit
generated in the Baltic subsidiaries as of 2014 will be
distributed to the parent company. Profit in Estonia is
not taxed until its distribution. The tax rate in Estonia is
21 per cent for profits distributed over time. Deferred tax
is recognised on this distribution. The new profit
distribution policy raised the Group’s effective tax rate
by slightly over one percentage point during the quarter.
Above and beyond the amended distribution policy, the
tax rate in the quarter was effected negatively due to
non-deductible property writedowns in the US and
Ukraine.
The relatively high effective rate in the fourth quarter is
mainly due to a larger taxable one-off distribution of
previous years’ profits from the Estonian insurance
company to Swedbank AB. A new assessment of
deferred tax assets and a non-deductible writedown of
properties within Ektornet also negatively affected taxes.
The effective rate going forward is estimated at 20-22
per cent.
First quarter 2014
Compared with first quarter 2013
Result
Profit before impairments increased by 1 per cent to
SEK 5 094m (5 039). Profit increased within LC&I and
Baltic Banking, while Group Treasury within Group
Functions & Other accounted for the largest decrease.
The result within Swedish Banking was stable. Stronger
net interest income and higher commission income
positively affected profit, while net gains and losses on
financial items at fair value were lower year-on-year.
Expenses increased compared with the previous year.
Net recoveries of SEK 100m were reported during the
first quarter 2014, compared with credit impairments of
SEK 60m for the first quarter 2013. Baltic Banking and
LC&I reported recoveries, while Swedish Banking
reported minor credit impairments. Tangible asset
writedowns amounted to SEK 135m (85), an increase
attributable to Ektornet.
7. Swedbank – Interim report January-March 2014 Page 7 of 56
The result for the period increased by 12 per cent to
SEK 3 953m (3 525). Fluctuations in exchange rates,
primarily the depreciation of the Swedish krona against
the euro and the Lithuanian litas, increased profit by
SEK 27m. The result for continuing operations was SEK
3 980m (3 916) and for discontinued operations was
SEK -27m (-390). A writedown of SEK 340m during the
first quarter 2013 related to the sale of the Ukrainian
operations.
The return on equity for continuing operations was 14.6
per cent (15.3). The cost/income ratio was 0.45 (0.45).
Income increased by 3 per cent to SEK 9 320m (9 082),
mainly driven by LC&I and Baltic Banking. Net
commissions rose the most, while net gains and losses
on financial items at fair value decreased. Changes in
exchange rates increased income by SEK 42m.
Net interest income rose by 2 per cent to SEK 5 483m
(5 353). Increased lending volumes in Swedish Banking
and the repricing of corporate lending in Baltic Banking
contributed positively, as did higher Euribor rates. Lower
deposit margins in Sweden due to falling Stibor rates
negatively affected net interest income. The fee for
government guaranteed funding was SEK 30m lower
than in the first quarter 2013. Fluctuations in exchange
rates increased net interest income by SEK 22m.
Net commissions rose by 13 per cent to SEK 2 693m
(2 388). Higher commission income from asset
management due to increased assets under
management was the biggest contributor. Loan-related
income and income from corporate finance within LC&I
increased as well. The outsourcing of ATMs by Swedish
Banking reduced net commissions by SEK 34m. For
more information, see pages 12.
Net gains and losses on financial items at fair value
decreased by 38 per cent to SEK 345m (557). This is
mainly due to covered bond repurchases, which have a
positive effect on net interest income over time,
however. During the first quarter 2014 a negative
translation difference of SEK 74m was reported in
Ektornet within Group Functions & Other, related to the
depreciation of the Ukrainian hryvnia. Net gains and
losses on financial items at fair value within LC&I was
stable.
Other income increased by 2 per cent to SEK 799m
(784). A property sale in Russia positively affected
income by SEK 83m. Sales activity within Ektornet
remained good, but the transactions shrunk in size,
which negatively affected other income.
Expenses increased by 5 per cent to SEK 4 226m
(4 043). Expenses increased the most within LC&I. Staff
costs within the Group rose as a result of an increased
number of advisors and IT-related staff as well as salary
adjustments. IT development expenses also rose.
Reduced cash handling and the outsourcing of ATMs
led to lower expenses for transport and security. During
the first quarter SEK 79m was expensed within Group
Functions & Other for the forthcoming move of the head
office, at the same time that expenses for Ektornet
continued to decrease. Changes in exchange rates
raised expenses by SEK 16m.
The number of full-time positions decreased year-on-
year by 143, of which 482 were in Baltic Banking and
110 in Ektornet (Group Functions & Other). Within
Swedish Banking and LC&I, the number of full-time
positions increased by 143 and 51 respectively. The
remaining increase was mainly due to IT related
personnel within Group Functions & Other.
The tax expense amounted to SEK 1 074m (976),
corresponding to an effective tax rate of 21.2 per cent
(19.9). The difference in the effective tax rate is mainly
due to Swedbank AB’s new policy on profit distributions
from the Baltic operations, which was adopted during
the first quarter 2014, whereby around 60 per cent of
profit generated in the Baltic subsidiaries as of 2014 will
be distributed to the parent company. Profit in Estonia is
not taxed until its distribution. The tax rate in Estonia is
21 per cent for profits that are distributed. Deferred tax
is recognised on this distribution. The new profit
distribution policy raised the Group’s effective tax rate
by just over one percentage point during the quarter.
The effective rate going forward is estimated at 20-22
per cent.
Credit and asset quality
The quality of the Group’s credit portfolio remains high.
Lending in selected segments increased slightly during
the quarter, impaired loans decreased and the risk
profile improved. Political tensions in Russia and
Ukraine did not affect the credit portfolio. The Group’s
direct credit exposure to Russia and Ukraine was low as
of 31 March, at about SEK 1.5bn. This includes loan
receivables of SEK 1.0bn, exposures within Trade
Finance of SEK 0.4bn (the majority of which expire
within one year) and bank exposures of SEK 0.1bn. In
addition, repossessed properties in Ukraine amount to
SEK 124m and other properties are booked at SEK 8m.
Swedbank’s lending increased by SEK 4.1bn or 0.3 per
cent during the first quarter, of which SEK 1.5bn is due
to currency effects. In Sweden, mortgage lending
increased by SEK 5.1bn. Corporate lending within
Swedish Banking increased by a total of SEK 4.8bn. In
LC&I, activity was low and the credit portfolio decreased
by SEK 2.5bn. In Baltic Banking, the lending portfolio
decreased slightly in Estonia and Latvia, calculated in
local currency, while increasing slightly in Lithuania.
The average loan-to-value ratio for Swedbank’s
mortgages in Sweden, based on property level, was
61.8 per cent as of 31 March (62.2 as of 31 December).
The average loan-to-value ratio for new mortgages in
Sweden was 71.0 per cent (69.9) during the quarter.
The average loan-to-value ratio in Baltic Banking was
85.1 per cent (84.9), while the ratio for new lending was
67.7 per cent during the quarter. With respect to new
lending in Sweden during the last 12 months, 92 per
cent of households with a loan-to-value ratio over 75 per
cent are amortising their loans. Of those who do not
have an amortisation schedule, most have agreed to
begin amortising within two years of signing their loan.
For the Swedish portfolio as a whole, 73 per cent (74) of
households with a loan-to-value ratio over 75 per cent
are amortising, corresponding to 15.7 per cent (16.3) of
the portfolio. For the mortgage portfolio as a whole, 59
per cent (60) of households are amortising. In March,
the Swedish Bankers’ Association issued a
recommendation on amortisation of new mortgages with
a loan-to-value ratio over 70 per cent. Of new
mortgages granted in Sweden in the last 12 months, 55
per cent have a loan-to-value ratio over 70 per cent.
Impaired loans fell by SEK 1.3bn during the quarter to
SEK 6.2bn and correspond to 0.45 per cent (0.55) of
8. Swedbank – Interim report January-March 2014 Page 8 of 56
total lending. The average provision ratio for impaired
loans was 40 per cent. This is in addition to portfolio
provisions for unidentified impaired loans as an added
safety margin, producing a total provision ratio of 60 per
cent (54). A few large commitments within LC&I
accounted for SEK 0.7bn of the decrease in impaired
loans. In Baltic Banking, impaired loans fell by SEK
0.3bn to SEK 4.7bn, mainly due to the winding down of
problem loans from the crisis years of 2008 - 2009 and
improved quality in the loan portfolio. In Swedish
Banking, impaired loans were unchanged during the
quarter.
The share of Swedish mortgages past due by more than
60 days remained low at 0.09 per cent of the portfolio
(0.09). The share of impaired mortgages in Baltic
Banking fell, mainly in Lithuania. The share of
mortgages past due by more than 60 days was 0.7 per
cent in Estonia (0.7), 7.3 per cent in Latvia (7.4) and 4.2
per cent in Lithuania (4.4).
Impaired loans,
by business segment Q1 Q1 Q1
SEKm 2014 2013 2013
Swedish Banking 1 389 1 547 1 828
Large Corporates &
Institutions 159 906 613
Baltic Banking 4 700 5 046 7 817
Estonia 1 322 1 338 1 955
Latvia 1 929 2 145 3 856
Lithuania 1 449 1 563 2 006
Total 6 248 7 499 10 258
Net recoveries during the quarter amounted to SEK
100m (credit impairments of SEK 60m). The recoveries
are mainly due to private mortgages within Baltic
Banking, a few large commitments within LC&I, and
because several commitments are no longer classified
as impaired as a result of the continued positive macro
development. Credit impairments within Swedish
Banking continued to be low.
Credit impairments, net
by business segment Q1 Q4 Q1
SEKm 2014 2013 2013
Swedish Banking 31 140 55
Large Corporates &
Institutions -30 5 74
Baltic Banking -101 -177 -70
Estonia -9 -139 -54
Latvia -65 50 4
Lithuania -27 -88 -20
Group Functions & Other 0 0 1
Total -100 -32 60
Repossessed assets amounted to SEK 1 730m on 31
March, of which Ektornet accounted for SEK 1 552m, of
which SEK 18m relates to shares. The value of
repossessed assets in the Group decreased during the
quarter by SEK 385m, of which SEK 304m in Ektornet.
Ektornet sold properties for SEK 175m. Property values
in the portfolio were written down by SEK 138m, mainly
related to Ukraine and the US. Sales during the quarter
primarily involved a number of small transactions. The
remaining repossessed properties in Ukraine amounted
to SEK 124m on 31 March. On the same date the
number of properties, including apartments, was 1 219
(31 December 1 366), of which 683 were in Latvia (783).
For more information on repossessed assets, see page
35 of the fact book.
Funding and liquidity
In the first quarter 2014 Swedbank issued a total of SEK
37bn in long-term debt instruments, of which SEK 20bn
related to covered bonds and SEK 15bn to senior
unsecured debt. Of the covered bonds, SEK 17bn was
issued in SEK. Demand for private placements
remained high. For the full-year 2014 the bank plans to
issue a total of approximately SEK 120bn to meet
maturing long-term funding with a nominal value of SEK
103bn, calculated from the beginning of the year.
Liquidity over and above the refinancing needs is used
in day-to-day management to repurchase covered
bonds.
In the first quarter 2014 Swedbank also issued EUR
750m of 10-year subordinated notes (Tier 2) with a
prepayment option after 5 years. The debt instruments
fulfil the requirements of CRDIV.
The average maturity of all capital market funding
arranged through the bank’s short- and long-term
programmes was 29 months on 31 March 2014 (29 as
of 31 December). The average maturity of long-term
funding issued during the first quarter was 70 months.
The bank’s short-term funding is mainly used as a cash
management tool, not to finance the bank’s lending to
the public. Outstanding volume increased by SEK 53bn
during the quarter to SEK 153bn.
Swedbank’s liquidity reserve, which is reported in
accordance with the Swedish Bankers’ Association’s
definition and is managed by Group Treasury,
amounted to SEK 243bn on 31 March 2014 (184 as of
31 December). In addition to the liquidity reserve, liquid
securities in other parts of the Group amounted to SEK
59bn (53 as of 31 December). The liquidity reserve and
Liquidity Coverage Ratio (LCR) fluctuate over time
depending, among other things, on the maturity
structure of the bank’s issued securities. According to
current Swedish regulations in effect as of 1 January
2013, the Group’s LCR was 144 per cent on 31 March
(142 as of 31 December). Distributed by USD and EUR,
LCR was 312 per cent (618 as of 31 December) and
586 per cent (662 as of 31 December) respectively. In
early 2013 the Basel Committee published a new
recommendation on the definition of LCR. According to
Swedbank’s interpretation, LCR would have been 163
per cent as of 31 March (168 as of 31 December).
According to Swedbank’s interpretation of the Basel
Committee’s original definition from 2010, the Group’s
Net Stable Funding Ratio (NSFR) was 89 per cent on 31
March (89 as of 31 December). According to
Swedbank’s interpretation of the Basel Committee’s
latest proposed changes to the definition from January
2014, NSFR would be 102 per cent. The main liquidity
measure used by the Board of Directors and executive
management is the so-called survival horizon, which
shows how long the bank could manage long periods of
stress in capital markets, where access to new financing
was limited. At present the bank would survive more
than 12 months with the capital markets completely shut
down. This applies to the Group’s total liquidity as well
as liquidity in USD and EUR.
For more information on the above, see pages 65-66 in
the fact book.
9. Swedbank – Interim report January-March 2014 Page 9 of 56
Ratings
During the first quarter 2014 there were no ratings
changes for Swedbank.
Capital and capital adequacy
The Common Equity Tier 1 ratio according to Basel 3
was unchanged during the quarter at 18.3 per cent on
31 March (18.3 per cent as of 31 December). The new
EU regulation based on Basel 3, which governs the
calculation, took effect on 1 January 2014, while the
introduction of new capital buffers requires
implementation in Swedish law and is likely to take
effect on 1 August 2014. Now that the new regulation
has entered into force, Swedbank no longer reports
capital adequacy according to Basel 2.
Common Equity Tier 1 capital (Basel 3) increased by
SEK 1.3bn during the first quarter to SEK 82.1bn. The
quarterly change in Common Equity Tier 1 capital
according to Basel 3 was mainly due to the bank’s profit,
after deducting the anticipated dividend. The revisions in
the recognition of pensions (accounting standard IAS
19), which took effect in 2013, create volatility in the
estimated pension liability, which also affects equity
through other comprehensive income. Common Equity
Tier 1 capital decreased by approximately SEK 0.2bn
during the first quarter due to falling discount rates. The
transition from Basel 2 to Basel 3 reduced Common
Equity Tier 1 capital by SEK 3.5bn, in line with the
calculation according to Basel 3 reported in Swedbank’s
interim report as of 31 December 2013.
Change in Common Equity Tier 1 capital Basel 3, first
quarter 2014, Swedbank consolidated situation
80.8
82.1
-0.2
0.7
3.7
- 3.0
40
45
50
55
60
65
70
75
80
85
90
Q4 2013 Profit
(consolidated
situation)
Anticipated
dividend
IAS 19 Other CET1
changes
Q1 2014
SEKbn
Increase Decrease
The capital base (Basel 3) increased during the quarter
by SEK 7.9bn. Besides the above-mentioned explana-
tions related to Common Equity Tier 1 capital, the
increase was due to Swedbank’s issuance of
EUR 750m in a Tier 2 instrument in mid-February.
The risk exposure amount (REA), previously referred to
as risk weighted assets (RWA), increased by SEK 8.2bn
during the first quarter, from SEK 440.6bn on 31
December to SEK 448.8bn (both amounts according to
Basel 3) on 31 March. The transition from Basel 2 to
Basel 3 reduced the risk exposure amount by SEK
10.4bn, a net of increases and decreases and in line
with the estimate according to Basel 3 reported in
Swedbank’s interim report as of 31 December 2013.
The risk exposure amount for credit risks (Basel 3)
increased by SEK 2.0bn. Increased exposures, mainly
to corporate customers in Swedish Banking and LC&I,
raised the risk exposure amount by SEK 1.6bn. Positive
rating migrations, mainly among corporate customers in
Baltic Banking, reduced the risk exposure amount by
SEK 1.6bn. Latvia’s euro introduction reduced the risk
exposure amount by SEK 1.4bn after removing the add-
on for loans in a different currency than the pledged
collateral. Other changes in collateral increased the risk
exposure amount by SEK 1.8bn. Fluctuations in
exchange rates, mainly attributable to the Baltic credit
portfolio, raised the risk exposure amount for credit risks
by SEK 0.3bn due to the depreciation of the Swedish
krona against the euro.
The risk exposure amount for credit valuation
adjustment (CVA) which arose in connection with the
introduction of Basel 3 increased by SEK 0.9bn in the
first quarter. The risk exposure amount for market risks
(Basel 3) increased by SEK 1.4bn in the first quarter,
mainly due to increased exposures within LC&I. The risk
exposure amount for operational risks (Basel 3)
increased by SEK 3.9bn, due to Swedbank’s revenue
being higher in 2013 than in 2010. This affects the
capital requirement for operational risks, which is
calculated as a rolling three-year average.
Change in risk exposure amount first quarter Basel 3, first
quarter 2014, Swedbank consolidated situation
1.5 0.3
2.1 0.9
1.4
3.9
- 1.6 - 0.3
440.6
448.8
400
410
420
430
440
450
460
SEKbn
Increase Decrease
In May 2013 the Swedish Financial Supervisory
Authority (SFSA) announced its decision to introduce a
risk weight floor of 15 per cent for the Swedish
mortgage portfolio. The floor is being introduced as a
supervisory measure within Pillar 2 and therefore does
not affect the reported capital ratios. Based on an
average risk weight in Swedbank’s Swedish mortgage
portfolio of 4.2 per cent according to Pillar 1 as of 31
March and the Swedish Common Equity Tier 1 capital
requirement of 12 per cent (as of 2015), Swedbank, as
per SFSA’s decision, must maintain additional Common
Equity Tier 1 capital of SEK 9.7bn for Swedish
mortgages. This corresponds to 2.2 percentage points
of the Common Equity Tier 1 ratio according to Pillar 1.
10. Swedbank – Interim report January-March 2014 Page 10 of 56
In its internal controls, Swedbank already allocates
additional capital to its mortgage business equivalent to
the risk weight floor. In November 2013 SFSA
announced its intention to further increase the risk
weight floor, to 25 per cent. Calculated according to the
same method as above, this increase would mean an
additional SEK 8.9bn in Common Equity Tier 1 capital
for Swedbank. As a whole, a risk weight floor of 25 per
cent would mean that Swedbank would have to maintain
a total of SEK 18.6bn in additional Common Equity Tier
1 capital for its Swedish mortgages, corresponding to
4.2 percentage points of the Common Equity Tier 1 ratio
according to Pillar 1. SFSA is also responsible for
deciding on the countercyclical buffer in connection with
Sweden’s implementation of CRD IV later in 2014. In
announcing the increase in the risk weight floor, SFSA
stated that it may be necessary to prioritise this in
exchange for a lower countercyclical buffer.
SFSA will announce how it views internal capital
assessments according to Pillar 2 in spring 2014. At this
point the interaction between Pillar 1 and Pillar 2 is
unclear, as are the capital requirements for Swedish
banks resulting from SFSA’s future supervisory actions
according to Pillar 2.
Because aspects of Basel 3’s implementation in the EU
require its introduction through national laws, the
Swedish government proposed new rules on oversight,
sanctions and capital buffers in early April. The new
legislation is expected to take effect on 1 August 2014,
at which point SFSA will be authorised to decide on
Sweden’s final capital requirements.
When the new EU regulation took effect on 1 January
2014, SFSA was permitted to grant banks waivers from
the current Basel 1 floor. The Basel 1 floor is a back-
stop for the lowest level of the capital base requirement,
which was introduced in connection with the transition
from Basel 1 to Basel 2. Swedish authorities had
previously announced that this floor would be removed
in connection with the introduction of the new, higher
capital requirements. In March SFSA decided not to
eliminate the floor. As a result, the Basel 1 floor will
remain in effect in Sweden in the same way as before,
i.e. designed as 80 per cent of the capital requirement
calculated according to Basel 1. Swedbank does not
expect this to restrict its capitalisation. The restrictions
will have more impact on the capital requirement
calculated according to Basel 3 (including capital
buffers) and Pillar 2
Since the EU’s new capital adequacy rules took effect
on 1 January 2014, banks are obliged to report their
leverage ratios to supervisory authorities. The measure
will be evaluated by the authorities prior to the possible
introduction of a minimum requirement in 2018.
Swedbank’s leverage ratio was 4.5 per cent as of 31
March (4.6 per cent as of 31 December 2013).
Market risk
The majority of the Group’s market risks are of a
structural or strategic nature and are managed by Group
Treasury. Structural interest rate risks arise when the
maturity of the Group’s assets and liabilities, such as
deposits and lending, do not coincide. The risks are
managed within given mandates by matching the
maturities directly or by using various derivatives such
as interest rate swaps. Net interest income sensitivity is
also affected by structural risks in the bank’s deposit
operations, where various products show different
sensitivity to changes in market interest rates. Strategic
currency risks arise primarily through risks tied to
holdings in foreign subsidiaries and their financing.
Market risks also arise in LC&I’s trading operations in
connection with customer transactions and by
maintaining a secondary market for various types of
securities.
Swedbank measures market risks with a Value-at-Risk
(VaR
1)
) model, among other things.
VaR by risk category
31 Mar 31 Dec
SEKm Max Min Average 2014 2013
Interest risk 87 (97) 66 (64) 77 (80) 77 66
Currency rate risk 16 (12) 3 (2) 9 (5) 6 10
Stock price risk 7 (9) 1 (3) 3 (5) 4 3
Diversification 0 0 -12 (-15) -13 -13
Total 87 (87) 67 (59) 77 (75) 74 66
Jan-Mar 2014 (2013)
1)
The VaR model was complemented during the year by new risk
factors, due to which the figures for 2014 are not directly comparable
with those for 2013.
For individual risk types, VaR is complemented by
various risk measures based on sensitivity to changes in
market prices. Risk taking is also monitored with stress
tests. An increase in all market interest rates of one
percentage point as of 31 March 2014 would have
increased the value of the Group’s assets and liabilities,
including derivatives, by SEK 192m (75 as of 31
December 2013). This calculation includes parts of the
bank’s deposits with a duration of two to three years.
The effect on positions in SEK would have been SEK
405m (250), while the value of positions in foreign
currency would have decreased by SEK 213m (-175).
The Group’s net gains and losses on financial items at
fair value would have been reduced by SEK 816m
(-608), with the biggest contributions coming from the
Group’s liquidity portfolio as well as the trading
operations within LC&I.
Operational risks
IT operations and accessibility in the Internet Bank and
Telephone Bank were stable during the quarter.
Compared with the first quarter 2013, the number of
major IT-related incidents decreased by 11 per cent.
Other events
Swedbank’s Annual General Meeting (AGM) on 20
March re-elected Anders Sundström as Chair of the
Board of Directors. Ulrika Francke, Göran Hedman, Lars
Idermark, Anders Igel, Pia Rudengren, Karl-Henrik
Sundström and Siv Svensson were re-elected as Board
members. Maj-Charlotte Wallin was elected as a new
member of the Board. Deloitte AB was elected as
auditors for the period until the end of the 2018 AGM.
The AGM approved a dividend for financial year 2013 of
SEK 10.10 per share. The dividend payment date was
27 March 2014.
The AGM renewed the Board of Directors’ authorisation
to decide to repurchase the bank’s shares. The total
holding of treasury shares (including shares acquired for
the bank’s trading stock) may not exceed one tenth of
all shares in the bank.
11. Swedbank – Interim report January-March 2014 Page 11 of 56
The AGM granted the Board of Directors’ a mandate to
issue convertibles in the form of subordinated loans that
can be converted to shares. Not more than 100 million
ordinary shares can be issued as a result of
conversions, or the corresponding number due to bonus
or rights issues, conversion of convertibles, share split
or reverse split, or similar corporate events.
Annika Hellström was appointed head of Swedbank’s
Central Region, succeeding Johan Smedman, who was
appointed head of Savings Bank Business at Swedbank
at the year-end. Annika took up her position in March.
Events after 31 March 2014
Christer Trägårdh was appointed as new head of
Swedbank’s eastern region, succeeding Marie Halling
on the Group Executive Committee. Christer takes up
his new appointment in August.
During the second quarter Swedbank in Lithuania will
recognise a one-off income of SEK 35m. This is a result
of a previous provision for a fine Swedbank in Lithuania
was charged in the fourth quarter 2012, when the
competition authority ruled that its cash management
agreement adversely affected competition. The decision
was overturned to Swedbank’s advantage.
12. Swedbank – Interim report January-March 2014 Page 12 of 56
Swedish Banking
Lower market rates put net interest income under pressure
Increased fund volumes positively contributed to net commissions
Improved market position in southern Sweden
Income statement
Q1 Q4 Q1
SEKm 2014 2013 % 2013 %
Net interest income 3 314 3 448 -4 3 331 -1
Net commissions 1 649 1 649 0 1 590 4
Net gains and losses on financial items at fair value 50 31 61 34 47
Share of profit or loss of associates 256 210 22 204 25
Other income 153 198 -23 219 -30
Total income 5 422 5 536 -2 5 378 1
Staff costs 919 888 3 861 7
Variable staff costs 51 67 -24 48 6
Other expenses 1 442 1 528 -6 1 460 -1
Depreciation/amortisation 31 43 -28 30 3
Total expenses 2 443 2 526 -3 2 399 2
Profit before impairments 2 979 3 010 -1 2 979 0
Credit impairments 31 140 -78 55 -44
Operating profit 2 948 2 870 3 2 924 1
Tax expense 640 616 4 631 1
Profit for the period 2 308 2 254 2 2 293 1
Profit for the period attributable to the shareholders of
Swedbank AB 2 304 2 249 2 2 291 1
Non-controlling interests 4 5 -20 2 100
Return on allocated equity, % 28.3 27.7 28.1
Loan/deposit ratio, % 250 244 246
Credit impairment ratio, % 0.01 0.06 0.02
Cost/income ratio 0.45 0.46 0.45
Loans, SEKbn 949 937 1 915 4
Deposits, SEKbn 379 385 -2 371 2
Full-time employees 4 996 4 984 0 4 853 3
Development January - March
The result for the period amounted to SEK 2 304m
(2 291), income and expenses were stable, and credit
impairments were slightly lower than in the first quarter
2013.
Net interest income was stable compared with the same
quarter in 2013. Higher margins on corporate credit and
higher volumes of deposits and lending largely offset
lower deposit margins, which were adversely affected
by declining market interest rates. Compared with the
previous quarter, net interest income decreased mainly
due to lower deposit margins as well as fewer days
during the period. Mortgage margins were stable during
the quarter.
Household deposit volume in the bank decreased by 6
per cent during the quarter in both current accounts and
savings accounts. Swedbank’s share of household
deposits was 21 per cent at the end of the period (21
per cent as of 31 December 2013). Corporate deposits
within Swedish Banking decreased by SEK 2bn, or 2
per cent, during the quarter. Swedbank’s market share
was 19 per cent as of 28 February (18 per cent as of 31
December 2013), including corporate deposits within
LC&I. Fund values rose slightly during the quarter due
to higher stock market prices and net inflows. The
market share, measured as assets under management,
was 23 per cent (24 per cent as of 31 December 2013).
Household mortgage lending volume increased by SEK
5bn during the first quarter, corresponding to 18 per
cent of the market’s net growth (compared with 14 per
cent in the fourth quarter 2013). Swedbank’s share of
the total market was 25 per cent (25 per cent as of 31
December 2013). Corporate lending volume within
Swedish Banking increased by SEK 5bn. Swedbank’s
market share in corporate lending was stable at 17 per
cent (17 per cent as of 31 December 2013), including
corporate lending within LC&I.
Net commissions rose by 4 per cent compared with the
same quarter in 2013. The increase was mainly due to
higher fund volumes in the wake of higher stock market
prices in 2013, but also to net inflows in the last 12-
month period, mainly to mixed funds and collective
occupational pensions. In January 2013 Bankomat AB
gradually began taking over responsibility for
Swedbank’s ATMs, a process it completed at the end of
September. As a result, net commissions and expenses
are both decreasing. During the first quarter net
commissions decreased by SEK 34m year-on-year. Net
commissions were stable compared with the fourth
quarter. Income from payment commissions increased
13. Swedbank – Interim report January-March 2014 Page 13 of 56
together with real estate brokerage commissions, while
other commissions decreased.
Expenses increased by 2 per cent during the first
quarter year-on-year. The biggest increase was in staff
costs, due to a hiring of more advisors and salary
increases. The transfer of responsibility for Swedbank’s
ATMs to Bankomat AB reduced expenses. Reduced
manual cash handling also led to lower transport and
security expenses. Expenses in the first quarter were
lower than in the fourth quarter, when they are
seasonally higher.
Credit quality remained good and credit impairments
decreased compared with the previous year and the
previous quarter. The share of impaired loans was 0.14
per cent (0.16).
The risk exposure amount according to Basel 3 was
SEK 189bn, an increase of SEK 4bn since 31
December 2013. The SEK 2.6bn risk exposure amount
for operational risks accounted for the largest increase.
This is due to Swedbank’s revenues being higher in
2013 than in 2010, which affects the operational risk
capital requirement that is calculated on a rolling three
year basis. The risk exposure amount for credit risks
increased by SEK 1.6bn, mainly due to increased
corporate exposures.
During the first quarter Swedbank acquired Sparbanken
Öresund. The deal is part of Swedbank’s aim to build a
stronger position in its home markets. The acquisition,
which strengthens the bank’s customer offering while at
the same time improving its market position in an
important growth region, has been approved by
Sparbanken Öresund’s ownership foundations and the
Swedish Competition Authority. The deal is contingent
on the approval of the Swedish Financial Supervisory
Authority, which is expected to announce its decision in
the second quarter 2014. Sparbanken Öresund will not
be consolidated in Swedbank’s accounts until then. The
positive results impact in 2014 is estimated at SEK
200m after tax. The risk exposure amount is expected to
initially increase by SEK 16bn thereby adversely
affecting the Common Equity Tier 1 capital ratio by 0.6
percentage points.
Swish was named “Service of the Year” at Sweden’s
telecoms gala in February for contributing more than
any other service to the telecoms market’s development
and for making it easier than ever for people to transfer
money. Swish is a mobile payment service for
customers of a number of banks that facilitates real-time
payments. As of 31 March there were 1 030 000 Swish
users, an increase of 300 000 since the start of the year.
Swedbank’s and the savings banks’ share increased to
40.8 per cent (39.6).
As part of “Young Jobs”, an initiative of Swedbank and
the savings banks, 100 trainee positions were created at
the Telephone Bank during the quarter. The trainees
mainly focus on making it easier for our customers to
begin using the bank’s digital services.
Use of Swedbank’s digital channels continues to grow.
The Internet Bank had 3.6 million users at the end of the
quarter, an increase of 29 000, while the Mobile Bank
had 1.65 million (+96 000) and the iPad Bank had
438 000 (+53 000).
Sweden is Swedbank’s largest market, with around 4 million private customers and more than 250 000 corporate
customers. This makes it Sweden’s largest bank by number of customers. Through our digital channels (Telephone Bank,
Internet Bank and Mobile Bank) and branches, and with the support of cooperating savings banks and franchisees, we
are always available. Swedbank is part of the local community. Our branch managers have the authority to act locally.
The bank’s presence and engagement are expressed in various ways. A project called “Young Jobs”, which has created
several thousand trainee positions for young people, is an important example in recent years. Swedbank has 306
branches in Sweden. The various product areas are described on page 21.
14. Swedbank – Interim report January-March 2014 Page 14 of 56
Large Corporates & Institutions
Stronger customer relations continued to increase deposit volumes
More favourable stock market climate and more IPO activity strengthened net commissions
Good customer activity in bond trading, while fixed income and FX trading was distinguished by low risk taking
Income statement
Q1 Q4 Q1
SEKm 2014 2013 % 2013 %
Net interest income 867 889 -2 783 11
Net commissions 630 558 13 420 50
Net gains and losses on financial items at fair value 565 491 15 579 -2
Other income 37 48 -23 31 19
Total income 2 099 1 986 6 1 813 16
Staff costs 322 303 6 288 12
Variable staff costs 75 118 -36 88 -15
Other expenses 415 443 -6 344 21
Depreciation/amortisation 22 17 29 13 69
Total expenses 834 881 -5 733 14
Profit before impairments 1 265 1 105 14 1 080 17
Credit impairments -30 5 74
Operating profit 1 295 1 100 18 1 006 29
Tax expense 292 360 -19 216 35
Profit for the period 1 003 740 36 790 27
Profit for the period attributable to the shareholders of
Swedbank AB 1 003 740 36 790 27
Return on allocated equity, % 26.9 20.1 16.8
Loan/deposit ratio, % 153 173 185
Credit impairment ratio, % -0.06 0.01 0.13
Cost/income ratio 0.40 0.44 0.40
Loans, SEKbn 152 154 -1 150 1
Deposits, SEKbn 99 89 11 81 22
Full-time employees 1 094 1 069 2 1 043 5
Development January - March
The result amounted to SEK 1 003m for the quarter, an
increase of 27 per cent year-on-year. The result was
positively affected by increased lending related income
and income from Corporate Finance. Bond trading in
Norway and equity trading also contributed to the
improved result compared with the previous year. The
return on allocated equity was 26.9 per cent (16.8).
Net interest income increased by 11 per cent compared
with the same period in 2013. Lending portfolio margins
improved slightly, while higher average lending volumes
and increased origination fees also contributed to the
improvement. Lending volumes rose by 1 per cent, or
SEK 2bn compared with the first quarter 2013.
Compared with the previous quarter net interest income
decreased by 2 per cent to SEK 867m, a result of fewer
days during the quarter as well as lower deposit
margins. Lending volumes decreased somewhat during
the quarter. The lending margin on the entire loan
portfolio was stable, with slight margin pressure on new
loans. Deposit volumes were higher compared with the
fourth quarter and the same period in 2013, a result of
increased business with existing customers and
temporary deposit increases from a few major
customers.
Net commissions rose by 50 per cent compared with the
previous year to SEK 630m. The increase is mainly
related to income from IPOs and lending related
income, where one-off income of slightly over SEK 30m
was received during the first quarter in connection with
loan prepayments. This, along with higher income from
equity trading, increased net commissions by 13 per
cent compared with the fourth quarter 2013. In bond
issues, major deals were finalised in Sweden and
Norway during the first quarter for Real Kredit, SPP and
Stolt Nielsen, among others. Market demand remained
high, causing pressure on bond yields and margins.
Swedbank’s market share for Swedish issues was 17.6
per cent for 2014 (20.6 per cent as of 31 December).
The corresponding figure in Norway was also 17.6 per
cent (18.4 per cent as of 31 December), making
Swedbank the third largest player in both Sweden and
Norway. The stock market climate improved during the
quarter, and within the Swedish operations Swedbank
was an advisor in the IPOs of Hemfosa and Oscar
Properties, where Swedbank’s customers showed great
interest.
Net gains and losses on financial items at fair value
decreased by 2 per cent to SEK 565m compared with
the first quarter 2013. Compared with the previous
quarter net gains and losses on financial items at fair
value rose by 15 per cent. Corporate bond trading was
especially strong in Norway during the quarter and
contributed to increased income. Income from equity
trading also rose during the period. During the first
quarter fixed income and FX trading were distinguished
by relatively low customer activity, however, and
earnings were adversely affected by low interest rates
and a lack of clear trends in the market.
15. Swedbank – Interim report January-March 2014 Page 15 of 56
Total expenses increased by 14 per cent to SEK 834m
compared with the same period in 2013, mainly related
to IT development and staff costs. Variable staff costs
decreased. Compared with the previous quarter total
expenses decreased by 5 per cent, with expenses for IT
development and customer activity seasonally higher at
the end of last year.
Credit quality in the loan portfolio has remained good.
Net recoveries of SEK 30m were reported during the
quarter, compared with credit impairments of SEK 74m
in the first quarter 2013. The share of impaired loans
was 0.06 per cent (0.38). A few large commitments
account for the decrease in impaired loans.
The risk exposure amount according to Basel 3
increased by SEK 5bn during the quarter to SEK 149bn.
The risk exposure amount for credit risk increased by
SEK 3.4bn, mainly due to increased commitments within
the corporate portfolio. The risk exposure amount
related to market risk increased by SEK 0.9bn and
those for credit valuation adjustment (CVA) by SEK
0.9bn.
Large Corporates & Institutions is responsible for Swedbank’s offering to customers with revenues above SEK 2 billion
and those whose needs are considered complex due to multinational operations or a need for sophisticated financing
solutions. The business segment is also responsible for developing corporate and capital market products for other parts
of the bank and the Swedish savings banks. LC&I works closely with customers, who receive advice on decisions that
create jobs and sustainable growth in the long-term. The business segment has around 1 100 employees at branch
offices in Sweden, Norway, Estonia, Latvia, Lithuania, Finland, Luxembourg, China and the US.
16. Swedbank – Interim report January-March 2014 Page 16 of 56
Baltic Banking
Repricing and higher market rates contributed to increased net interest income
Euro adoption in Latvia reduced risks but pressured revenues
Good underlying customer activity
Income statement
Q1 Q4 Q1
SEKm 2014 2013 % 2013 %
Net interest income 874 844 4 742 18
Net commissions 429 454 -6 388 11
Net gains and losses on financial items at fair value 53 84 -37 62 -15
Other income 109 130 -16 90 21
Total income 1 465 1 512 -3 1 282 14
Staff costs 187 204 -8 197 -5
Variable staff costs 20 20 0 18 11
Other expenses 364 384 -5 341 7
Depreciation/amortisation 36 56 -36 33 9
Total expenses 607 664 -9 589 3
Profit before impairments 858 848 1 693 24
Impairment of intangible assets 0 1 0
Impairment of tangible assets -5 16 4
Credit impairments -101 -177 -43 -70 44
Operating profit 964 1 008 -4 759 27
Tax expense 137 182 -25 60
Profit for the period 827 826 0 699 18
Profit for the period attributable to the shareholders of
Swedbank AB 827 826 0 699 18
Return on allocated equity, % 15.2 15.0 12.6
Loan/deposit ratio, % 101 100 109
Credit impairment ratio, % -0.34 -0.59 -0.25
Cost/income ratio 0.41 0.44 0.46
Loans, SEKbn 118 119 -1 113 4
Deposits, SEKbn 117 120 -3 104 13
Full-time employees 3 853 3 935 -2 4 335 -11
Development January - March
The result for the first quarter amounted to SEK 827m,
compared with SEK 699m a year earlier. The increase
was mainly due to higher net interest income and
stronger net commissions, while expenses were largely
unchanged.
Net interest income increased by 13 per cent in local
currency compared with the first quarter 2013. Higher
market rates and repricing affected net interest income
positively. Repricing of corporate loans is expected to
continue in 2014, when the price of new lending will
better reflect the higher costs of capital and regulatory
changes. Fluctuations in exchange rates increased net
interest income by SEK 35m. Net interest income in
local currency rose by 3 per cent compared with the
fourth quarter 2013.
Lending volumes decreased by 1 per cent in local
currency compared with 31 December 2013. The
decrease was mainly due to lower new lending during
the quarter. The lending portfolios decreased slightly in
Estonia and Latvia, while the Lithuanian portfolio was
largely stable. Swedbank’s market share for lending in
the Baltic countries was 28 per cent as of 31 January
(28 per cent as of 31 December 2013).
Deposit volumes in local currency decreased by 2 per
cent from the previous quarter. Deposits decreased in
all three countries after seasonally higher corporate
deposit levels in the fourth quarter. During the fourth
quarter 2013 deposits increased among Latvian retail
customers after more cash than usual was deposited
ahead of the country’s euro transition on 1 January.
Swedbank’s market share in deposits was 29 per cent
as of 31 January (30 per cent as of 31 December 2013).
The loan-to-deposit ratio was 101 per cent (100 per cent
as of 31 December 2013).
Net commission income rose by 6 per cent in local
currency compared with the first quarter 2013. The
increase was mainly due to higher fund management
commissions and increased customer activity. The
number of active customers has increased by 65 000
since 31 March 2013 and is now 2.6 million. Compared
with the fourth quarter 2013, net commissions fell by 6
per cent in local currency, mainly due to seasonal
variations and negative effects of the euro transition in
Latvia. Net commissions decreased by an estimated
SEK 20m during the quarter related to fewer
international payments, since international payments in
euro have been reclassified as local.
Net gains and losses on financial items at fair value
decreased by 18 per cent in local currency compared
with the first quarter 2013 and by 36 per cent compared
with the fourth quarter. The decrease was mainly due to
SEK 20m lower income from the FX business in Latvia
as a result of the euro transition.
17. Swedbank – Interim report January-March 2014 Page 17 of 56
Total expenses decreased by 1 per cent in local
currency year-on-year, mainly due to lower expenses for
personnel, premises and marketing. The number of full-
time employees at the end of the first quarter was 11
per cent lower than a year earlier. At the same time the
number of branches has been reduced by 14 to 178 in
the last year. Euro transition costs amounted to SEK
16m in the first quarter, compared with SEK 2m in the
first quarter 2013, and were mainly related to Latvia.
Additional expenses of SEK 50m are expected to arise
in 2014 in connection with Lithuania’s anticipated euro
transition. Depreciation/amortisation was higher during
the fourth quarter due to a one-off effect associated with
the Estonian leasing business. The cost-income ratio
improved during the first quarter to 0.41 (0.46).
Net recoveries amounted to SEK 101m, against SEK
70m in the first quarter 2013. All three countries
reported recoveries. The largest recoveries were in the
Latvian mortgage portfolio.
Impaired loans continued to decline during the first
quarter to SEK 4.7bn (SEK 5.0bn as of 31 December
2013), mainly in Latvia and Lithuania. Credit quality has
improved to such a level that the decrease in impaired
loans is expected to moderate in 2014 compared with
the last two years.
The risk exposure amount according to Basel 3
decreased by SEK 4bn during the quarter to SEK 81bn.
The risk exposure amount for credit risks accounted for
the decrease. This is primarily due to a positive rating
migration in the corporate portfolio and lower currency
risks related to Latvia’s adoption of the euro, which
removed the add-on for loans in a different currency
than the pledged collateral.
Lithuania is preparing to convert to the euro on 1
January 2015. The decision on euro adoption will be
made in June 2014. The likelihood it will happen is
considered very high – all three Baltic countries will then
be part of the eurozone.
During the first quarter 2014 Swedbank adopted a new
policy on profit distributions from the Baltic operations,
whereby around 60 per cent of earnings generated in
the Baltic subsidiaries as of 2014 will be distributed to
the parent company, Swedbank AB. Profit in Estonia is
not taxed until its distribution. This means that deferred
tax is recognised on the distribution from Estonia now,
even though it will not be paid until the first quarter
2015. For the first quarter 2014 deferred tax of SEK
54m has been recognised on future distributions.
Swedbank is the largest bank by number of customers in Estonia, Latvia and Lithuania, with around 4 million private
customers and more than 250 000 corporate customers. According to surveys, Swedbank is also the most respected
company in the financial sector. Through its digital channels (Telephone Bank, Internet Bank and Mobile Bank) and
branches, the bank is always available. Swedbank is part of the local community. Its local social engagement is
expressed in many ways, with initiatives to promote education, entrepreneurship and social welfare. Swedbank has 50
branches in Estonia, 54 in Latvia and 77 in Lithuania. The various product areas are described on page 21.
18. Swedbank – Interim report January-March 2014 Page 18 of 56
Group Functions & Other
Income statement
Q1 Q4 Q1
SEKm 2014 2013 % 2013 %
Net interest income 424 461 -8 496 -15
Net commissions -31 4 -27 15
Net gains and losses on financial items at fair value -323 -145 -118
Share of profit or loss of associates 0 -1 2
Other income 322 375 -14 300 7
Total income 392 694 -44 653 -40
Staff costs 810 915 -11 787 3
Variable staff costs 53 72 -26 71 -25
Other expenses -553 -603 -8 -587 -6
Depreciation/amortisation 90 105 -14 95 -5
Total expenses 400 489 -18 366 9
Profit before impairments -8 205 287
Impairment of intangible assets 0 11 0
Impairment of tangible assets 140 295 -53 81 73
Credit impairments 0 0 1
Operating profit -148 -101 47 205
Tax expense 5 54 -91 69 -93
Profit for the period from continuing operations -153 -155 -1 136
Profit for the period from discontinued operations, after tax -27 -48 -44 -390 -93
Profit for the period -180 -203 -11 -254 -29
Profit for the period attributable to the shareholders of
Swedbank AB -181 -203 -11 -255 -29
Non-controlling interests 1 0 1 0
Full-time employees 4 327 4 277 1 4 182 3
Development January - March
Income for Group Functions & Other consists of net
interest income and net gains and losses on financial
items, which mainly come from Group Treasury. Other
income primarily consists of revenue from the savings
banks as well as sales revenue and operating income
from Ektornet. Income amounted to SEK 392m (653).
Large repurchases of covered bonds within Group
Treasury negatively affected net gains and losses on
financial items at fair value. This was in addition to
negative FX effects of SEK 74m in Ektornet related to
the depreciation of the Ukrainian hryvnia. Other income
increased by 7 per cent to SEK 322m (300) due to the
sale of a property in Russia, which positively affected
other income by SEK 83m. Sales activity within Ektornet
remained good, but transactions shrunk in size, which
negatively affected other income.
Expenses for Group Functions & Other increased by
9 per cent to SEK 400m (366) compared with the same
period in 2013. Excluding the net of services purchased
and sold internally, expenses increased by 8 per cent to
SEK 1 786m (1 659). The increase was mainly due to
higher IT development expenses and one-off expenses
of SEK 79m in connection with the forthcoming move of
the head office. This was partly offset by lower
expenses in Ektornet, where property management
expenses are dropping as the portfolio is disposed. Staff
costs decreased compared with the fourth quarter,
which contained redeployment provisions of SEK 100m.
Ektornet’s property values were written down by SEK
138m (81). The writedowns related to Ukraine and the
US.
Group Products
Swedbank’s product operations, Group Products (GP),
are centralised at the Group level to create a more
responsive and customer-driven product range and an
efficient product organisation. Consisting of around
1 800 employees in Sweden, Estonia, Latvia and
Lithuania, GP is responsible for a large part of
Swedbank’s product areas. It is also tasked with
supporting the business areas by reducing the
complexity of the product range and simplifying sales in
the various distribution channels. The product area GP
is responsible for – lending, deposits, payments, cards,
asset management and insurance – are described in
more detail from page 21. GP also comprises the
subsidiary Swedbank Franchise AB, which in turn
includes the real estate (Fastighetsbyrån and Svensk
Fastighetsförmedling) and business brokerages
(Företagsförmedling) and a legal service provider
(Juristbyrån).
In GP’s revenue and expense model, revenue from
Swedbank’s customers is posted by each business
segment and GP receives compensation from the
business segment to cover its expenses. GP’s external
revenue largely comes from the savings banks for the
products their customers use.
Expenses, excluding the net of services purchased and
sold internally, amounted to SEK 853m (788) for the first
quarter. The cost increase was mainly due to IT
operations and depreciation/amortisation.
Group Treasury
Group Treasury is responsible for the bank’s funding,
liquidity and capital planning. The Group’s equity is
allocated to each business segment on the basis of
capital adequacy rules and how much capital is needed
19. Swedbank – Interim report January-March 2014 Page 19 of 56
based on the bank's Internal Capital Adequacy
Assessment Process (ICAAP). Group Treasury prices
all flows in the Group through internal interest rates,
where the most important parameters are maturity,
interest fixing period, currency, and the need for liquidity
reserves.
Group Treasury’s result over time should be nearly nil,
with the exception of earnings that may arise in debt
and liquidity management within given risk mandates.
Risk hedging by Group Treasury is generally achieved
with financial instruments. The volatility in results over
time is largely due to accounting-based fluctuations in
these hedges.
Net interest income for the first quarter 2014 was SEK
447m, compared with SEK 526m year-on-year. In the
fourth quarter 2013 net interest income amounted to
SEK 496m. The change is largely driven by the
implementation of a model to refine internal pricing,
which was introduced in 2014. At the same time Group
Treasury’s net interest income was strengthened by
positions that have benefited from lower market rates.
Net gains and losses on financial items at fair value for
the first quarter 2014 amounted to SEK -247m,
compared with SEK -118m in the previous year. In the
fourth quarter 2013 net gains and losses on financial
items at fair value amounted to SEK -139m. The main
reason for the negative result is the impact of covered
bond repurchases, which are reflected in the equivalent
positive effects on net interest income over time.
Russia
The Russian operations are reported since 2013 as
discontinued operations. The first quarter result for
discontinued operations was SEK -37m (-398m). In the
first quarter 2013 the Ukrainian operations were
included in discontinued operations and affected the
result by SEK -383m. The Ukrainian operations were
sold in the second quarter 2013.
The formal liquidation of the legal entity OAO Swedbank
is continuing. The bank’s application to revoke its
banking licence in Russia was approved in 2013.
Swedbank’s net lending in Russia (including leasing)
amounted to SEK 1bn as of 31 March. The lending
portfolio in Russia, mainly consisting of good quality
corporate loans, will decrease as customers amortise
their loans. Swedbank has real estate assets worth
about SEK 2m in Russia, which will be sold.
Group Functions & Other consists of centralised business support units: Group Products, Group Staffs, and the
remaining operations in Russia. Group staffs, comprising Accounting & Finance (including Group Treasury and
Communication), Risk, IT, Compliance, Public Affairs, HR and Legal, operate across business areas and serve as
strategic and administrative support.
20. Swedbank – Interim report January-March 2014 Page 20 of 56
Eliminations
Income statement
Q1 Q4 Q1
SEKm 2014 2013 % 2013
Net interest income 4 -16 1
Net commissions 16 34 -53 17 -6
Net gains and losses on financial items at fair value 0 0 0
Other income -78 -94 17 -62 -26
Total income -58 -76 24 -44 32
Staff costs 0 -13 0
Variable staff costs 0 0 0
Other expenses -58 -63 8 -44 32
Depreciation/amortisation 0 0 0
Total expenses -58 -76 24 -44 32
Group eliminations mainly consist of eliminations of internal transactions between Group Functions and the other
business segments.
21. Swedbank – Interim report January-March 2014 Page 21 of 56
Product areas
Responsibility for the product units rests with Group Products (Group Functions & Other), but the results are reported in
several legal units and in the three business segments.
Lending/deposits
Lending products account for about 70 per cent of
Swedbank’s assets on the balance sheet. Swedbank’s
lending operations are concentrated in Sweden,
Estonia, Latvia, Lithuania and Norway. In addition,
lending is provided to a lesser extent in certain other
countries such as Finland, Denmark and the US.
Swedbank’s total lending to private customers and
corporations amounted to SEK 1 219bn (1 215 as of 31
December 2013). Household lending accounts for the
largest part, with mortgages to private customers and
tenant-owner associations in Sweden accounting for
about 50 per cent of the total. Swedbank’s market share
for mortgages in Sweden is 25 per cent. Over one
million customers obtain their mortgages through
Swedbank Mortgage, and lending is geographically
spread throughout the country.
Swedbank is also a major player in corporate lending in
Sweden, with lending of SEK 335bn and a market share
of 17 per cent as of 28 February (unchanged from 31
December 2013). Major sectors in Sweden include
property-related lending, which accounts for SEK
140bn, and the forestry and agricultural sector which
accounts for SEK 65bn, where Swedbank has a
dominant position. Swedbank is the largest lender in the
Baltic countries, with market shares of 25-45 per cent.
Estonia accounts for nearly half of Swedbank’s Baltic
loan portfolio, and there Swedbank has a market share
of over 45 per cent. Total lending in the Baltic countries
amounts to SEK 118bn, half of which is to households
and half to corporates. Major sectors for corporate
lending in the Baltic countries include commercial real
estate and manufacturing.
Swedbank is also a big player in deposits in its home
markets. Total deposit volumes as of 31 March
amounted to SEK 625bn (599), of which SEK 338bn
(341) was to private customers and SEK 287bn (258) to
corporate customers. Just over 75 per cent of
Swedbank’s total deposit volumes is in Sweden.
For more information on Swedbank’s lending and
deposits, see each business segment.
Payment operations
Swedbank is a leader in payment and cash
management products in its four home markets. Growth
in the payment area is based on economic growth and
on customers’ increasing use of payment means other
than cash.
Payments Jan-Mar Jan-Mar
Key figures 2014 2013 %
International payments (million) 2.5 2.3 6
of which Sweden 1.1 1.0 8
of which Baltic countries 1.3 1.3 4
Domestic payments (million) 1)
218.2 208.3 5
of which Sweden 164.6 155.0 6
of which Baltic countries 53.6 53.4 0
E-services payments (million) 2)
67.4 42.1 60
of which Sweden 58.3 36.5 60
of which Baltic countries 9.1 5.6 62
Factoring portfolio, SEKm 3 978 4 006 -1
of which Sweden 2 220 2 023 10
of which Baltic countries 1 758 1 810 -3
1)
Domestic payments include salary and mass payments, giro
payments, direct debit payments, internet payments.
2)
E-services payments include e-invoices, bank link payments, mobile
phone top-up transactions, number of signing transactions and ID
transactions through E-ID/BankID.
The payment area is strongly affected by changes in the
operating environment. Rapid technological
developments are creating a challenge in the form of
increased competition, especially from e-commerce
companies. Swedbank is well prepared in this regard in
terms of infrastructure and customer base as well as
opportunities to capitalise on economies of scale when
unified European legislation facilitates cross-border
trade in products and services. The development of a
common payment zone for the euro enables the bank to
offer services to customers with eurozone operations
without having to set up business in every country. It
also facilitates increased coordination and efficiency
improvements in the bank’s products and systems. One
example is the launch of a common clearing solution for
euros in Estonia and Latvia in the first quarter. An
automated e-invoicing payment solution was introduced
in Estonia as well.
Online payment services are an important growth area
for Swedbank. Today over 3 million customers in
Sweden and 2.2 million in the Baltic countries have
access to payment services through the Internet Bank
and the Mobile Bank. The number of transactions
through these channels grew by approximately 15 per
cent year-on-year. Users of Mobile BankID, which
facilitates online and mobile payments, are steadily
growing in number and have now surpassed 900 000.
Users of Swish, a solution for mobile payments shared
with other Swedish banks, are also growing increasing
and at the end of the quarter numbered over 1 030 000,
of which just over 420 000 are customers of Swedbank
and the savings banks
Trade Finance offers cash against documents (CAD),
letters of credit and bank guarantees. The bank’s
customers are increasingly demanding customised
solutions and new ways to improve liquidity. One
challenge for the bank’s Trade Finance offering is the
new payment and financing solutions being arranged
between importers and exporters, which in recent years
have accounted for a larger share of growing global
trade.
22. Swedbank – Interim report January-March 2014 Page 22 of 56
Payments Jan-Mar Jan-Mar
Income, SEKm 2014 2013 %
Net commission income 232 269 -14
of which Nordic countries 110 152 -28
of which Baltic countries 122 117 4
As of 30 September 2013 Bankomat AB took over
responsibility for Swedbank’s ATMs. Swedbank pays
Bankomat AB a commission, which explains SEK 34m
of the lower net commissions compared with the first
quarter 2013. For more information, see Swedish
Banking on pages 12.
Card business
Swedbank issues cards and acquires card payments
from merchants in all its home markets as well as in
Denmark and Norway. The payment acquisition
business was recently expanded to Finland. Credit card
operations in Sweden, Denmark and Norway are
conducted through Entercard AB, a joint venture with
Barclays Bank. Other card business takes place within
the bank. In its four home markets as a whole,
Swedbank has a market share for card issuing and
payment acquisitions of nearly 50 per cent. When a card
purchase is made where it is the payment acquirer,
Swedbank receives a commission from the merchant.
Every time a purchase is made using a Swedbank-
issued card, the bank receives interbank compensation
from the merchant. Similarly, Swedbank pays
compensation to other card issuers when their cards are
used in stores where Swedbank is the payment
acquirer.
Swedbank is Europe’s fifth largest card payment
acquirer based on number of transactions. In this
capacity, Swedbank enables retailers to accept payment
through card terminals and online. Revenue mainly
comes from the transaction fees received as
compensation for infrastructure, administration and
payment guarantees. As a card issuer, the bank
generates revenue for card fees, exchange fees for
foreign purchases and interest income from credit cards.
In card payment acquisitions, rapidly expanding e-
commerce is one of Swedbank’s most important growth
areas. The aim here is to be a significant player in the
bank’s home markets by leveraging its strong market
position in the physical card space and its expertise in
the payment area. For retailers, the bank offers e-
commerce solutions as a complement to other payment
solutions. Swedbank’s payment acquisition volume in e-
commerce has increased by just over 110 per cent
since the first quarter 2013.
Swedbank is the eleventh largest bank card issuer in
Europe based on number of transactions. Sweden is
among the countries in the world with the highest levels
of card usage. In Sweden, nearly 80 per cent of retail
purchases are made by card at the same time that the
number of cash withdrawals through ATMs is
decreasing. Transaction growth for card payments in
Sweden is about 10 per cent per year and volume
growth about 8 per cent. During the first quarter
Swedbank launched a prepaid card that simplifies
payments for customers and further reduces cash
usage. The new card, which works like an ordinary debit
card, can be used by municipalities, for example, to
replace cash contribution payments or by employers to
replace lunch vouchers. The percentage of card
transactions in stores is also high in Estonia (55 per
cent), with an annual growth rate of about 9 per cent. In
Latvia and Lithuania, card usage is lower (35 and 20 per
cent of all retail purchases respectively), but the growth
rate is expected to be higher than in Sweden and
Estonia. In card issuing in the Baltic countries, the
biggest growth opportunities are in corporate cards,
where the bank has historically been weaker and where
the large number of small businesses offers significant
potential.
Jan-Mar Jan-Mar
Key ratios, cards 2014 2013 %
Acquired transactions, million 439 401 9
of which Nordics 371 337 10
of which Baltic countries 68 64 6
Acquired volumes, SEKbn 104 96 9
of which Nordics 95 87 8
of which Baltic countries 9 8 16
Issued cards, millon 7.7 7.8 -1
of which Nordics 3.8 3.8 0
of which Baltic countries 3.9 4.0 -2
Number of purchases, million 299 266 12
of which Nordics 220 198 11
of which Baltic countries 79 69 15
POS as % of total turnover 67 65
of which Nordics 84 84
of which Baltic countries 16 16
Card related income Jan-Mar Jan-Mar
SEKm 2014 2013 %
Total income, SEKm 725 686 6
of which Nordics 405 395 3
of which Baltic countries 174 163 7
of which Entercard1)
146 129 14
1)
Swedbank's share of the profit or loss of the associate Entercard's.
Total income increased by 6 per cent year-on-year.
Nearly half of the increase came from Entercard and is
mainly an effect of growing credit volumes.
In the Baltic countries, the increase in card issuing
income is due to an increased number of transactions
and higher annual fees. The increase in payment
acquisition income is lower than volume growth due to
price pressure, increased competition and increased
price regulation.
Income from the card business in Sweden is increasing
more slowly than volume growth due to price pressure
on merchant fees and greater competition. The
expansion of the payment business to Norway and
Denmark now generates 5 per cent of the total number
of transactions, but a higher share of payment
acquisition income, since the margins are higher in
these markets.
23. Swedbank – Interim report January-March 2014 Page 23 of 56
Asset management business
Asset management operations are conducted through
the Swedbank Robur group in Swedbank’s four home
markets and Norway. In total, Swedbank Robur offers
around 140 funds as well as discretionary asset
management, including management of pension assets.
Fund assets under management amounted to
SEK 626bn, of which the Swedish operations accounted
for SEK 602bn. The market share in Sweden was 23.5
per cent in terms of assets under management.
Discretionary assets under management amounted to
SEK 290bn.
Of the total net inflow to the Swedish fund market, the
majority was to fixed income funds (SEK 23bn) and
mixed funds (SEK 10bn). Equity funds reported a net
outflow. The total net inflow to Swedbank Robur’s funds
in Sweden was SEK 2.2bn. This includes inflows to
fixed income funds (SEK 2.8bn) and mixed funds (SEK
1.5bn), while equity funds posted an outflow of SEK
1.8bn and hedge funds posted an outflow of SEK 0.3bn.
Swedbank’s market share of net inflows was 7.6 per
cent during the first quarter. The inflow to discretionary
asset management amounted to SEK 12bn in the
quarter.
In January the Swedish Consumer Agency launched a
review of the marketing of two of Swedbank Robur’s
actively managed funds - Allemansfond Komplett and
Kapitalinvest – to determine whether it had been
misleading. In March the Consumer Agency announced
that it had concluded its review without further action.
Asset management Jan-Mar Jan-Mar
Key ratios, SEKbn 2014 2013 %
Total income, SEKm 1 072 962 11
Assets under management 626 555 13
of which Sweden 602 536 12
of which Baltic countries 21 17 24
of which Norway 3 2 43
Discretionary asset management 290 259 12
of which Sweden 288 257 12
of which Baltic countries 2 2 0
Income from asset management products amounted to
SEK 1 072m during the period, which is 11 per cent
higher year-on-year. The improvement is mainly due to
the market’s positive development, which increased
average assets under management. Compared with the
previous quarter income decreased by SEK 17m.
Performance related income of SEK 38m was reported
in the fourth quarter 2013. Fewer days in the first
quarter compared with the fourth quarter reduced
income by about SEK 10m.
Insurance business
Swedbank has life insurance operations in all its home
markets and non-life operations in the Baltic countries.
Non-life insurance is offered in Sweden through a third-
party solution with the insurance company Tre Kronor.
Insurance products are sold through the distribution
channels of Swedbank and the savings banks.
Premium payments Jan-Mar Jan-Mar
SEKm 2014 2013 %
Sweden 5 719 5 402 6
of which collective occupational
pensions 2 420 2 526 -4
of which endowment insurance 2 438 2 087 17
of which occupational pensions 516 468 10
of which risk insurance 184 185 -1
of which other 161 136 18
Baltic countries 283 241 17
of which life insurance 175 149 17
of which non-life insurance 108 92 18
Sweden
Swedbank’s life insurance company has a market share
in premium payments of about 7 per cent, giving it a
joint fifth place in the Swedish market. During the first
quarter total premium income rose by 6 per cent to SEK
5.7bn. The increase was in both savings and risk
products. In savings products, the biggest increases
were again in endowment insurance for the corporate
market, thanks to information and education measures.
During the period over 26 000 risk protection (Trygga)
policies were sold, an increase of 4 per cent year-on-
year.
Due to an ageing population and shift in responsibility
from society to the individual, demand for pension and
insurance products is expected to grow. The largest
potential is in risk products such as life and health
insurance as well as in occupational pensions. Only 20
per cent of Swedbank’s and the savings banks’
corporate customers with revenues of SEK 1-100m
have an occupational pension solution for their
employees from Swedbank Försäkring.
Premium payments from occupational pensions rose to
SEK 516m (468) during the first quarter, due to an
increase in policies with annual premiums.
From 1 July 2013 until summer 2018 Swedbank
Försäkring is a company of choice for the collectively
negotiated occupational pension plan (ITP), which
permits it to offer collective occupational pensions to 1.5
million private sector employees. Swedbank Försäkring
offers 22 funds (about half from Robur) with the highest
aggregate ratings of all company options. Since July
2013 over 8 000 new agreements have been signed
and SEK 258m has been transferred from other
insurers, of which 1 500 plans and SEK 154m is
attributable to the first quarter 2014.
In connection with this interim report the bank is
publishing the European Embedded Value (EEV) of its
Swedish life insurance operations for the first time. EEV
indicates the value of the business as calculated
according to generally accepted principles, including the
present value of future cash flows in the year each
contract was signed. EEV includes the value of future
distributable earnings as well as allocated restricted and
non-restricted equity. It excludes the value of future
policies. EEV is calculated annually and amounted to
SEK 6 894m for Swedbank Försäkring AB as of 31
December 2013 (5 357). The change is largely due to
rising equity prices and higher market rates. For more
information, see page 41 of the fact book and the 2013
European Embedded Value report on the bank’s
website, www.swedbank.com/investor-
relations/financial-information-and-
24. Swedbank – Interim report January-March 2014 Page 24 of 56
publications/swedbanks-subsidiaries/other-
subsidiaries/index.htm.
Baltic countries
In Estonia and Lithuania, Swedbank is the largest life
insurance company, with market shares of 37 and 22
per cent respectively. The market share in Latvia is 15
per cent. Life insurance operations are divided into risk
insurance and savings products. Swedbank mainly
focuses on risk insurance for existing loan customers in
the retail banking market, where it sees significant
opportunities to promote sound and sustainable
finances because of the limited social safety net in the
Baltic countries.
Risk insurance premiums increased by 11 per cent in
local currency to SEK 31m during the first quarter,
mainly driven by increased demand for pure life
insurance products. In late 2013 there was an increase
in demand for long-term savings, including pension
insurance, as well as more short-term savings in
endowment insurance. This trend continued in the first
quarter 2014, leading to an increase in sales of savings
products of 57 per cent year-on-year. Premium
payments for the total life insurance operations
amounted to SEK 175m, an increase of 13 per cent in
local currency.
The market shares for non-life insurance in Estonia,
Latvia and Lithuania are 14, 3 and 1 per cent
respectively. In non-life insurance, Swedbank mainly
offers solutions for private customers. The largest
product areas are auto and home insurance, which are
offered together with leasing and mortgages. Total
premium income for non-life insurance amounted to
SEK 108m during the first quarter, an increase of 13 per
cent in local currency. Increases were reported for every
product, but especially home insurance, where more
active sales by bank branches led to higher volumes.
Assets under management 31 Mar 31 Mar
SEKbn 2014 2013 %
Sweden 122.7 118.2 4
of which collective occupational
pensions 50.5 47.6 6
of which endowment insurance 50.7 49.6 2
of which occupational pensions 12.8 12.4 4
of which other 8.7 8.6 1
Baltic countries 3.5 3.1 10
of which life insurance 3.5 3.1 10
Assets under management in the Swedish insurance
operations rose by 4 per cent to SEK 123bn during the
period, of which SEK 107bn relates to unit linked and
deposit insurance. The increase was due to higher stock
market prices and a positive net inflow. The inflow is
higher during the first quarter of the year than other
quarters due to premium payments for contractual
pensions. Assets under management in the Baltic life
insurance company remained at the same level in local
currency as in the beginning of the period and
amounted to SEK 3.5bn. Unit linked insurance is
growing and accounted for SEK 2.1bn. The traditionally
managed portfolio decreased owing to large pension
disbursements.
Insurance related income Jan-Mar Jan-Mar
SEKm 2014 2013 %
Sweden 359 417 -14
of which life insurance 348 392 -11
of which non-life insurance 11 25 -54
Baltic countries 103 93 11
of which life insurance 49 50 -2
of which non-life insurance 54 43 26
Total insurance related income 463 510 -9
Revenue
Swedbank’s aggregate insurance revenue amounted to
SEK 463m (510). The decrease in the Swedish life
insurance business is mainly because the first quarter
2013 contained a reversal of reserves that affected the
risk result. Part of the risk insurance premium is
continuously allocated to cover future claims based on
assumed claim trends. The decrease for the Swedish
non-life business is also due to positive one-off effects
in 2013.
Revenue for the Baltic life and non-life businesses
amounted to SEK 49m, a decrease of 6 per cent in local
currency year-on-year. The decrease is due to the
distribution to the parent company, which led to lower
interest income on the capital. Revenue for the Baltic
non-life business increased due to an improved risk
result, mainly because of a mild and relatively snow-free
winter. The claims ratio for the first quarter was 52.7 per
cent, compared with 59.5 per cent in the same period of
2013.
25. Swedbank – Interim report January-March 2014 Page 25 of 56
Financial information - contents
Group Page
Income statement, condensed 26
Statement of comprehensive income, condensed 27
Key ratios 27
Balance sheet, condensed 28
Statement of changes in equity, condensed 29
Cash flow statement, condensed 30
Notes
Note 1 Accounting policies 30
Note 2 Critical accounting estimates 31
Note 3 Changes in the Group structure 31
Note 4 Operating segments (business areas) 32
Note 5 Net interest income 34
Note 6 Net commissions 35
Note 7 Net gains and losses on financial items at fair value 36
Note 8 Other expenses 37
Note 9 Credit impairments 37
Note 10 Loans 38
Note 11 Impaired loans etc. 39
Note 12 Assets taken over for protection of claims and cancelled leases 39
Note 13 Credit exposures 39
Note 14 Intangible assets 40
Note 15 Amounts owed to credit institutions 41
Note 16 Deposits and borrowings from the public 41
Note 17 Debt securities in issue 41
Note 18 Derivatives 42
Note 19 Financial instruments carried at fair value 42
Note 20 Pledged collateral 45
Note 21 Offsetting financial assets and liabilities 45
Note 22 Capital adequacy consolidated situation 46
Note 23 Risks and uncertainties 48
Note 24 Discontinued operations 48
Note 25 Related-party transactions 48
Note 26 Swedbank’s share 49
Note 27 Effects of changes in accounting policies 50
Parent company
Income statement, condensed 51
Statement of comprehensive income, condensed 51
Balance sheet, condensed 52
Statement of changes in equity, condensed 53
Cash flow statement, condensed 53
Capital adequacy 54
More detailed information can be found in Swedbank’s fact book, www.swedbank.com/ir, under Financial information and
publications.
26. Swedbank – Interim report January-March 2014 Page 26 of 56
Income statement, condensed
Group Q1 Q4 Q1
SEKm 2014 2013 % 2013 %
Interest income 10 539 10 919 -3 11 069 -5
Interest expenses -5 056 -5 293 -4 -5 716 -12
Net interest income (note 5) 5 483 5 626 -3 5 353 2
Commission income 3 874 3 957 -2 3 420 13
Commission expenses -1 181 -1 258 -6 -1 032 14
Net commissions (note 6) 2 693 2 699 0 2 388 13
Net gains and losses on financial items at fair value (note 7) 345 461 -25 557 -38
Insurance premiums 493 421 17 498 -1
Insurance provisions -343 -240 43 -305 12
Net insurance 150 181 -17 193 -22
Share of profit or loss of associates 256 209 22 206 24
Other income 393 476 -17 385 2
Total income 9 320 9 652 -3 9 082 3
Staff costs 2 437 2 574 -5 2 358 3
Other expenses (note 8) 1 610 1 689 -5 1 514 6
Depreciation/amortisation 179 221 -19 171 5
Total expenses 4 226 4 484 -6 4 043 5
Profit before impairments 5 094 5 168 -1 5 039 1
Impairment of intangible assets (note 14) 0 12 0
Impairment of tangible assets 135 311 -57 85 59
Credit impairments (note 9) -100 -32 60
Operating profit 5 059 4 877 4 4 894 3
Tax expense 1 074 1 212 -11 976 10
Profit for the period from continuing operations 3 985 3 665 9 3 918 2
Profit for the period from discontinued operations, after tax -27 -48 -44 -390 -93
Profit for the period 3 958 3 617 9 3 528 12
Profit for the period attributable to the
shareholders of Swedbank AB 3 953 3 612 9 3 525 12
of which profit for the period from continuing operations 3 980 3 660 9 3 916 2
of which profit for the period from discontinued operations -27 -48 -44 -391 -93
Non-controlling interests 5 5 0 3 67
of which profit for the period from continuing operations 5 5 0 2
of which profit for the period from discontinued operations 0 0 1