SlideShare ist ein Scribd-Unternehmen logo
1 von 11
Downloaden Sie, um offline zu lesen
Income Statement 2003 2004 2005 2006 2007
Revenue 503.4 543.7 587.2 636.1 680.7
Less: COGS 405.2 432.3 496.2 513.4 558.2
Gross Profit 98.2 111.4 91 122.7 122.5
Less: SG&A 37.8 44.6 45.8 51.5 49
EBITDA 60.4 66.8 45.2 71.2 73.5
Less: Dep 6.8 6.2 6 5.9 6.1
EBIT 53.6 60.6 39.2 65.3 67.4
Less: Int Exp 5.5 5.8 5.9 5.3 3.3
EBT 48.1 54.8 33.3 60 64.1
Less: Taxes 19.2 22 13.3 24 25.6
Net Income 28.9 32.8 20 36 38.5
Margins 2003 2004 2005 2006 2007
Revenue Growth NA 8% 8% 8% 7%
Gross Margins 19.50% 21% 15.50% 19.30% 18%
SG&A/Revenue 7.50% 8.20% 7.80% 8.10% 7.20%
EBITDA Margin 12% 12.30% 7.70% 11.20% 10.80%
EBIT Margin 10.60% 11.10% 6.70% 10.30% 9.90%
Net Income Margin 5.70% 6% 3.40% 5.70% 5.70%
Effective Tax Rate 39.90% 40.10% 39.90% 40% 39.90%
Balance Sheet 2003 2004 2005 2006 2007
Cash & Cash Equiv's 4.3 5.1 4.8 7.8 5
Accounts Rec 62.1 70.1 78.8 87.1 93.3
Inventory 57.7 58 61.2 61.9 67.3
Total Current Assets 124.1 133.2 144.8 156.8 165.6
PP&E 201.4 202.9 203.1 202.3 204.4
Other non-current 12.3 12.1 11.8 12.5 10.8
Total Assets 337.8 348.2 359.7 371.6 380.8
Accs Pay & Accrued L's 42.2 45 51.6 53.4 58.1
Long-term Debt 91.6 82.8 73.8 65.8 54.8
Owner's Equity 204 220.4 234.3 252.4 267.9
Total L's & E's 337.8 348.2 359.7 371.6 380.8
Accounts Rec 62.1 70.1 78.8 87.1 93.3
Plus: Inv 57.7 58 61.2 61.9 67.3
Less: Acc Pay & Accrued L's 42.2 45 51.6 53.4 58.1
NWC 77.6 83.1 88.4 95.6 102.5
Cash Flow Statement
Cash From Operating Assets 2003 2004 2005 2006 2007
Net Income 28.9 32.8 20 36 38.5
Plus: Dep 6.8 6.2 6 5.9 6.1
Less: Increase in AR 3.1 8 8.7 8.3 6.2
Less: Increase in Inv 0.5 0.3 3.2 0.7 5.4
Plus: Increase in AP 0.3 2.8 6.6 1.8 4.7
Total Cash From Operations 32.4 33.5 20.7 34.7 37.7
Cash From Investing 2003 2004 2005 2006 2007
CapEX 7.3 7.7 6.2 5.1 8.2
Plus: Increases other Non-
Current Assets 0.5 -0.2 -0.3 0.7 -1.7
Total Cash Used for Investing 7.8 7.5 5.9 5.8 6.5
Cash From Financing 2003 2004 2005 2006 2007
Repayment of Debt 8 8.8 9 8 11
Plus: Dividend Payments 14.4 16.4 6.1 17.9 23
Cash Used in Financing 22.4 25.2 15.1 25.9 34
Total Cash Generated ($ 2.2) ($ 0.8) ($ (0.3) ($ 3.0) ($ (2.8)
Hannson Privte Label
Market Value Net Debt Enterprise Value Equity Beta Revenue EBITDA EBIT Net Income BV
Cthleen Sinclair 298.9 1329.6 1628.5 2.22 1346.8 255.3 163.4 21.5 -1112.8
General Health & Beauty 319.3 63.1 382.4 1.95 446.1 61.9 51.9 23.8 204.2
Women's Care Company 498.6 55.3 553.9 1.14 397.3 52.7 49.3 77 43.7
Skin Care Enterprises 1204.2 371.9 1576.1 1.35 1247.6 155.8 125.4 65.3 316.2
Hansson-current 49.8 317.7 1.26 680.7 73.5 67.4 38.5 267.9
Hansson- with expansion 107.6 514.5 ( 1.48) 765.7 82.2 72.1 41.3 267.9
EBITDA EBIT Earnings
Cthleen Sinclair 19% 12.10% 1.60%
General Health & Beauty 13.90% 11.60% 5.30%
Women's Care Company 13.30% 12.40% 19.40%
Skin Care Enterprises 12.50% 10.10% 5.20%
Hansson-current 10.80% 9.90% 5.70%
Hansson- of expansion 10.27% 5.56% 3.34%
Common Ratios
Total Debt Debt-Equity Equity Multiplier Long-term Debt Total Asset Turnover ROE ROA
Hansson-current 0.30 0.42 1.42 0.17 1.79 0.14 0.10
Hansson- with expansion 0.37 0.40 1.59 #REF! 1.80 0.15 0.097
Weighted Average Cost of Capital
Assumptions 2007 w/ Expansion
Risk-free Rate 3.75% 3.75%
Market Risk Premium 5% 5%
Est. Beta 1.26 ( 1.48)
CAPM Ke 10.05% 11.15%
Tax Rate 40% 40%
Est. EBITDA Multiple 7
Est. Enterprise Value 514.5
E/V 90.30% 79.10%
Existing Net Debt 49.8 49.8
Plus: Expansion Debt 57.8
Total Est. Debt 107.6
D/E 18.59% 25.4%
D/V 9.70% 20.90%
Assumed Debt Beta 0 0
Estimated Cost of Debt 7.75% 7.75%
WACC 9.53% 9.79%
Comparables D/V D/E Equity Beta Debt Beta Asset Beta
General Health & Beauty 16.50% 19.80% 1.95 0 1.74
Women's Care Company 10% 11.10% 1.14 0 1.07
Skin Care Enterprises 23.60% 30.90% 1.35 0 1.14
AVG 16.70% 20.60% ( 1.48) ( -  ) ( 1.32)
[Left out Cathleen Sinclair as it is an outlier and skews the data]
Net Present Value
Year Year 0 2009 2010 2011 2012 2013 2014 2015 2016 2017 2018
(+)Depreciation 4000 4000 4000 4000 4000 4000 4000 4000 4000 4000
(-) CAPX 1000
Intial Capital Outlay -12817 12817
(+/-) Changes in Working Capital -11728 -1219 -1272 -1314 -1364 -1409 -365 -372 -380 -387
Cash Flow 2,834 4,284 4,959 6,162 7,155 8,052 8,376 8,677 8,947 9,562
Total -1000 -17711 7065 7687 8848 9791 10643 12011 12305 12567 25992
Discount Rate 9.79%
NPV $36,933.58
Sensitivity Analysis 4% 5% 6% 7% 8% 9% 10% 11% 12% 13% 14%
$61,409.38 $56,186.91 $51,436.04 $47,109.11 $43,163.80 $39,562.45 $36,271.51 $33,261.03 $30,504.28 $27,977.35 $25,658.81
2009 2010 2011 2012 2013 2014 2015 2016 2017 2018
Total Revenue 84,960 94,120 103,040 112,800 122,880 132,600 135,320 138,040 140,760 144,160
(-) Total COGS 69,610 ( 75,639) ( 82,738) ( 89,731) ( 97,370) ( 104,837) ( 106,804) ( 108,811) ( 110,869) ( 112,979)
Gross Margin 15,350 18,481 20,302 23,069 25,510 27,763 28,516 29,229 29,891 31,181
(-) SG&A 6627 7341 8037 8798 9585 10343 10555 10767 10979 11244
EBITDA 8,723 11,140 12,265 14,270 15,926 17,420 17,961 18,462 18,912 19,936
(-) Depreciation $4,000) $4,000) $4,000) $4,000) $4,000) $4,000) $4,000) $4,000) $4,000) $4,000)
EBIT 4,723 7,140 8,265 10,270 11,926 13,420 13,961 14,462 14,912 15,936
(-) Tax @ 40% 1889 2856 3306 4108 4770 5368 5584 5785 5965 6374
Net Income 2,834 4,284 4,959 6,162 7,155 8,052 8,376 8,677 8,947 9,562
Changes in Net Working Capital
Balance Sheet Data: Year 0 2009 2010 2011 2012 2013 2014 2015 2016 2017 2018
Accounts Receivable (DSO x Sales / 365) 11080 12243 13449 14697 15991 17330 17677 18030 18391 18758
Plus: Inventory (DSI x COGS / 365) 7171 7791 8524 9246 10030 10801 11003 11209 11421 11639
Less: Accounts Payable (DPO x COGS / 365) 6522 7086 7753 8410 9123 9824 10008 10196 10389 10587
Net Working Capital 11728 12948 14219 15533 16898 18307 18671 19044 19423 19811
Change in Working Capital 11728 1219 1272 1314 1364 1409 365 372 380 387
Property, Plant & Equipment 45000 41000 37000 33000 29000 25000 21000 17000 13000 9000 5000
Total Invested Capital 45000 52728 49948 47219 44533 41898 39307 35671 32044 28423 24811
Sales 84,960 94,120 103,040 112,800 122,880 132,600 135,320 138,040 140,760 144,160
COGS 69,610 ( 75,639) ( 82,738) ( 89,731) ( 97,370) ( 104,837) ( 106,804) ( 108,811) ( 110,869) ( 112,979)
Days Sales Outstanding (DSO) 47.6x 47.6x 47.6x 47.6x 47.6x 47.6x 47.6x 47.6x 47.6x 47.6x
Days Sales Inventory (DSI) 37.6x 37.6x 37.6x 37.6x 37.6x 37.6x 37.6x 37.6x 37.6x 37.6x
Days Payable Outstanding 34.2x 34.2x 34.2x 34.2x 34.2x 34.2x 34.2x 34.2x 34.2x 34.2x
Investment Proposal
Cost components Amount Est. Life (yrs) Dep.
Facility Expansion $10,000) 20 $500)
Manufacturing Equipment 20,000 10 2,000
Packaging Equipment 15,000 10 1,500
Working Capital 12,817 0
Total Investment $57,817) $4,000)
Financial Assumptions
Revenue Projections 2009 2010 2011 2012 2013 2014 2015 2016 2017 2018
Total Capacity (000's) 80,000 80,000 80,000 80,000 80,000 80,000 80,000 80,000 80,000 80,000
Capacity Utilization 60% 65% 70% 75% 80% 85% 85% 85% 85% 85%
Unit Volume 48,000 52,000 56,000 60,000 64,000 68,000 68,000 68,000 68,000 68,000
Selling Price Per Unit (2% g) 1.77 1.81 1.84 1.88 1.92 1.95 1.99 2.03 2.07 2.12
Revenue 84,960 94,120 103,040 112,800 122,880 132,600 135,320 138,040 140,760 144,160
Production Costs 2009 2010 2011 2012 2013 2014 2015 2016 2017 2018
Raw Materials Per unit 1% 0.94 0.95 0.96 0.97 0.98 0.99 1.00 1.01 1.02 1.03
Manufacturing Overhead 3% 3,600 ( 3,708) ( 3,819) ( 3,934) ( 4,052) ( 4,173) ( 4,299) ( 4,428) ( 4,560) ( 4,697)
Maintenance Expense 3% 2,250 ( 2,318) ( 2,387) ( 2,459) ( 2,532) ( 2,608) ( 2,687) ( 2,767) ( 2,850) ( 2,936)
Salaried Labor Costs 640 662.4 1028.4 1064.4 1468.8 1520 1573.6 1628.8 1685.6 1744.8
Hourly Labor Costs 2009 2010 2011 2012 2013 2014 2015 2016 2017 2018
Cost Per Hourly Employee 40000 41400 42840 44340 45900 47500 49180 50900 52680 54520
Total Hourly Labor Cost (000's) 18000 19582 21806 24165 26714 29355 30393 31456 32556 33693
Total Labor Cost 18,640 20,245 22,834 25,230 28,183 30,875 31,967 33,085 34,242 35,438
SG&A / Revenue 7.80% 7.80% 7.80% 7.80% 7.80% 7.80% 7.80% 7.80% 7.80% 7.80%
Working Capital Assumptions 2009 2010 2011 2012 2013 2014 2015 2016 2017 2018
Days Sales Outstanding 47.6 47.6 47.6 47.6 47.6 47.6 47.6 47.6 47.6 47.6
Days Sales Inventory 37.6 37.6 37.6 37.6 37.6 37.6 37.6 37.6 37.6 37.6
Days Payable Outstanding 34.2 34.2 34.2 34.2 34.2 34.2 34.2 34.2 34.2 34.2

Weitere ähnliche Inhalte

Was ist angesagt?

Mrs. fields cookies odc section c_group 9
Mrs. fields cookies odc section c_group 9Mrs. fields cookies odc section c_group 9
Mrs. fields cookies odc section c_group 9
Karan Jaidka
 
Optical distorsion
Optical distorsionOptical distorsion
Optical distorsion
andreaq911
 
Case 3 3 dispensers-of-california
Case 3 3 dispensers-of-californiaCase 3 3 dispensers-of-california
Case 3 3 dispensers-of-california
Diana Ching
 

Was ist angesagt? (20)

Mrs. fields cookies odc section c_group 9
Mrs. fields cookies odc section c_group 9Mrs. fields cookies odc section c_group 9
Mrs. fields cookies odc section c_group 9
 
Apple and samsung balance sheet analysis
Apple and samsung balance sheet analysisApple and samsung balance sheet analysis
Apple and samsung balance sheet analysis
 
Solution chemalite
Solution chemaliteSolution chemalite
Solution chemalite
 
cooper industry case study
cooper industry case study cooper industry case study
cooper industry case study
 
Marriot Corp Case
Marriot Corp CaseMarriot Corp Case
Marriot Corp Case
 
Airborne Express
Airborne ExpressAirborne Express
Airborne Express
 
Anandam manufacturing company.1
Anandam manufacturing company.1Anandam manufacturing company.1
Anandam manufacturing company.1
 
P&G’s Acquisition of Gillette
P&G’s Acquisition of GilletteP&G’s Acquisition of Gillette
P&G’s Acquisition of Gillette
 
Optical distorsion
Optical distorsionOptical distorsion
Optical distorsion
 
Case 3 3 dispensers-of-california
Case 3 3 dispensers-of-californiaCase 3 3 dispensers-of-california
Case 3 3 dispensers-of-california
 
BTT - bigger better bolder BT - 20130501
BTT -  bigger better bolder BT - 20130501BTT -  bigger better bolder BT - 20130501
BTT - bigger better bolder BT - 20130501
 
Ribbons and bows report
Ribbons and bows reportRibbons and bows report
Ribbons and bows report
 
Capstone simulation presentation
Capstone simulation presentationCapstone simulation presentation
Capstone simulation presentation
 
5case
5case5case
5case
 
CAPSIM- Baldwin Sensor Presentation - 1
CAPSIM- Baldwin Sensor Presentation - 1CAPSIM- Baldwin Sensor Presentation - 1
CAPSIM- Baldwin Sensor Presentation - 1
 
The Rosewood Hotel Harvard Business Case
The Rosewood Hotel Harvard Business CaseThe Rosewood Hotel Harvard Business Case
The Rosewood Hotel Harvard Business Case
 
MarkStrat Simulation report
MarkStrat Simulation reportMarkStrat Simulation report
MarkStrat Simulation report
 
Distance still matters
Distance still mattersDistance still matters
Distance still matters
 
SureCut Shears Inc. - Financial Company Analysis
SureCut Shears Inc. - Financial Company AnalysisSureCut Shears Inc. - Financial Company Analysis
SureCut Shears Inc. - Financial Company Analysis
 
Destin brass
Destin brass Destin brass
Destin brass
 

Ähnlich wie Hansson

Jsw steel 2 qfy2011 261010
Jsw steel 2 qfy2011 261010Jsw steel 2 qfy2011 261010
Jsw steel 2 qfy2011 261010
Angel Broking
 
Erin Parker Atvidcf V1
Erin Parker Atvidcf V1Erin Parker Atvidcf V1
Erin Parker Atvidcf V1
Caneskid05
 
Firstcall recommend Essel Propack, Q4FY15 net profit up 66.09% y/y to INR454.10m
Firstcall recommend Essel Propack, Q4FY15 net profit up 66.09% y/y to INR454.10mFirstcall recommend Essel Propack, Q4FY15 net profit up 66.09% y/y to INR454.10m
Firstcall recommend Essel Propack, Q4FY15 net profit up 66.09% y/y to INR454.10m
IndiaNotes.com
 

Ähnlich wie Hansson (20)

Ppt ideko spx_team
Ppt ideko spx_teamPpt ideko spx_team
Ppt ideko spx_team
 
Excel Model for Valuation of Natural Gas Firm
Excel Model for Valuation of Natural Gas FirmExcel Model for Valuation of Natural Gas Firm
Excel Model for Valuation of Natural Gas Firm
 
INVESTAURA_Business-Planning-Template.pdf
INVESTAURA_Business-Planning-Template.pdfINVESTAURA_Business-Planning-Template.pdf
INVESTAURA_Business-Planning-Template.pdf
 
Cfa research presentation university at buffalo
Cfa research presentation university at buffalo Cfa research presentation university at buffalo
Cfa research presentation university at buffalo
 
Excel Model of Trading Firm
Excel Model of Trading FirmExcel Model of Trading Firm
Excel Model of Trading Firm
 
Jsw steel 2 qfy2011 261010
Jsw steel 2 qfy2011 261010Jsw steel 2 qfy2011 261010
Jsw steel 2 qfy2011 261010
 
Financial Model Sample Format - Cement Company
Financial Model Sample Format - Cement CompanyFinancial Model Sample Format - Cement Company
Financial Model Sample Format - Cement Company
 
Wassim Zhani Kroger Value.pdf
Wassim Zhani Kroger Value.pdfWassim Zhani Kroger Value.pdf
Wassim Zhani Kroger Value.pdf
 
Profit and loss
Profit and lossProfit and loss
Profit and loss
 
KENYA AIRWAYS STATEMENT ANALYSIS- CIFA LUDENYO
KENYA AIRWAYS STATEMENT ANALYSIS- CIFA LUDENYOKENYA AIRWAYS STATEMENT ANALYSIS- CIFA LUDENYO
KENYA AIRWAYS STATEMENT ANALYSIS- CIFA LUDENYO
 
Horniman Horticulture, FIL 349 ( Advanced Financial Theory and Problems)
Horniman Horticulture, FIL 349 ( Advanced Financial Theory and Problems)Horniman Horticulture, FIL 349 ( Advanced Financial Theory and Problems)
Horniman Horticulture, FIL 349 ( Advanced Financial Theory and Problems)
 
AZN/ALXN
AZN/ALXNAZN/ALXN
AZN/ALXN
 
Erin Parker Atvidcf V1
Erin Parker Atvidcf V1Erin Parker Atvidcf V1
Erin Parker Atvidcf V1
 
$ANF Valuation Model
$ANF Valuation Model$ANF Valuation Model
$ANF Valuation Model
 
Income Statement Prediction
Income Statement Prediction Income Statement Prediction
Income Statement Prediction
 
Discounted Cash Flow Method of Valution for Maruti Suzuki
Discounted Cash Flow Method of Valution for Maruti SuzukiDiscounted Cash Flow Method of Valution for Maruti Suzuki
Discounted Cash Flow Method of Valution for Maruti Suzuki
 
Security analysis
Security analysisSecurity analysis
Security analysis
 
IFF 2016 DCF
IFF 2016 DCFIFF 2016 DCF
IFF 2016 DCF
 
Firstcall recommend Essel Propack, Q4FY15 net profit up 66.09% y/y to INR454.10m
Firstcall recommend Essel Propack, Q4FY15 net profit up 66.09% y/y to INR454.10mFirstcall recommend Essel Propack, Q4FY15 net profit up 66.09% y/y to INR454.10m
Firstcall recommend Essel Propack, Q4FY15 net profit up 66.09% y/y to INR454.10m
 
MF
MFMF
MF
 

Kürzlich hochgeladen

Kürzlich hochgeladen (20)

UAE Bur Dubai Call Girls ☏ 0564401582 Call Girl in Bur Dubai
UAE Bur Dubai Call Girls ☏ 0564401582 Call Girl in Bur DubaiUAE Bur Dubai Call Girls ☏ 0564401582 Call Girl in Bur Dubai
UAE Bur Dubai Call Girls ☏ 0564401582 Call Girl in Bur Dubai
 
Chennai Call Gril 80022//12248 Only For Sex And High Profile Best Gril Sex Av...
Chennai Call Gril 80022//12248 Only For Sex And High Profile Best Gril Sex Av...Chennai Call Gril 80022//12248 Only For Sex And High Profile Best Gril Sex Av...
Chennai Call Gril 80022//12248 Only For Sex And High Profile Best Gril Sex Av...
 
HomeRoots Pitch Deck | Investor Insights | April 2024
HomeRoots Pitch Deck | Investor Insights | April 2024HomeRoots Pitch Deck | Investor Insights | April 2024
HomeRoots Pitch Deck | Investor Insights | April 2024
 
joint cost.pptx COST ACCOUNTING Sixteenth Edition ...
joint cost.pptx  COST ACCOUNTING  Sixteenth Edition                          ...joint cost.pptx  COST ACCOUNTING  Sixteenth Edition                          ...
joint cost.pptx COST ACCOUNTING Sixteenth Edition ...
 
Marel Q1 2024 Investor Presentation from May 8, 2024
Marel Q1 2024 Investor Presentation from May 8, 2024Marel Q1 2024 Investor Presentation from May 8, 2024
Marel Q1 2024 Investor Presentation from May 8, 2024
 
Getting Real with AI - Columbus DAW - May 2024 - Nick Woo from AlignAI
Getting Real with AI - Columbus DAW - May 2024 - Nick Woo from AlignAIGetting Real with AI - Columbus DAW - May 2024 - Nick Woo from AlignAI
Getting Real with AI - Columbus DAW - May 2024 - Nick Woo from AlignAI
 
WheelTug Short Pitch Deck 2024 | Byond Insights
WheelTug Short Pitch Deck 2024 | Byond InsightsWheelTug Short Pitch Deck 2024 | Byond Insights
WheelTug Short Pitch Deck 2024 | Byond Insights
 
Buy gmail accounts.pdf buy Old Gmail Accounts
Buy gmail accounts.pdf buy Old Gmail AccountsBuy gmail accounts.pdf buy Old Gmail Accounts
Buy gmail accounts.pdf buy Old Gmail Accounts
 
Escorts in Nungambakkam Phone 8250092165 Enjoy 24/7 Escort Service Enjoy Your...
Escorts in Nungambakkam Phone 8250092165 Enjoy 24/7 Escort Service Enjoy Your...Escorts in Nungambakkam Phone 8250092165 Enjoy 24/7 Escort Service Enjoy Your...
Escorts in Nungambakkam Phone 8250092165 Enjoy 24/7 Escort Service Enjoy Your...
 
GUWAHATI 💋 Call Girl 9827461493 Call Girls in Escort service book now
GUWAHATI 💋 Call Girl 9827461493 Call Girls in  Escort service book nowGUWAHATI 💋 Call Girl 9827461493 Call Girls in  Escort service book now
GUWAHATI 💋 Call Girl 9827461493 Call Girls in Escort service book now
 
PARK STREET 💋 Call Girl 9827461493 Call Girls in Escort service book now
PARK STREET 💋 Call Girl 9827461493 Call Girls in  Escort service book nowPARK STREET 💋 Call Girl 9827461493 Call Girls in  Escort service book now
PARK STREET 💋 Call Girl 9827461493 Call Girls in Escort service book now
 
Horngren’s Cost Accounting A Managerial Emphasis, Canadian 9th edition soluti...
Horngren’s Cost Accounting A Managerial Emphasis, Canadian 9th edition soluti...Horngren’s Cost Accounting A Managerial Emphasis, Canadian 9th edition soluti...
Horngren’s Cost Accounting A Managerial Emphasis, Canadian 9th edition soluti...
 
CROSS CULTURAL NEGOTIATION BY PANMISEM NS
CROSS CULTURAL NEGOTIATION BY PANMISEM NSCROSS CULTURAL NEGOTIATION BY PANMISEM NS
CROSS CULTURAL NEGOTIATION BY PANMISEM NS
 
Lundin Gold - Q1 2024 Conference Call Presentation (Revised)
Lundin Gold - Q1 2024 Conference Call Presentation (Revised)Lundin Gold - Q1 2024 Conference Call Presentation (Revised)
Lundin Gold - Q1 2024 Conference Call Presentation (Revised)
 
Durg CALL GIRL ❤ 82729*64427❤ CALL GIRLS IN durg ESCORTS
Durg CALL GIRL ❤ 82729*64427❤ CALL GIRLS IN durg ESCORTSDurg CALL GIRL ❤ 82729*64427❤ CALL GIRLS IN durg ESCORTS
Durg CALL GIRL ❤ 82729*64427❤ CALL GIRLS IN durg ESCORTS
 
Arti Languages Pre Seed Teaser Deck 2024.pdf
Arti Languages Pre Seed Teaser Deck 2024.pdfArti Languages Pre Seed Teaser Deck 2024.pdf
Arti Languages Pre Seed Teaser Deck 2024.pdf
 
Paradip CALL GIRL❤7091819311❤CALL GIRLS IN ESCORT SERVICE WE ARE PROVIDING
Paradip CALL GIRL❤7091819311❤CALL GIRLS IN ESCORT SERVICE WE ARE PROVIDINGParadip CALL GIRL❤7091819311❤CALL GIRLS IN ESCORT SERVICE WE ARE PROVIDING
Paradip CALL GIRL❤7091819311❤CALL GIRLS IN ESCORT SERVICE WE ARE PROVIDING
 
Falcon Invoice Discounting: The best investment platform in india for investors
Falcon Invoice Discounting: The best investment platform in india for investorsFalcon Invoice Discounting: The best investment platform in india for investors
Falcon Invoice Discounting: The best investment platform in india for investors
 
Berhampur 70918*19311 CALL GIRLS IN ESCORT SERVICE WE ARE PROVIDING
Berhampur 70918*19311 CALL GIRLS IN ESCORT SERVICE WE ARE PROVIDINGBerhampur 70918*19311 CALL GIRLS IN ESCORT SERVICE WE ARE PROVIDING
Berhampur 70918*19311 CALL GIRLS IN ESCORT SERVICE WE ARE PROVIDING
 
Berhampur CALL GIRL❤7091819311❤CALL GIRLS IN ESCORT SERVICE WE ARE PROVIDING
Berhampur CALL GIRL❤7091819311❤CALL GIRLS IN ESCORT SERVICE WE ARE PROVIDINGBerhampur CALL GIRL❤7091819311❤CALL GIRLS IN ESCORT SERVICE WE ARE PROVIDING
Berhampur CALL GIRL❤7091819311❤CALL GIRLS IN ESCORT SERVICE WE ARE PROVIDING
 

Hansson

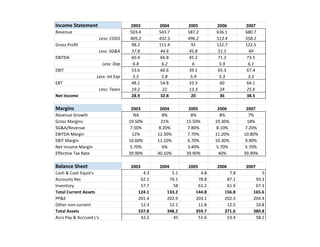
  • 1. Income Statement 2003 2004 2005 2006 2007 Revenue 503.4 543.7 587.2 636.1 680.7 Less: COGS 405.2 432.3 496.2 513.4 558.2 Gross Profit 98.2 111.4 91 122.7 122.5 Less: SG&A 37.8 44.6 45.8 51.5 49 EBITDA 60.4 66.8 45.2 71.2 73.5 Less: Dep 6.8 6.2 6 5.9 6.1 EBIT 53.6 60.6 39.2 65.3 67.4 Less: Int Exp 5.5 5.8 5.9 5.3 3.3 EBT 48.1 54.8 33.3 60 64.1 Less: Taxes 19.2 22 13.3 24 25.6 Net Income 28.9 32.8 20 36 38.5 Margins 2003 2004 2005 2006 2007 Revenue Growth NA 8% 8% 8% 7% Gross Margins 19.50% 21% 15.50% 19.30% 18% SG&A/Revenue 7.50% 8.20% 7.80% 8.10% 7.20% EBITDA Margin 12% 12.30% 7.70% 11.20% 10.80% EBIT Margin 10.60% 11.10% 6.70% 10.30% 9.90% Net Income Margin 5.70% 6% 3.40% 5.70% 5.70% Effective Tax Rate 39.90% 40.10% 39.90% 40% 39.90% Balance Sheet 2003 2004 2005 2006 2007 Cash & Cash Equiv's 4.3 5.1 4.8 7.8 5 Accounts Rec 62.1 70.1 78.8 87.1 93.3 Inventory 57.7 58 61.2 61.9 67.3 Total Current Assets 124.1 133.2 144.8 156.8 165.6 PP&E 201.4 202.9 203.1 202.3 204.4 Other non-current 12.3 12.1 11.8 12.5 10.8 Total Assets 337.8 348.2 359.7 371.6 380.8 Accs Pay & Accrued L's 42.2 45 51.6 53.4 58.1
  • 2. Long-term Debt 91.6 82.8 73.8 65.8 54.8 Owner's Equity 204 220.4 234.3 252.4 267.9 Total L's & E's 337.8 348.2 359.7 371.6 380.8 Accounts Rec 62.1 70.1 78.8 87.1 93.3 Plus: Inv 57.7 58 61.2 61.9 67.3 Less: Acc Pay & Accrued L's 42.2 45 51.6 53.4 58.1 NWC 77.6 83.1 88.4 95.6 102.5 Cash Flow Statement Cash From Operating Assets 2003 2004 2005 2006 2007 Net Income 28.9 32.8 20 36 38.5 Plus: Dep 6.8 6.2 6 5.9 6.1 Less: Increase in AR 3.1 8 8.7 8.3 6.2 Less: Increase in Inv 0.5 0.3 3.2 0.7 5.4 Plus: Increase in AP 0.3 2.8 6.6 1.8 4.7 Total Cash From Operations 32.4 33.5 20.7 34.7 37.7 Cash From Investing 2003 2004 2005 2006 2007 CapEX 7.3 7.7 6.2 5.1 8.2 Plus: Increases other Non- Current Assets 0.5 -0.2 -0.3 0.7 -1.7 Total Cash Used for Investing 7.8 7.5 5.9 5.8 6.5 Cash From Financing 2003 2004 2005 2006 2007 Repayment of Debt 8 8.8 9 8 11 Plus: Dividend Payments 14.4 16.4 6.1 17.9 23 Cash Used in Financing 22.4 25.2 15.1 25.9 34
  • 3. Total Cash Generated ($ 2.2) ($ 0.8) ($ (0.3) ($ 3.0) ($ (2.8)
  • 5. Market Value Net Debt Enterprise Value Equity Beta Revenue EBITDA EBIT Net Income BV Cthleen Sinclair 298.9 1329.6 1628.5 2.22 1346.8 255.3 163.4 21.5 -1112.8 General Health & Beauty 319.3 63.1 382.4 1.95 446.1 61.9 51.9 23.8 204.2 Women's Care Company 498.6 55.3 553.9 1.14 397.3 52.7 49.3 77 43.7 Skin Care Enterprises 1204.2 371.9 1576.1 1.35 1247.6 155.8 125.4 65.3 316.2 Hansson-current 49.8 317.7 1.26 680.7 73.5 67.4 38.5 267.9 Hansson- with expansion 107.6 514.5 ( 1.48) 765.7 82.2 72.1 41.3 267.9 EBITDA EBIT Earnings Cthleen Sinclair 19% 12.10% 1.60% General Health & Beauty 13.90% 11.60% 5.30% Women's Care Company 13.30% 12.40% 19.40% Skin Care Enterprises 12.50% 10.10% 5.20% Hansson-current 10.80% 9.90% 5.70% Hansson- of expansion 10.27% 5.56% 3.34% Common Ratios Total Debt Debt-Equity Equity Multiplier Long-term Debt Total Asset Turnover ROE ROA Hansson-current 0.30 0.42 1.42 0.17 1.79 0.14 0.10 Hansson- with expansion 0.37 0.40 1.59 #REF! 1.80 0.15 0.097
  • 6.
  • 7. Weighted Average Cost of Capital Assumptions 2007 w/ Expansion Risk-free Rate 3.75% 3.75% Market Risk Premium 5% 5% Est. Beta 1.26 ( 1.48) CAPM Ke 10.05% 11.15% Tax Rate 40% 40% Est. EBITDA Multiple 7 Est. Enterprise Value 514.5 E/V 90.30% 79.10% Existing Net Debt 49.8 49.8 Plus: Expansion Debt 57.8 Total Est. Debt 107.6 D/E 18.59% 25.4% D/V 9.70% 20.90% Assumed Debt Beta 0 0 Estimated Cost of Debt 7.75% 7.75% WACC 9.53% 9.79% Comparables D/V D/E Equity Beta Debt Beta Asset Beta General Health & Beauty 16.50% 19.80% 1.95 0 1.74 Women's Care Company 10% 11.10% 1.14 0 1.07 Skin Care Enterprises 23.60% 30.90% 1.35 0 1.14 AVG 16.70% 20.60% ( 1.48) ( -  ) ( 1.32)
  • 8. [Left out Cathleen Sinclair as it is an outlier and skews the data]
  • 9. Net Present Value Year Year 0 2009 2010 2011 2012 2013 2014 2015 2016 2017 2018 (+)Depreciation 4000 4000 4000 4000 4000 4000 4000 4000 4000 4000 (-) CAPX 1000 Intial Capital Outlay -12817 12817 (+/-) Changes in Working Capital -11728 -1219 -1272 -1314 -1364 -1409 -365 -372 -380 -387 Cash Flow 2,834 4,284 4,959 6,162 7,155 8,052 8,376 8,677 8,947 9,562 Total -1000 -17711 7065 7687 8848 9791 10643 12011 12305 12567 25992 Discount Rate 9.79% NPV $36,933.58 Sensitivity Analysis 4% 5% 6% 7% 8% 9% 10% 11% 12% 13% 14% $61,409.38 $56,186.91 $51,436.04 $47,109.11 $43,163.80 $39,562.45 $36,271.51 $33,261.03 $30,504.28 $27,977.35 $25,658.81 2009 2010 2011 2012 2013 2014 2015 2016 2017 2018 Total Revenue 84,960 94,120 103,040 112,800 122,880 132,600 135,320 138,040 140,760 144,160 (-) Total COGS 69,610 ( 75,639) ( 82,738) ( 89,731) ( 97,370) ( 104,837) ( 106,804) ( 108,811) ( 110,869) ( 112,979) Gross Margin 15,350 18,481 20,302 23,069 25,510 27,763 28,516 29,229 29,891 31,181 (-) SG&A 6627 7341 8037 8798 9585 10343 10555 10767 10979 11244 EBITDA 8,723 11,140 12,265 14,270 15,926 17,420 17,961 18,462 18,912 19,936 (-) Depreciation $4,000) $4,000) $4,000) $4,000) $4,000) $4,000) $4,000) $4,000) $4,000) $4,000) EBIT 4,723 7,140 8,265 10,270 11,926 13,420 13,961 14,462 14,912 15,936 (-) Tax @ 40% 1889 2856 3306 4108 4770 5368 5584 5785 5965 6374 Net Income 2,834 4,284 4,959 6,162 7,155 8,052 8,376 8,677 8,947 9,562 Changes in Net Working Capital Balance Sheet Data: Year 0 2009 2010 2011 2012 2013 2014 2015 2016 2017 2018 Accounts Receivable (DSO x Sales / 365) 11080 12243 13449 14697 15991 17330 17677 18030 18391 18758 Plus: Inventory (DSI x COGS / 365) 7171 7791 8524 9246 10030 10801 11003 11209 11421 11639 Less: Accounts Payable (DPO x COGS / 365) 6522 7086 7753 8410 9123 9824 10008 10196 10389 10587 Net Working Capital 11728 12948 14219 15533 16898 18307 18671 19044 19423 19811 Change in Working Capital 11728 1219 1272 1314 1364 1409 365 372 380 387 Property, Plant & Equipment 45000 41000 37000 33000 29000 25000 21000 17000 13000 9000 5000 Total Invested Capital 45000 52728 49948 47219 44533 41898 39307 35671 32044 28423 24811 Sales 84,960 94,120 103,040 112,800 122,880 132,600 135,320 138,040 140,760 144,160
  • 10. COGS 69,610 ( 75,639) ( 82,738) ( 89,731) ( 97,370) ( 104,837) ( 106,804) ( 108,811) ( 110,869) ( 112,979) Days Sales Outstanding (DSO) 47.6x 47.6x 47.6x 47.6x 47.6x 47.6x 47.6x 47.6x 47.6x 47.6x Days Sales Inventory (DSI) 37.6x 37.6x 37.6x 37.6x 37.6x 37.6x 37.6x 37.6x 37.6x 37.6x Days Payable Outstanding 34.2x 34.2x 34.2x 34.2x 34.2x 34.2x 34.2x 34.2x 34.2x 34.2x Investment Proposal Cost components Amount Est. Life (yrs) Dep. Facility Expansion $10,000) 20 $500) Manufacturing Equipment 20,000 10 2,000 Packaging Equipment 15,000 10 1,500 Working Capital 12,817 0 Total Investment $57,817) $4,000) Financial Assumptions Revenue Projections 2009 2010 2011 2012 2013 2014 2015 2016 2017 2018 Total Capacity (000's) 80,000 80,000 80,000 80,000 80,000 80,000 80,000 80,000 80,000 80,000 Capacity Utilization 60% 65% 70% 75% 80% 85% 85% 85% 85% 85% Unit Volume 48,000 52,000 56,000 60,000 64,000 68,000 68,000 68,000 68,000 68,000 Selling Price Per Unit (2% g) 1.77 1.81 1.84 1.88 1.92 1.95 1.99 2.03 2.07 2.12 Revenue 84,960 94,120 103,040 112,800 122,880 132,600 135,320 138,040 140,760 144,160 Production Costs 2009 2010 2011 2012 2013 2014 2015 2016 2017 2018 Raw Materials Per unit 1% 0.94 0.95 0.96 0.97 0.98 0.99 1.00 1.01 1.02 1.03 Manufacturing Overhead 3% 3,600 ( 3,708) ( 3,819) ( 3,934) ( 4,052) ( 4,173) ( 4,299) ( 4,428) ( 4,560) ( 4,697) Maintenance Expense 3% 2,250 ( 2,318) ( 2,387) ( 2,459) ( 2,532) ( 2,608) ( 2,687) ( 2,767) ( 2,850) ( 2,936) Salaried Labor Costs 640 662.4 1028.4 1064.4 1468.8 1520 1573.6 1628.8 1685.6 1744.8 Hourly Labor Costs 2009 2010 2011 2012 2013 2014 2015 2016 2017 2018 Cost Per Hourly Employee 40000 41400 42840 44340 45900 47500 49180 50900 52680 54520 Total Hourly Labor Cost (000's) 18000 19582 21806 24165 26714 29355 30393 31456 32556 33693 Total Labor Cost 18,640 20,245 22,834 25,230 28,183 30,875 31,967 33,085 34,242 35,438 SG&A / Revenue 7.80% 7.80% 7.80% 7.80% 7.80% 7.80% 7.80% 7.80% 7.80% 7.80% Working Capital Assumptions 2009 2010 2011 2012 2013 2014 2015 2016 2017 2018 Days Sales Outstanding 47.6 47.6 47.6 47.6 47.6 47.6 47.6 47.6 47.6 47.6 Days Sales Inventory 37.6 37.6 37.6 37.6 37.6 37.6 37.6 37.6 37.6 37.6
  • 11. Days Payable Outstanding 34.2 34.2 34.2 34.2 34.2 34.2 34.2 34.2 34.2 34.2