Procurement Purchase Orders And Cost Reduction Dashboard
•
0 gefällt mir•1,436 views

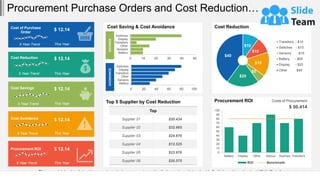
This document summarizes procurement-related cost savings and avoidance from the past five years. A chart shows the top categories contributing to cost reduction, with "Transitors" and "Switches" each saving $10, "Sensors" saving $15, "Battery" saving $5, and "Display" saving $20. Another chart shows the top six suppliers by cost reduction amounts.
Melden
Teilen
Melden
Teilen
Downloaden Sie, um offline zu lesen

Empfohlen
Empfohlen
Weitere ähnliche Inhalte
Was ist angesagt?
Was ist angesagt? (20)
Risk Management KPI Dashboard Showing Risk Heat Map And Control Rate By Period
Risk Management KPI Dashboard Showing Risk Heat Map And Control Rate By Period
Project Status KPI Dashboard Showing Schedule And Alignment
Project Status KPI Dashboard Showing Schedule And Alignment
Financial Performance KPI Dashboard Showing Payroll Headcount Ratio Cost Per ...
Financial Performance KPI Dashboard Showing Payroll Headcount Ratio Cost Per ...
KPI Dashboard Showing Employee Churn Key Metrics And Open Positions
KPI Dashboard Showing Employee Churn Key Metrics And Open Positions
Project Status KPI Dashboard Showing Project Timeline And Budget
Project Status KPI Dashboard Showing Project Timeline And Budget
Project Status KPI Dashboard Showing Completed Tasks And Task In Progress
Project Status KPI Dashboard Showing Completed Tasks And Task In Progress
Risk Management KPI Dashboard Showing Overall Security Risk And Regulatory Co...
Risk Management KPI Dashboard Showing Overall Security Risk And Regulatory Co...
Process Reengineering Process Documenting Process Continuous Improvement Busi...
Process Reengineering Process Documenting Process Continuous Improvement Busi...
Digital Business Transformation Powerpoint Templates
Digital Business Transformation Powerpoint Templates
Project Portfolio Management Kpi And Dashboard PowerPoint Presentation Slides
Project Portfolio Management Kpi And Dashboard PowerPoint Presentation Slides
Infographics Shapes TimeLines PPT Flow Diagrams - infodiagram part2
Infographics Shapes TimeLines PPT Flow Diagrams - infodiagram part2
Ähnlich wie Procurement Purchase Orders And Cost Reduction Dashboard
Ähnlich wie Procurement Purchase Orders And Cost Reduction Dashboard (20)
Supply Chain Management KPI Dashboard Showing Cost Reduction And Procurement Roi
Supply Chain Management KPI Dashboard Showing Cost Reduction And Procurement Roi
business_kpi_dashboard_showing_revenue_and_customer_lifetime_value_wd.pptx
business_kpi_dashboard_showing_revenue_and_customer_lifetime_value_wd.pptx
Marketing KPI Dashboard Showing Lead Funnel Traffic Sources Key Metrics
Marketing KPI Dashboard Showing Lead Funnel Traffic Sources Key Metrics
Compliance And Legal KPI Dashboard Showing High Priority Violations
Compliance And Legal KPI Dashboard Showing High Priority Violations
Quality Dashboard With Quality Index By Measures And Quality Index
Quality Dashboard With Quality Index By Measures And Quality Index
Financial Performance KPI Dashboard Showing Gross Profit Margin Sales Growth ...
Financial Performance KPI Dashboard Showing Gross Profit Margin Sales Growth ...
Compliance And Legal KPI Dashboard Showing Compliance Issues And Resolution Time
Compliance And Legal KPI Dashboard Showing Compliance Issues And Resolution Time
Financial Ratio KPI Dashboard Showing Revenue Net Profit Margin And Debt To E...
Financial Ratio KPI Dashboard Showing Revenue Net Profit Margin And Debt To E...
Call Center KPI Dashboard Showing Abandon Percentage Total Queue Entries
Call Center KPI Dashboard Showing Abandon Percentage Total Queue Entries
Hr Dashboard Number Of Employees Employee Structure
Hr Dashboard Number Of Employees Employee Structure
Manufacturing KPI Dashboard Showing Production Rate And Lost Units
Manufacturing KPI Dashboard Showing Production Rate And Lost Units
Audit KPI Dashboard Showing Audit Status Auditable Entry Risk Rating
Audit KPI Dashboard Showing Audit Status Auditable Entry Risk Rating
Information Technology KPI Dashboard Showing Incident Target Summary Trend
Information Technology KPI Dashboard Showing Incident Target Summary Trend
Project Name Status Schedule And Management Dashboard
Project Name Status Schedule And Management Dashboard
Quality Control KPI Dashboard Showing Defects And Downtime
Quality Control KPI Dashboard Showing Defects And Downtime
Mehr von SlideTeam
Mehr von SlideTeam (20)
Customer Support And Services Guide Powerpoint Presentation Slides
Customer Support And Services Guide Powerpoint Presentation Slides
Word Of Mouth WOM Marketing Strategies To Build Brand Awareness Powerpoint Pr...
Word Of Mouth WOM Marketing Strategies To Build Brand Awareness Powerpoint Pr...
Strategic Staff Engagement Action Plan Powerpoint Presentation Slides
Strategic Staff Engagement Action Plan Powerpoint Presentation Slides
Traditional Marketing Channel Analysis Powerpoint Presentation Slides Mkt Cd
Traditional Marketing Channel Analysis Powerpoint Presentation Slides Mkt Cd
Integrating Asset Tracking System To Enhance Operational Effectiveness Comple...
Integrating Asset Tracking System To Enhance Operational Effectiveness Comple...
Designing And Implementing Brand Leadership Strategy Powerpoint Presentation ...
Designing And Implementing Brand Leadership Strategy Powerpoint Presentation ...
How Amazon Generates Revenues Across Globe Powerpoint Presentation Slides Str...
How Amazon Generates Revenues Across Globe Powerpoint Presentation Slides Str...
Guide For Effective Event Marketing Powerpoint Presentation Slides Mkt Cd
Guide For Effective Event Marketing Powerpoint Presentation Slides Mkt Cd
Managing Business Customers Technology Powerpoint Presentation Slides
Managing Business Customers Technology Powerpoint Presentation Slides
Unearthing Apples Billion Dollar Branding Secret Powerpoint Presentation Slid...
Unearthing Apples Billion Dollar Branding Secret Powerpoint Presentation Slid...
Developing Flexible Working Practices To Improve Employee Engagement Powerpoi...
Developing Flexible Working Practices To Improve Employee Engagement Powerpoi...
Product Corporate And Umbrella Branding Powerpoint Presentation Slides Brandi...
Product Corporate And Umbrella Branding Powerpoint Presentation Slides Brandi...
Communication Channels And Strategies For Shareholder Engagement Powerpoint P...
Communication Channels And Strategies For Shareholder Engagement Powerpoint P...
Responsible Tech Playbook To Leverage Business Ethics Powerpoint Presentation...
Responsible Tech Playbook To Leverage Business Ethics Powerpoint Presentation...
Generating Leads Through Targeted Digital Marketing Campaign Powerpoint Prese...
Generating Leads Through Targeted Digital Marketing Campaign Powerpoint Prese...
Boosting Profits With New And Effective Sales Strategic Plan Powerpoint Prese...
Boosting Profits With New And Effective Sales Strategic Plan Powerpoint Prese...
Methods To Implement Traditional Marketing Powerpoint Presentation Slides Mkt Cd
Methods To Implement Traditional Marketing Powerpoint Presentation Slides Mkt Cd
Comprehensive Guide To Sports Marketing Strategy Powerpoint Presentation Slid...
Comprehensive Guide To Sports Marketing Strategy Powerpoint Presentation Slid...
Global Shift Towards Flexible Working Powerpoint Presentation Slides
Global Shift Towards Flexible Working Powerpoint Presentation Slides
Kürzlich hochgeladen
Falcon stands out as a top-tier P2P Invoice Discounting platform in India, bridging esteemed blue-chip companies and eager investors. Our goal is to transform the investment landscape in India by establishing a comprehensive destination for borrowers and investors with diverse profiles and needs, all while minimizing risk. What sets Falcon apart is the elimination of intermediaries such as commercial banks and depository institutions, allowing investors to enjoy higher yields.Falcon Invoice Discounting: The best investment platform in india for investors
Falcon Invoice Discounting: The best investment platform in india for investorsFalcon Invoice Discounting
Kürzlich hochgeladen (20)
Malegaon Call Girls Service ☎ ️82500–77686 ☎️ Enjoy 24/7 Escort Service
Malegaon Call Girls Service ☎ ️82500–77686 ☎️ Enjoy 24/7 Escort Service
The Path to Product Excellence: Avoiding Common Pitfalls and Enhancing Commun...
The Path to Product Excellence: Avoiding Common Pitfalls and Enhancing Commun...
Quick Doctor In Kuwait +2773`7758`557 Kuwait Doha Qatar Dubai Abu Dhabi Sharj...
Quick Doctor In Kuwait +2773`7758`557 Kuwait Doha Qatar Dubai Abu Dhabi Sharj...
Call Girls Electronic City Just Call 👗 7737669865 👗 Top Class Call Girl Servi...
Call Girls Electronic City Just Call 👗 7737669865 👗 Top Class Call Girl Servi...
Falcon's Invoice Discounting: Your Path to Prosperity
Falcon's Invoice Discounting: Your Path to Prosperity
SEO Case Study: How I Increased SEO Traffic & Ranking by 50-60% in 6 Months
SEO Case Study: How I Increased SEO Traffic & Ranking by 50-60% in 6 Months
Call Girls Hebbal Just Call 👗 7737669865 👗 Top Class Call Girl Service Bangalore
Call Girls Hebbal Just Call 👗 7737669865 👗 Top Class Call Girl Service Bangalore
How to Get Started in Social Media for Art League City
How to Get Started in Social Media for Art League City
Call Girls Service In Old Town Dubai ((0551707352)) Old Town Dubai Call Girl ...
Call Girls Service In Old Town Dubai ((0551707352)) Old Town Dubai Call Girl ...
Whitefield CALL GIRL IN 98274*61493 ❤CALL GIRLS IN ESCORT SERVICE❤CALL GIRL
Whitefield CALL GIRL IN 98274*61493 ❤CALL GIRLS IN ESCORT SERVICE❤CALL GIRL
Call Now ☎️🔝 9332606886🔝 Call Girls ❤ Service In Bhilwara Female Escorts Serv...
Call Now ☎️🔝 9332606886🔝 Call Girls ❤ Service In Bhilwara Female Escorts Serv...
Chandigarh Escorts Service 📞8868886958📞 Just📲 Call Nihal Chandigarh Call Girl...
Chandigarh Escorts Service 📞8868886958📞 Just📲 Call Nihal Chandigarh Call Girl...
FULL ENJOY Call Girls In Mahipalpur Delhi Contact Us 8377877756
FULL ENJOY Call Girls In Mahipalpur Delhi Contact Us 8377877756
Falcon Invoice Discounting: The best investment platform in india for investors
Falcon Invoice Discounting: The best investment platform in india for investors
Business Model Canvas (BMC)- A new venture concept
Business Model Canvas (BMC)- A new venture concept
Call Girls Jp Nagar Just Call 👗 7737669865 👗 Top Class Call Girl Service Bang...
Call Girls Jp Nagar Just Call 👗 7737669865 👗 Top Class Call Girl Service Bang...
Procurement Purchase Orders And Cost Reduction Dashboard
- 1. Procurement Purchase Orders and Cost Reduction… Battery Sensors Other Transitors Display Switches 0 10 20 30 40 50 SAVINGS Battery Sensors Other Transitors Display Switches 0 20 40 60 80 100 AVOIDANCE Cost Saving & Cost Avoidance Cost of Purchase Order 5 Year Trend This Year $ 12.14 Cost Reduction 5 Year Trend This Year $ 12.14 Cost Savings 5 Year Trend This Year $ 12.14 Cost Avoidance 5 Year Trend This Year $ 12.14 Procurement ROI 5 Year Trend This Year $ 12.14 This graph/chart is linked to excel, and changes automatically based on data. Just left click on it and select “Edit Data”. $10 $10 $15 $5 $20 $40 Transitors - $10 Switches - $10 Sensors -$15 Battery - $05 Display - $20 Other -$40 Cost Reduction 0 10 20 30 40 50 60 70 80 90 100 Battery Display Other Sensor Swiches Transitors ROI Benchmark Procurement ROI Costs of Procurement $ 50.414 Top 5 Supplier by Cost Reduction Top Supplier 01 $20.434 Supplier 02 $32.665 Supplier 03 $24.676 Supplier 04 $12.525 Supplier 05 $23.676 Supplier 06 $20.575
- 2. Instructions To Edit This Slide This slide has been made in PowerPoint using basic PowerPoint shapes, and all graphics are 100% editable in PowerPoint. You can change color, size and orientation of any element to your liking, and add/edit any piece of text anywhere.
- 3. All images are 100% editable in PowerPoint Change color, size and orientation of any icon to your liking”
- 4. 1. Select the Graph and right click -> Select "Edit Data" 2. An excel matrix will automatically show up 3. Enter the values based on your requirements and hit enter 4. The Graph/Chart shape will automatically adjust according to your data, and anytime you can go and change the value again Edit Excel-linked Chart This is a Data Driven Chart/Graph and the shape automatically adjusts according to your data 1 2 3
- 5. Edit Color 1. Select the shape to change the color and Right click the object( click any object which you want to change color) 2. Choose Format Data Series in the dialog box. 3. Choose “Fill” in the Format Shape box then “Solid” or “Gradient” depending on the appearance of the object. Change colour as shown in the picture. 1 2 3
- 6. Select From Thousands Of Editable Icons On Every Topic These icons are available at the Icons section on www.slideteam.net