Weitere ähnliche Inhalte
Ähnlich wie NFLX-model.pdf
Ähnlich wie NFLX-model.pdf (20)
Kürzlich hochgeladen (20)
NFLX-model.pdf
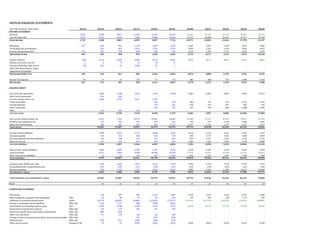
- 1. NETFLIX FINANCIAL STATEMENTS
(all in $m except per share data) 2014A 2015A 2016A 2017A 2018A 2019A 2020E 2021E 2022E 2023E 2024E
x INCOME STATEMENT
Revenue 5,505 6,780 8,831 11,693 15,794 20,156 26,642 32,743 40,299 49,487 60,476
Cost Of Goods Sold 3,753 4,591 6,030 7,660 9,968 12,440 16,271 20,900 26,633 31,517 35,150
Gross Income 1,752 2,188 2,801 4,033 5,827 7,716 10,371 11,842 13,666 17,970 25,327
Marketing 877 824 991 1,278 2,369 2,652 3,463 4,257 5,239 6,433 7,862
Technology and development 651 852 1,053 1,222 1,545 2,051 2,521 3,103 3,810 4,657
General and administrative 472 407 578 864 630 914 1,132 1,392 1,713 2,103 2,570
Operating Income 403 306 380 839 1,605 2,604 3,724 3,673 3,612 5,623 10,238
Interest Expense (50) (133) (150) (238) (421) (626) (850) (873) (882) (861) (886)
Interest and Invest. Income 5 6 8 13 43 77 - - - - -
Currency Exchange Gains (Loss) (8) (37) 23 (128) (1) 7 - - - - -
Other Non-Operating Inc. (Exp.) - - - - - - - - - - -
Impairment of Goodwill - - - - - - - - - - -
Net Income Before Tax 349 142 261 485 1,226 2,062 2,874 2,800 2,729 4,762 9,352
Income Tax Expense 83 19 74 (74) 15 195 603 588 573 1,000 1,964
Net Income 267 123 187 559 1,211 1,867 2,270 2,212 2,156 3,762 7,388
x BALANCE SHEET
Cash and cash equivalents 1,809 1,468 2,823 3,794 5,018 5,283 6,056 6,820 9,404 14,713
Short-term investments 501 266 - - - - - - - -
Current content assets, net 2,906 3,726 4,311 5,151 - - - - - -
Trade receivables - - - 363 454 606 742 915 1,122 1,372
Prepaid expenses - - - 179 181 270 313 397 481 592
Other receivables - - - 207 525 521 746 854 1,088 1,305
Other 215 260 536 - - - - - - -
Current assets 5,432 5,720 7,670 9,694 6,179 6,681 7,857 8,986 12,095 17,983
Non-current content assets, net 4,313 7,275 10,371 14,961 24,505 29,568 34,129 39,592 46,017 53,452
Property and equipment, net 173 250 319 418 565 746 917 1,128 1,386 1,693
Other non-current assets 285 341 652 901 2,727 2,727 2,727 2,727 2,727 2,727
Total assets 10,203 13,587 19,013 25,974 33,976 39,722 45,630 52,434 62,225 75,856
Current content liabilities 2,789 3,633 4,173 4,686 4,414 4,414 4,414 4,414 4,414 4,414
Accounts payable 253 313 360 563 674 855 1,137 1,431 1,688 1,894
Accrued expenses and other liabilities 140 198 315 477 843 879 1,147 1,476 1,726 2,147
Deferred revenue 347 443 619 761 925 1,305 1,561 1,915 2,378 2,888
Current liabilities 3,530 4,587 5,466 6,487 6,856 7,453 8,258 9,235 10,206 11,343
Non-current content liabilities 2,026 2,895 3,330 3,759 3,334 3,334 3,334 3,334 3,334 3,334
Long-term debt 2,371 3,364 6,499 10,360 14,759 17,641 20,551 24,238 29,312 34,612
Other non-current liabilities 52 61 135 129 1,444 1,442 1,422 1,407 1,390 1,196
Total liabilities 7,979 10,907 15,431 20,736 26,394 29,870 33,566 38,214 44,243 50,485
Common stock, $0.001 par value 1,325 1,600 1,871 2,316 2,794 2,794 2,794 2,794 2,794 2,794
Accumulated other comprehensive loss (43) (49) (21) (20) (24) (24) (24) (24) (24) (24)
Retained earnings 942 1,129 1,731 2,942 4,812 7,082 9,294 11,450 15,212 22,600
Stockholders’ equity 2,223 2,680 3,582 5,239 7,582 9,852 12,064 14,220 17,983 25,371
Total liabilities and stockholders’ equity 10,203 13,587 19,013 25,974 33,976 39,722 45,630 52,434 62,225 75,856
Check ok ok ok ok ok ok ok ok ok ok
x CASH FLOW STATEMENT
Net income 123 187 559 1,211 1,867 2,270 2,212 2,156 3,762 7,388
D&A of property, equipment and intangibles D&A 62 58 72 83 104 149 183 226 277 339
Additions to streaming content assets CapEx (5,772) (8,653) (9,806) (13,043) (13,917) (19,212) (22,734) (29,243) (33,831) (38,000)
Change in streaming content liabilities Other Adj. 1,162 1,773 900 1,000 (694) - - - - -
Amortization of streaming content assets D&A 3,405 4,788 6,198 7,532 9,216 14,148 18,174 23,779 27,406 30,565
Stock-based compensation expense Other Adj. 125 174 182 321 405 - - - - -
Excess tax benefits from stock-based compensation Other Adj. (80) (65) - - - - - - - -
Other non-cash items Other Adj. 111 120 118 82 228 - - - - -
Foreign currency remeasurement (gain) loss on long-term debt Other Adj. - - 141 (74) (46) - - - - -
Deferred taxes Other Adj. (59) (47) (209) (86) (94) - - - - -
Other current assets Changes to WC 19 47 (234) (200) (252) (238) (403) (364) (525) (578)
- 2. Accounts payable Changes to WC 52 32 75 199 96 181 282 294 257 206
Accrued expenses and other liabilities Changes to WC 49 69 114 150 158 36 267 329 250 421
Deferred revenue Changes to WC 72 97 178 142 164 380 256 354 464 509
Other non-current assets and liabilities Changes to WC (18) (52) (74) 2 (123) - - - - -
Net cash used in operating activities (749) (1,474) (1,786) (2,680) (2,887) (2,285) (1,763) (2,470) (1,940) 851
Purchases of property and equipment CapEx (91) (108) (173) (174) (253) (330) (354) (437) (534) (646)
Change in other assets CapEx (80) (78) (60) (165) (134) - - - - -
Purchases of short-term investments (372) (187) (75) - - - - - - -
Proceeds from sale of short-term investments 259 282 320 - - - - - - -
Proceeds from maturities of short-term investments 105 140 23 - - - - - - -
Net cash (used in) provided by investing activities (179) 50 34 (339) (387) (330) (354) (437) (534) (646)
Proceeds from issuance of debt 1,500 1,000 3,021 3,962 4,469 2,882 2,910 3,686 5,075 5,300
Debt issuance costs (18) (11) (32) (36) (36) - - - - -
Proceeds from issuance of common stock 78 37 88 125 72 - - - - -
Excess tax benefits from stock-based compensation 80 65 - - - - - - - -
Other financing activities (1) 0 0 (2) - (2.5) (20.1) (14.6) (16.9) (194.5)
Net cash provided by financing activities 1,640 1,092 3,077 4,049 4,506 2,879 2,890 3,672 5,058 5,105
Effect of exchange rate changes on cash, cash equivalents and restricted cash (16) (9) 30 (40) 0 0 0 0 0 0
Net increase (decrease) in cash, cash equivalents and restricted cash 696 (342) 1,355 989 1,232 264 773 764 2,584 5,310
Cash, cash equivalents and restricted cash, beginning of year 1,114 1,809 1,468 2,823 3,812 5,044 5,308 6,081 6,846 9,429
x Cash, cash equivalents and restricted cash, end of year 1,809 1,468 2,823 3,812 5,044 5,308 6,081 6,846 9,429 14,739
Restricted cash 0 0 0 18 25 25 25 25 25 25
x Cash & Cash equivalents, end of year 1,809 1,468 2,823 3,794 5,018 5,283 6,056 6,820 9,404 14,713