Empfohlen

Empfohlen
Weitere ähnliche Inhalte
Was ist angesagt?
Was ist angesagt? (20)
Andere mochten auch
Andere mochten auch (16)
Ähnlich wie Accounting for Wetlands Loss in a Changing Climate in the Estimation of Long-term Flood Risks of Devils Lake in North Dakota
Ähnlich wie Accounting for Wetlands Loss in a Changing Climate in the Estimation of Long-term Flood Risks of Devils Lake in North Dakota (20)
Kürzlich hochgeladen
Kürzlich hochgeladen (20)
Accounting for Wetlands Loss in a Changing Climate in the Estimation of Long-term Flood Risks of Devils Lake in North Dakota
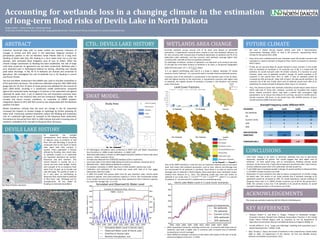
- 1. Accounting for wetlands loss in a changing climate in the estimation of long-term flood risks of Devils Lake in North Dakota Sergey Gulbin1 , Andrei Kirilenko2, Xiaodong Zhang1 1University of North Dakota, Grand Forks ND; sergey.gulbin@und.edu, 2University of Florida, Gainesville, FL; andrei.kirilenko@ufl.edu ABSTRACT Endorheic (terminal) lakes with no water outlets are sensitive indicators of changes in climate and land cover in the watershed. Regional variation in precipitation pattern in the US Northern Great Plaines lead to a long term flooding of Devils Lake (DL), ND, leading to a 10-m water level rise in just two decades, with estimated flood mitigation costs of over $1 billion. While the climate change contribution to flooding has been established, the role of large scale land conversion to agriculture has not been researched. Wetlands play a very important part in hydrological balance by storing, absorbing and slowing peak water discharge. In ND, 49 % of wetlands are drained and converted to agriculture. We investigated the role of wetlands loss in DL flooding in current and future climate. The Soil and Water Assessment Tool (SWAT) was used to simulate streamflow in all DL watershed sub-basins. The model was calibrated using the 1991-2000 USGS gauge data for the first 10 years of study period and validated for the second 10 years (2001-2010), resulting in a satisfactory model performance compared against the measured water discharge in 8 streams in the watershed and against observed DL water level. A set of wetland loss and restoration scenarios were created based on the historical data and the Compound Topographic Index. To emulate the future climate conditions, an ensemble of CMIP5 weather integrations based on IPCC AR5 RCP scenarios was downscaled with the MarkSim weather simulator. Model simulations indicate that the land use change in the DL watershed increased the impacts of climate change on hydrology by further elevating DL water level. Conversely, wetland restoration reduce the flooding and moderates risks of a potential high-impact DL overspill to the Sheyenne River watershed. Simulations for the period from 2011 to 2040 indicate that with increasing area of wetlands, probability of DL overspill to Sheyenne River decreases. SWAT MODEL • We used 17 Global Climate Models (GCM), each with 4 Representative Concentration Pathways (RCP), so total is 68 scenarios, representing future climate for the period 2011-2040. • Every land cover model(scenario) was simulated under 68 climate scenarios and evaluated on natural overspill to Sheyenne River, which correspond to elevation 444.4 meters. • Finally, we can say how likely DL would overspill in every scenario. In the model with no wetlands DL overflows in 54 scenarios out of 68, in a model with 5% wetlands, DL would overspill under 40 climate scenario. In a business as usual scenario, when area of wetlands wouldn’t change, DL would overflow in 29 scenarios in the period from 2011 to 2040. If area of wetlands would be increased by 50% and would make 16% of basin, the lake would overflow in 20 scenarios out of 68, and, finally, when area of wetlands would reach 20% of DL watershed, DL would overspill to Sheyenne River only in 11 scenarios. • Thus, this research proves that wetlands restoration would reduce water level in Devils Lake and it’s flood risks. However, currently we simulated only original future climate scenarios, which may have a period with consequent high precipitation, so to reduce the influence of such bias, we plan to shuffle years in climate scenarios 100 times, so we would have 100 shuffled versions of each climate scenario (6,800 scenarios total). DEVILS LAKE HISTORY RMSE = 0.22 m Currently wetlands occupy around 11% of DL basin area (based on NLCD2006 estimation), 4 hypothetical scenarios were created to test how wetlands influence on DL: two scenarios with reduced area of wetlands (absolutely no wetlands and 5% of DL watershed under wetlands), and two scenarios with wetlands coverage higher than currently (16% and 20% of basin occupied by wetlands). For hydrologic simulation, location of wetlands is as important as its amount and area. To simulate the most likely location of wetlands in DL basin, a Compound Topographic Index (CTI) was used: 𝐶𝑇𝐼 = 𝑙𝑛 𝛼 𝑡𝑎𝑛𝛽 , where α is an upland contributing area and β is a slope in radians. Basically, CTI shows measure of area “wetness”. It is commonly used to recreate historical wetlands location. WETLANDS AREA CHANGE • All hydrological simulations were conducted in SWAT (Soil and Water Assessment Tool; Arnold et al., 1998), model calibration – in SWAT_CUP • Watershed delineation is based on DEM (Digital Elevation Model) of Devils Lake basin (source – USGS; resolution 30 m) • Soil data was obtained from STATSGO2 database (250 m resolution) • Land cover data is from NLCD 2006 (National Land Cover Dataset; resolution 30 m) • Wetlands data - NWI2 (National Wetlands Inventory) • For weather simulation in SWAT, data from 4 USDA weather stations was used • Calibration and validation of the model was made with help of 8 river gages observation data from USGS • In 2007 first outlet that pumps water from DL was launched. Later, second outlet started to operate, their total maximum capacity is 17m3/s. We incorporated outlets in our model, but since the real outlet has never operated on their maximum capacity, we used their average rate: 11.2 m3/s http://earthobservatory.nasa.gov/IOTD/view.php?id=42624 http://earthobservatory.nasa.gov/IOTD/view.php?id=42624 • After comparing 5 scenarios, including current one, in scenarios with lower area of wetlands, Lake level is higher than in scenarios with increased area of wetlands (comparing to current coverage) • Mean difference between scenarios is 0.44 meters with lowest at the start of study period and highest at the end – in 2010. 0.00% 10.00% 20.00% 30.00% 40.00% 50.00% 60.00% 70.00% 80.00% Open Water Developed Deciduous Forest Grassland/Herbaceous Pasture/Hay Cultivated Crops Herbaceous Wetlands Area,% No wetlands 5% wetlands Current 16% wetlands 20% wetlands SCENARIO rcp26 rcp45 rcp60 rcp85 No wetlands 15 15 10 14 5% 9 10 9 12 Current (11%) 4 8 7 10 16% 2 6 4 8 20% 1 4 2 4 PRECIPITATION (MM/DAY) 1.57 1.58 1.55 1.60 TEMPERATURE C 4.08 4.10 3.88 4.19 DL expansion has multiple consequences, from obvious flooding of adjacent areas to pollution of Red River and Lake Winnipeg. It should be mentioned that to the South of Devils Lake, Spirit Lake tribe territory is located. Tribe’s population is directly affected by flooding. Also, Devils Lake, as wetlands located in its watershed are important attractions for hunters, fishermen and bird watchers. This natural disaster is causing loss to a county and even state budget. Finally, with overspill of DL to Sheyenne River water from DL goes up to Canada and Lake Winnipeg. The quality of water in DL is very poor, so overflowing to Sheyenne River would lead to pollution of Red River, Lake Winnipeg and its eutrophication. All this makes DL flooding an international problem. Currently, most of the wetlands is concentrated in the Southern part of the DL basin, with the highest density on the South-East. In hypothetical scenarios with higher area of wetlands, the highest density of wetlands is located in the Northern and Central parts of the basin. One of the SWAT limitations is that this tool can represent wetlands only on sub-basin level, that means that wetlands parameters, such as area, volume and drainage area are summarized for all wetlands in sub-basin. Since there is no data on volume and drainage area of wetlands in North Dakota, these parameters were calculated using a method from Gleason et al., 2011. The following model was used and tested on wetlands in our study area: V = 0.25𝐴1.4742 ; 𝑈𝐴 = 2.24𝐴0.4647 , where 𝑉 is a volume of wetland, 𝐴 – its area and 𝑈𝐴 is upland area (or contributing area). ACKNOWLEDGEMENTS This study was partially funded by NSF RII EPSCoR (1355466) grant KEY REFERENCES • Gleason, Robert A., and Brian A. Tangen. "Chapter D: floodwater storage." Ecosystem Services Derived from Wetland Conservation Practices in the United States Prairie Pothole Region with an Emphasis on the US Department of Agriculture Conservation Reserve and Wetlands Reserve Programs (2008): 31. • Arnold, Jeffrey G., et al. "Large area hydrologic modeling and assessment part I: Model development1." (1998): 73-89. • Dahl, Thomas E. Status and trends of wetlands in the conterminous United States 2004 to 2009. US Department of the Interior, US Fish and Wildlife Service, Fisheries and Habitat Conservation, 2011. Overspill Frequency under Different RCPs CTD.: DEVILS LAKE HISTORY CONCLUSIONS • Land cover change in DL basin, in particular, wetlands loss due to agricultural expansion, impacted DL system. Our results suggest that with higher area of wetlands, DL level would drop, and as consequence, flooding severity would decrease. At the same time, if agricultural expansion would have been more intense, and less wetlands would exist in DL watershed, the lake would rise. • If until 2040 area of wetlands wouldn’t change, DL would overflow to Sheyenne River in 29 CMIP5 climate scenarios out of 68. • Restoration of some wetlands may help to reduce consequences of climate change for Devils Lake. The results of our study indicate that if wetlands coverage in DL watershed would be increased to 20%, DL would experience natural overflow to Sheyenne River only in 11 CMIP5 climate scenarios out of 68 for the period 2011- 2040. The contrary is also true: if all wetlands in DL would be drained, DL would overspill to Sheyenne River in 54 scenarios out of 68. FUTURE CLIMATE Acquired August 11, 1984 Red River & Devils Lake Basin Acquired September 1, 2009 Study Area Simulated and Observed DL Water Level Land Cover Fractions