1. 1
PERFORMANCE ANALYSIS OF TCP VARIANT
Shubham Singh Sanchit Rathi
Northeastern University Northeastern University
360 Huntington Ave., Boston, MA 02115 360 Huntington Ave., Boston, MA 02115
EMAIL: singh.sh@husky.neu.edu EMAIL: rathi.sa@husky.neu.edu
Abstract: The Transmission Control Protocol (TCP)
was developed to provide end to end reliable
communication over the network. In this paper we
have studied the in-depth performance and
characteristic of different TCP variants viz. Tahoe,
Reno, New Reno and Vegas. In order to test the
functionality of the TCP variants we have used NS-2
environment and the obtained values are used to
determine the performance of the TCP variant in terms
of throughput, drop-rate and latency under different
parameters. Performance of TCP Reno and TCP Sack
for queuing mechanism such as Drop Tail and RED
have also been studied.
I.INTRODUCTION
TCP is a transport layer protocol which was designed to
provide reliable delivery of packets. With ever growing
network traffic over the network, performance of TCP was
hugely affected due to congestion of data traffic over the
network. In order to overcome this problem of congestion
and enhance TCP performance congestion control
mechanism was formulated. Different variants of TCP
were developed to achieve better performance. Few of
TCP variants are discussed below:
TCP TAHOE:
Tahoe is one of the first and simplest TCP variant out of
the four. It is based on the go-back-n model and works on
cumulative acknowledgement with timer value set. TCP
Tahoe has 3 stages viz. slow start, congestion avoidance
and fast retransmit. In slow start mode Tahoe starts the
window size as 1 and for every RTT it increases the
window size following geometric progression. After, it
crosses the threshold level it enters congestion avoidance
mode and increases the window size by one for every RTT.
At congestion avoidance, whenever triple duplicate
acknowledgement or timeout occurs it performs fast
retransmit and enters fast retransmit. It does not have fast
recovery mode i.e. whenever it encounters a timeout or
triple duplicate acknowledgement, it slashes the congestion
window to one.
TCP RENO:
The main difference between Tahoe and Reno is that Reno
has additional fast recovery mechanism i.e. whenever a
triple duplicate acknowledgement occurs it performs fast
retransmit and fast recovery, it does not wait till the timer
expires. Whenever a triple acknowledgement is received, it
reduces the window size to half of that maximum value
and it enters congestion avoidance mode. While when it
experiences a timeout it reduces the threshold value to half
of the maximum window size and enters the slow start
mode. Reno can only handle only one packet drop but
when multiple packet drop occurs it suffers from
performance problem.
TCP NEW RENO:
In order to overcome the problem of multiple packet drop
in same window New Reno has been developed. Until all
the ACK for all the packets in the window are received
New Reno does not comes out of fast recovery.
VEGAS:
Vegas in order to avoid congestion makes use to packet
delay as a signal to determine at what rate the packet
should be send. It detects congestion at early stage by
increasing the Round Trip-Time of the packet unlike other
variants of TCP which detect congestion only after a
packet loss has taken place.
SACK:
In SACK selective acknowledgements are done rather than
cumulative acknowledgement. With selective
acknowledgements receiver informs sender which all
packets have arrived successfully. So the sender only needs
to send only those packets which has been lost.
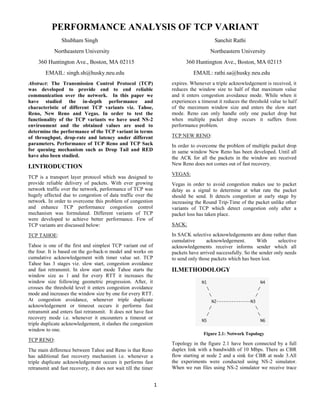
II.METHODOLOGY
Figure 2.1: Network Topology
Topology in the figure 2.1 have been connected by a full
duplex link with a bandwidth of 10 Mbps. There as CBR
flow starting at node 2 and a sink for CBR at node 3.All
the experiments were conducted using NS-2 simulator.
When we run files using NS-2 simulator we receive trace
2. 2
files then we use a python script to parse the data from the
trace files. The output of trace file have been saved to a file
and then we use Excel to plot the graph for various
conditions.
EXPERIMENT 1:
In this experiment we have analyzed performance of TCP
variants like Tahoe, Reno, Vegas and NewReno under
different conditions. Only one single TCP flow is set with
its source at node 1 and sink at node 4. We have varied the
CBR rate from 1Mbps to 10Mbps. The performance of
TCP variants are analyzed by varying the duration of TCP
and CBR flow.
The following conditions were analyzed:
1. Start TCP flow and CBR flow at the same time
and end TCP flow and CBR flow at the
Same time.
2. Start TCP flow after CBR flow is stable.
3. Start CBR flow after TCP flow is stable.
4. Start TCP flow and CBR flow at the same time
and end CBR flow before TCP flow
5. Start TCP flow and CBR flow at different time
and Stop TCP flow before CBR flow.
The performance of variants are analyzed by calculating
the following:
Latency: The latency of packets are calculated by
calculating the total round trip time taken by the packet to
reach the receiver and its corresponding acknowledgement
to travel back to the sender. Thus latency is the overall
delay the packets experience.
Drop-rate: Drop-rate is a parameter that is a ratio of
dropped packet over the total number of packets sent from
the source.
Throughput: Throughput is defined as total number of
packets that are received at the receiver for entire period of
time.
In order to comment on overall performance of a variant
under different conditions. To do so we calculate the
following,
1. Mean: The mean value is calculated for the
values obtained under different test conditions.
Based on the mean value an inference is drawn.
2. Variance: Variance is calculated to test the
stability of the TCP variant under varying
conditions.
3. T-Test: T-Test takes into account the mean and
variance between two sets of values achieved and
thus we have used it to compare the performance
between two variants.
EXPERIMENT 2:
This experiment tests the amount of fair usage of resources
if two TCP flows have the same resources available.
Different combinations of TCP variants that are used are
Reno/Reno, NewReno/Reno, Vegas/Vegas and
NewReno/Vegas. One TCP flow has its source at node 1
and its sink at node 4 and another TCP flow has its source
at node 5 and sink at node 6. The CBR rate is increased
from 1 Mbps to 10 Mbps at an interval of 1Mbps.
EXPERIMENT 3:
This experiment we demonstrate the effect of queuing
algorithms over the performance of TCP variants. The
queuing algorithm used in this experiment are Drop tail
and Random Early Detection (RED). The CBR rate in this
experiment is fixed at 10 Mbps and its packets start
flowing after 5 seconds.
III.TCP PERFORMANCE UNDER
CONGESTION:
To test the performance of TCP under congestion, graph
for throughput, drop-rate and latency have been plotted. To
check the consistency in performance of the TCP variant,
its performance is tested under different condition and its
result are analyzed as follows:
a)Throughput:
Throughput of TCP variants are calculated over different
time intervals mentioned in the methodology section and
based on different results obtained under different
conditions, we calculated:
1. Mean: For different time intervals, Mean of
output is calculated for the TCP variant by
increasing the CBR rate by an interval 1Mbps.
2. Variance: For different time intervals, the value of
variance signifies how far is every value in the set
from the mean of different output calculated
above.
3. Standard deviation: Standard Deviation is
calculated to measure the deviation of output at
different scenarios from the mean value.
FIGURE 3.1: STANDARD DEVIATION OF
VARIANTS
0
0.2
0.4
1 2 3 4 5 6 7 8 9 10
Standarddeviation
CBR (Mbps)
S.D. Tahoe S.D. vegas S.D. reno S.D.new reno
3. 3
As seen from 3.1 the standard deviation for Vegas
is lowest as compared to standard deviation of
Tahoe, Reno and New Reno.
4. T-test: T-test was performed to determine which
variant offers maximum stability in different
conditions. Based on the result of T-test, the
following results were drawn:
T-test values for the scenario where CBR and TCP flow
start at the same time are as follows:
Vegas over Reno: 0.327162
Vegas over Tahoe:0.3605155
Vegas over New Reno:0.3651155
FIGURE 3.2: ERROR PLOT
From the calculated T-test values we see that Vegas has
better T-test values over other Tahoe, Reno and New Reno.
As seen from figure 3.2 an error plot of all the variants is
plotted for different intervals of time on same CBR values.
FIGURE 3.3: THROUGHPUT VS CBR FOR TCP
VARIANT
As seen in figure 3.3, when the CBR rate is low and there
is no network congestion, Tahoe, Reno, New Reno have
higher throughput as compared to Vegas but as CBR rate
increases throughput of Vegas is higher than that of Tahoe,
Reno and New Reno. In case of Tahoe, as the CBR rate
increases, for every packet drop, throughput decreases
because Tahoe enters slow start mode and reduces the size
of congestion window to 1 and again enters slow start
mode. Unless all the acknowledgments have successfully
been received the congestion window does not increase. In
case of Reno three duplicate acknowledgements triggers
retransmission while in case of NewReno every duplicate
acknowledgements triggers retransmission thus NewReno
has better throughput than Reno.
FIGURE 3.4: DROP RATES VS CBR FOR TCP VARIANT
As seen from figure 3.4, when the CBR traffic is low the
packet drops are low for all variants. But as the CBR traffic
increases Tahoe, Reno, NewReno have higher throughput
as compared to Vegas. Vegas calculates the congestion in
network depending on round trip delay time of its packets.
Vegas detects congestion by comparing the RTT of the
packets it send with the base RTT. As the CBR rate
increases, the round trip delay time of packets increase and
thus Vegas reduces its rate of packet transmission. Thus
the drop-rate of TCP Vegas is lowest, as it injects less
packets in the network when it experiences congestion in
the network. While Tahoe, Reno and New Reno detect the
congestion in the network by detecting loss of packets or
by experiencing duplicate acknowledgements which are
received when packet is received out of order. Hence
Tahoe, Reno and New Reno have higher drop-rates as they
function on Additive Increase and Multiplicative Decrease
until they experience packet drops.
FIGURE 3.5: LATENCY VS CBR FOR TCP VARIANT
0
1
2
3
1 2 3 4 5 6 7 8 9 10
THROUGHPUT(Mbps)
CBR (Mbps)
NewReno Vegas Reno Tahoe
0
0.5
1
1.5
2
2.5
3
1 3 5 7 9
Throughput(Mbps)
CBR (Mbps)
VEGAS TAHOE RENO NEWRENO
0
0.01
0.02
0.03
0.04
0.05
0.06
0.07
1 3 5 7 9
DropRates
CBR (Mbps)
TAHOE VEGAS RENO NEWRENO
0
0.02
0.04
0.06
0.08
0.1
0.12
1 2 3 4 5 6 7 8 9 10
Latency(s)
CBR (Mbps)
TAHOE VEGAS RENO NEWRENO
4. 4
As seen from figure 3.5, when there is no congestion in the
network the average latency of TCP Tahoe, Reno, New
Reno and Vegas is similar. But as the congestion increases,
the average latency of Vegas is least because as soon as
Vegas detects congestion it will queue very small number
of packets based on estimated RTT thus Vegas has least
latency. Tahoe uses GO BACK_N window technique.
Packet loss can only be detected when the timer expires.
Thus if large number of packets have to be retransmitted if
there is a packet loss therefore this lead to large delays. In
case of NewReno, in order to detect multiple loss in a
window it takes one RTT for every loss. This increases
queuing delay and leads to high losses.
Based on the results of following four parameters, we
successfully were able to conclude that performance of
TCP Vegas under different conditions was better than
performance of other variants. TCP Vegas had highest
throughput and also had the least standard deviation value
and high T-test values over other variants making it the
best TCP variant.
IV.FAIRNESS BETWEEN DIFFERENT
TCP VARIANTS
We carry out this experiment to demonstrate the amount of
fairness that different variants offer each other when
flowing through the same network.
As shown in the figure 4.1, if both TCP flows are Vegas,
both TCP are fair to each other in terms of throughput. The
reason TCP Vegas offers fairness to other TCP Vegas is
due to the same congestion control mechanism that
changes the congestion window depending on the total
round trip time. Thus if first TCP Vegas encounters
congestion in the network it reduces the rate of packet
transmission and allows other TCP Vegas a wider
bandwidth. Similarly, when the second TCP flow
encounters congestion in the network it reduces its
congestion window thus transmitting less packet and
allowing the first TCP flow wider bandwidth.
FIGURE4.1: THROUGHPUT VS CBR FOR VEGAS /
VEGAS
Similarly, if both TCP flows are TCP Reno, both TCP
flows offer good fairness to each other calculated in terms
of drop rate, throughput and latency as both TCP flows
rely on same congestion control mechanism.
As shown in the figure 4.2, both the TCP flows have
similar values of throughput depending on the CBR values.
As the congestion is encountered in the network
throughput of flows decreases together.
FIGURE 4.2: THROUGHPUT VS CBR FOR RENO / RENO
As shown in figure 4.3, until a congestion is encountered in
the network the drop-rate is a very minute value for both
the TCP flows. But as the congestion in the network
increases, drop-rate of both TCP flows increases together
as both TCP flows are fair to each other.
FIGURE 4.3: DROP RATE VS CBR FOR RENO / RENO
Now when we analyze the performance of NewReno on
the same network along with Reno. As shown in the figure
4.4, NewReno does not provide great fairness to Reno and
always has higher throughput then Reno. The reason New
Reno has higher throughput is because New Reno does not
exit the fast recovery mode until it receives the
acknowledgements the packets in the window. While Reno
immediately exits the fast recovery mode upon receiving
the duplicate triple acknowledgements or experiencing the
timeout.
0
0.5
1
1.5
2
2.5
1 3 5 7 9
Throughput(Mbps)
CBR (Mbps)
VEGAS VEGAS
0
0.5
1
1.5
2
2.5
1 3 5 7 9
Throughput(Mbps)
CBR (Mbps)
RENO RENO
0
0.02
0.04
0.06
0.08
0.1
0.12
0.14
1 3 5 7 9
DropRate
CBR (Mbps)
RENO RENO
5. 5
FIGURE 4.4: THROUGHPUT VS CBR FOR NEWRENO /
RENO
.As shown in figure 4.5, the drop-rate of Reno and New
Reno is similar until congestion in the network does not
occur. As the congestion occurs Reno has higher drop-rate
than New Reno. The reason New Reno has higher
throughput and lower drop-rate is due to its ability to
handle multiple packet losses.
FIGURE 4.5: DROPRATE VS CBR FOR NEWRENO /
RENO
As shown in figure 4.6, where New Reno is provided as
one TCP flow and Vegas as another TCP flow, New Reno
does not provide fairness to Vegas. The reason for this
unfair behavior is difference in congestion avoidance
mechanism of the two variant. As Vegas reduces its
window after the occurrence of congestion, New Reno gets
higher share of bandwidth and thus better throughput.
FIGURE 4.6: THROUGHPUT VS CBR FOR NEWRENO /
VEGAS
As shown from the figure 4.7, latency of Vegas increases
after the beginning of CBR flow and when CBR rate is set
to the bandwidth, Vegas encounters maximum congestion
and thus its round trip time increases exponentially to a
higher value.
FIGURE 4.7: LATENCY VS CBR FOR NEWRENO /
VEGAS
V.INFLUENCE OF QUEUING
In this experiment we analyze the effect of queuing
algorithm like Drop Tail and Random Error Detection
(RED) on TCP Reno and TCP Sack. Drop Tail is a
queuing algorithm that does not differentiates in the
incoming data traffic and fills the buffer to its full capacity.
After the buffer is full, it starts dropping the packets at the
end of this buffer and the sender enters slow start mode by
reducing the congestion window. On the other hand,
Random Error Detection differentiates from its incoming
traffic and based on the probability the traffic gets dropped.
Thus RED is efficient in countering the problem of bursty
data traffic. As seen from the figure 5.1, the throughput of
Reno Drop Tail and Sack Drop Tail reaches maximum and
is maintained high until a burst of data traffic in terms of
CBR arrives in the network and fills up the buffer. Thus
from figure below we can conclude that RED differentiates
amongst its traffic and we get small peaks of throughputs
for TCP flows
FIGURE 5.1: THROUGHPUT FOR DIFFERENT
QUEUING MECHANISM
0
1
2
3
1 3 5 7 9
Throughput(Mbps)
CBR (Mbps)
NEWRENO RENO
0
0.02
0.04
0.06
0.08
0.1
0.12
0.14
1 3 5 7 9
Droprate
CBR (Mbps)
NEWRENO RENO
0
1
2
3
1 3 5 7 9
Throughput(Mbps)
CBR (Mbps)
NEWRENO VEGAS
0
0.05
0.1
0.15
0.2
0.25
0.3
1 3 5 7 9
Latency(s)
CBR (Mbps)
NEWRENO VEGAS
0
0.5
1
1.5
2
2.5
3
0 1 2 3 4 5 6 7 8 9
Throughput(Mbps)
Time (sec)
Reno RED
SACK RED
SACK
DropTail
6. 6
As shown in figure 5.1, using Drop Tail queuing algorithm
we achieve highest throughput peak earliest when there is
no congestion but performance of TCP using RED
algorithm during congestion in the network is better.
Queuing algorithm also affects the latency of TCP variants.
The RED algorithm has smaller latency as compared to
Drop Tail algorithm as it saves the packet in queue buffer
in a probabilistic manner.
The CBR flow is a burst of data that does not take into
consideration the congestion control mechanism. As seen
from our experiment, until the CBR flow is introduced in
the network, throughput of TCP flow goes on increasing
until a maximum limit and after the CBR flow is
introduced in the network, throughput drops.
From the calculated values of throughput and latency,
SACK RED is a good option as compared to Drop Tail
queuing algorithm as we achieve higher throughput and
lower latency even in a congested network.
VI.CONCLUSION
Thus we have analyzed the performance of TCP variants
under three experiments against varying conditions.
Based on our observation of section III, we can conclude
that 500 bytes, TCP packet size 1000 bytes and congestion
window set to 20 the performance for TCP Vegas is better
than other variants. Vegas gives highest throughput, lowest
latency and lowest drop-rate when the congestion in the
network increases. Different TCP variants perform better
under different conditions. For default conditions with
CBR packet size. Vegas has lowest standard deviation and
variance value while it had highest t-test value over other
variants which help us conclude it is more stable over other
variant.
In section IV, while testing fairness between TCP variants
we conclude that variants employing similar congestion
control mechanism provide more fairness to each other.
For example, Reno/Reno and Vegas/Vegas provided high
fairness to each other. On the other hand TCP variants
employing different congestion control mechanism are not
fair to each other. For example New Reno is not fair to
Vegas and New Reno is not fair to Reno.
In section V, we studied the effect of queuing algorithm
over the performance of TCP variant. From this
experiment we concluded that depending on the queuing
algorithm employed by the TCP variant, the same TCP
variant can have different throughput and latency after
injection of bursty data traffic in the network.
VII.REFERENCES
1) http://www.princeton.edu/~chiangm/ele539l6.pdf
2) https://www.isoc.org/inet2000/cdproceedings/2d/2d
_2.htm
3) http://ee.lbl.gov/papers/sacks.pdf