
Empfohlen
Empfohlen
Weitere ähnliche Inhalte
Was ist angesagt?
Was ist angesagt? (20)
Ähnlich wie Jairo epidemiologia n. aberrans
Ähnlich wie Jairo epidemiologia n. aberrans (20)
Mehr von SINAVEF_LAB
Mehr von SINAVEF_LAB (20)
Kürzlich hochgeladen
Kürzlich hochgeladen (20)
Jairo epidemiologia n. aberrans
- 1. Nematology, 2006, Vol. 8(5), 727-737 Epidemiology and integrated control of Nacobbus aberrans on tomato in Mexico Jairo CRISTÓBAL-ALEJO 1, Gustavo MORA-AGUILERA 2, Rosa H. MANZANILLA-LÓPEZ 3,∗, Nahúm MARBÁN-MÉNDOZA 4, Prometeo SÁNCHEZ-GARCIA 5, Ignacio CID DEL PRADO-VERA 2 and Ken EVANS 3 1 Instituto Tecnológico de Conkal, Km 16.3 Antigua Carretera Mérida-Motul, Conkal, Yucatán, CP 97345, México 2 Programa de Fitosanidad, Colegio de Postgraduados, Km 36.5 Carretera México-Texcoco, Montecillos, Edo. Méx. C.P. 56230, México 3 Plant-Pathogen Interactions Division, Rothamsted Research, Harpenden, Herts AL5 2JQ, UK 4 Dpto. de Parasitología Agrícola, Universidad Autónoma Chapingo, Edo. Méx. C.P. 56230, México 5 Programa de Edafología, Colegio de Postgraduados, Km 36.5 Carretera México-Texcoco, Edo. Méx. C.P. 56230, México Received: 7 January 2005; revised: 18 July 2006 Accepted for publication: 18 July 2006 Summary – Population densities, population fluctuations, yield loss and disease incidence caused by Nacobbus aberrans on tomato (Lycopersicon esculentum) were studied, using an epidemiological approach, in a field experiment that included three different control regimes: an integrated control (IC) scheme, which included fertilisation, nematicide (ethoprop) and chicken manure; a technical control (TC) scheme, based on the best local practices of fertilisation and use of carbofuran for nematode control; and a check treatment (AC), with no application of fertilisers or nematicide. At least three generations of N. aberrans occurred through the cropping season and the numbers of galls/plant and females/g of root through the crop season were used to define the area under a disease progress curve (AUDPC). The variables b−1 (Weibull’s apparent infection rate), AUDPC and Yf (final disease incidence) indicated less crop damage under the IC scheme than under the other two schemes (TC and AC). The IC scheme resulted in increased plant height (41-49%), foliage dry weight (37-53%) and stem diameter (31-41%) compared with the TC and AC schemes. Tomato yields in IC surpassed those from TC and AC by 34 and 83%, respectively, while TC exceeded AC by 73%. The yield loss attributed to N. aberrans was 12, 29 and 83% in IC, TC and AC, respectively. The IC scheme improved commercial production by 20 and 81% in comparison to the TC and AC schemes. This was largely due to effective control of the initial inoculum density, which affects the first generation of the nematode population; control of this generation is essential for avoidance of yield loss. The first generation is completed during the period 0-60 dat (days after transplanting), i.e., during the critical stages of flowering, fruit initiation and fruit set (40, 50 and 60 dat). Data on plant performance taken every 10 days were used to derive a multiple point model for calculation of production loss. Keywords – disease progress curve, epidemiology, integrated control, yield loss. In Mexico, tomato exports, valued at more than 310 million US dollars (Anon., 2000), are an important source of foreign income. Most tomato and vegetable production is used for local consumption but, because of their rela- tively high value in Mexican markets, small farmers prefer to grow tomatoes as cash crops. Galling of the root system by the ‘false root-knot nematode’, Nacobbus aberrans (Thorne, 1935) Thorne & Allen, 1944, is one of the most limiting diseases for tomato production in Mexico (Cruz et al., 1987). This disease reaches extreme importance ∗ Corresponding author, e-mail: rosa.manzanilla-lopez@bbsrc.ac.uk on the crop in the municipality of Tecamachalco (Puebla, Mexico), where the nematode can cause 50-100% yield loss (Zamudio, 1987). As a result, crops can be abandoned as unprofitable and the contaminated land remains unsuit- able for growing tomatoes for some years. Nacobbus aberrans has spread over most of the arable land of the municipality of Tecamachalco (ca 300 ha are badly infested), and the need of local farmers to main- tain production, and thereby income, by using new ar- eas of land means that there is a constant threat of its © Koninklijke Brill NV, Leiden, 2006 727 Also available online - www.brill.nl/nemy
- 2. J. Cristóbal-Alejo et al. further dissemination. Not knowing how to treat the dis- ease, farmers often make improper use of nematicides or other pesticides. Previous attempts have been made lo- cally to control this disease on tomato, chilli pepper (Cap- sicum annuum L.), and beans (Phaseolus vulgaris L.), using nematicides, genetic resistance, manures, solarisa- tion, and organic amendments (Zamudio, 1987; Silva, 1989; Gómez, 1991; Cid del Prado et al., 1997; Cristóbal- Alejo et al., 2001a; Yáñez-Juárez et al., 2001; Franco- Navarro et al., 2002). However, no specific guidelines are available and the problem of controlling the nema- tode has not been resolved. This is due partly to a lack of basic local information about the biology of the nema- tode, such as its population dynamics, ecology and epi- demiology. Therefore, a study was made to investigate the population densities and population fluctuations of N. aberrans, the incidence of the disease that it causes, and its effects on tomato, Lycopersicon esculentum Mill., cv. Rio Grande, vigour and yield in field conditions when ap- plying three different control schemes: integrated control (IC, including fertilisation, nematicide and chicken ma- nure), technical control (TC, based on local practices), and a check treatment (AC, with no application of fer- tiliser, nematicides or chicken manure). The study was intended to identify the best control scheme, and to im- prove the measures taken locally against the nematode, as well as improving our understanding of the dynam- ics of the relationship between the nematode and the crop. Materials and methods ESTABLISHMENT OF THE EXPERIMENT The experimental area (Tecamachalco, Mexico) is lo- cated at latitude 18◦ 53 32 north and longitude 97◦ 44 22 west, at an elevation of 2012 m above sea level. Local conditions include minimum and maximum average tem- peratures of 3.5 and 29.5◦ C, and an average annual pre- cipitation of 606 mm. The experiment was made on 1 ha of land, naturally infested with N. aberrans, during the spring-summer season of 1999. The soil consisted of 48.8% sand, 22.0% silt and 29.24% clay, pH 7.5 and or- ganic matter content 1.21%. The land was prepared for planting the tomato crop by harrowing twice at right an- gles, followed by ploughing, to even out distribution of the nematode in the area occupied by the experiment. In or- der to assess the spatial distribution of the nematode, soil samples were taken to a depth of 20 cm in a systematic zigzag pattern of ten cores (200-300 g each) from each of a total of 12 plots of 6 × 12 m, thus providing a bulk sample of ca 3 kg of soil per plot (McSorley, 1987). The initial population density of N. aberrans in each plot was estimated in a bio-assay. For this, two 1-month-old tomato seedlings (cv. Rio Grande) were transplanted into 20 cm diam. plastic pots filled with 2.5 kg of soil. After 45 days, the plants were washed free of soil and the number of galls on each counted. The number of galls ranged from 23 to 33 per plant, with no significant differences between ex- perimental units (Tukey, P = 0.05). Thus, the distribution of the inoculum in the soil was considered to be accept- ably uniform. A second set of samples, taken in the same way as the first but to a depth of 30 cm, allowed a soil physico-chemical analysis to be made and the optimum nutrient application required for the crop to reach a poten- tial production of 30 tonnes ha−1 to be calculated (Etchev- ers et al., 1994). From this analysis, the fertilisation for- mula 210-88-00 (kg ha−1 N, P, K) was determined. The nitrogen was added in three doses: at transplanting, and at 45 and 75 days after transplanting (dat). Phosphorus was added only at transplanting. The three management schemes were established in a randomised block design with four replications. Plots, consisting of six ridges (each 1 m wide by 12 m long), were planted with 1-month-old tomato seedlings of cv. Rio Grande, of the Saladette type. The IC treatment consisted of application of the calcu- lated dose of fertiliser as described before; ethoprop gel (68% Mocap® ) was applied at 7 kg active substance (a.s.) ha−1 in a band 10 cm from the plants, after a light irriga- tion, at transplanting and 20 dat; and 10 ton ha−1 of ho- mogenised, matured (i.e., allowed to stand for 12 months before use) chicken manure was applied in a band at the base of the furrow 30 days before transplanting. The lat- ter supplemented chemical fertilisation and improved soil structure and may bring about a nematode suppressive ef- fect (Mankau, 1962, 1963; Handelsman & Stabb, 1996). The TC scheme consisted of the best local practices and included use of fertiliser (150, 100 and 100 kg ha−1 of N, P, K, respectively) and 1 l ha−1 of carbofuran 27.5% (Fu- radan 300 T® ) applied to plants at 15, 30 and 60 dat. For the check treatment (AC), no nematicides and no chem- ical or organic fertilisers were used as crops are some- times grown under these conditions in this area, and such a treatment would provide a clear demonstration of the benefits of nematode management strategies under such conditions. Cultural practices and control of other pests and pathogens were carried out according to conventional local methods for all three management strategies. 728 Nematology
- 3. Epidemiology and control of Nacobbus aberrans on tomato CROP VIGOUR AND PRODUCTION AND NEMATODE COUNTS Every 10 days for 15 weeks, four plants were taken from the outer rows of each plot. A single randomly selected plant from the four that were taken was used to determine the population density of nematodes in the roots. After roots had been washed, cut into 1 cm sections and thoroughly mixed, a 1 g subsample per plant was blended and the third- (J3) and fourth-stage juveniles (J4) and the obese females within it were counted. Determination and counting of the stages of the nematode were made at a magnificaction of 40× using a stereomicroscope. The numbers of galls per plant were counted and the data used as an estimate of disease incidence through the crop season (McSorley, 1987). At the same time as taking plant samples, soil samples consisting of ten cores were taken midway between plants from the outer rows to a depth of 20-30 cm (totalling 500 g of soil/replicate). The procedures described by Ayoub (1980) were employed to extract the nematodes from soil and roots. The sieving flotation-centrifugation technique was used to extract second-stage juveniles (J2), J3 and J4 from 200 ml of soil per sample (using sieves of meshes 212, 106, 53 and 30 µm). Soil temperature was measured at a depth of 20 cm during the development of the crop using Tiny Talk Temperature Loggers® (Gemini, Chichester, UK) (Manzanilla-López, 1997). Fifteen plants, selected at random from the two cen- tral rows of each plot at harvest time, were used to esti- mate crop vigour and yield by measuring the following variables: plant height, foliage dry weight, stem diame- ter, total production, and commercial production. The data were subjected to analyses of variance and comparison of means using Tukey’s HSD test (P = 0.05; Steel & Torrie, 1986). EPIDEMIC CHARACTERISATION AND STATISTICAL ANALYSIS The numbers of galls per plant and of obese females per g of root that were estimated every 10 days were used to model the disease progress curve and population density over time. The area under the disease progress curve (AUDPC) was calculated using the trapezoidal integration method (Campbell & Madden, 1990), and the rate of apparent infection was estimated as the b−1 parameter of the Weibull model, in which Y(disease incidence) = 1 − e{−(t/b)c }, where e is the base of natural logarithms, t is the time measured in days, b is the reciprocal of the rate of disease increase, and c is an index determined by the shape of the curve (Pennypeker et al., 1980; Thal et al., 1984). The AUDPC and b−1 parameter were used as estimators of epidemic intensity based on the number of galls per plant. In both cases, the estimators were obtained using SAS procedures (Anon., 1988). For the b−1 parameter, a non-linear procedure (NLIN) and Dudd algorithms were used. The AUDPC and b−1 were also calculated based on the population curves of obese females (density per g of root). The numbers of galls per plant evaluated at the last commercial harvest were used to estimate the final disease incidence (Yf ). The parameters AUDPC, b−1 and Yf were subjected to analysis of variance followed by a multiple comparison of means using Tukey’s HSD test (P = 0.05). PRODUCTION LOSS MODELS Models were built using a multiple regression of the form: Y = b0 + b1x1 + b2x2 + b3x3 + bnxn, where Y is the commercial yield (i.e., fruit of marketable quality), b0 is the intercept parameter or ‘theoretical production’ sensu Zadoks and Schein (1979), and b1 to bn are parameters that estimate the effect of gall incidence on fruit production measured at different stages of crop phenology. Gall incidence, x1−n, was measured on different dates, beginning 10 days after transplanting and continuing up to the last harvest. By reference to the degree of galling of the plants in the AC treatment, the relative percentage incidence of galling in each treatment on each date was calculated and also used to estimate model parameters. A multiple point model (Madden, 1983; Teng, 1984; Campbell & Madden, 1990) was constructed using gall incidence during crop growth to estimate epidemic inten- sity at specific stages of crop phenology (Duncan & Fer- ris, 1983; Noling, 1987). A matrix of 12 observations, the result of averaging the disease incidence and yield of 15 plants per plot, was used to build the model, which con- sisted of the commercial (i.e., marketable) yield as the dependent variable (Y) and ten incidence measurements over time as independent variables (x1−10) per treatment and replicate. Percentage data were transformed for nor- mality by taking the arc-sin of the square root (Steel & Torrie, 1986). The Stepwise method of the GLM (gener- alised linear model) procedure of SAS (1988) was used to adjust the models, selecting those that satisfied a rel- atively high R2 , and also based on the general signifi- cance of the model and where the number of parame- Vol. 8(5), 2006 729
- 4. J. Cristóbal-Alejo et al. Fig. 1. Population densities of juveniles of Nacobbus aberrans on tomato (Lycopersicon esculentum cv. Rio Grande) under three control schemes. A: Second-stage juveniles (J2) per 200 ml of soil; B: Third- and fourth-stage juveniles (J3 and J4) per 200 ml of soil. IC = Integrated Control, TC = Technical Control, AC = Check. ters (p) gave a Cp-Mallow ≈ p, which gives the model good stability when used predictively (Freund & Littell, 1991). Results POPULATION DENSITY The population density of the nematodes in the soil and roots fluctuated during the cultivation cycle in all of the treatments (Figs 1, 2). Three overlapping generations of N. aberrans can be identified through the cultivation cycle. These correspond approximately to the periods 0-60, 60-100, and 100-130 dat, periods that show different peaks of juveniles in soil and roots (Figs 1A, B; 2A) and obese females in roots (Fig. 2B). Although some J3 and J4 were detected in soil as early as the first day after transplanting the crop, the J2 numbers peaked at 20, 75, 95 and 115 dat (Fig. 1A), while the J3 and J4 numbers peaked at 20, 80 and 100 dat (Fig. 1B). Blended root samples showed that the J3 and J4 were abundant (>100 g−1 root) in the AC at 20 dat (Fig. 2A). Population peaks of obese females (Fig. 2B) occurred at 30, 70-80 and 110 dat. All of the treatments showed a decrease in numbers of nematodes in soil and roots at the end of crop growth (Figs 1, 2). CHARACTERISATION OF EPIDEMICS The general trend was of peaks in the numbers of obese females and galls starting at 20 dat (Figs 2B; 3). The final phases of the first and second generations of the nematode population produced increments at 70 and 90 dat. These peaks, particularly for the numbers of galls, were lower in the IC (Fig. 3). The b−1 parameter of the Weibull disease progress model explained at least 94% of the experimental varia- tion during 0-50 dat (Table 1). The fit for the complete disease cycle (110 dat) was poor (r2 0.62) because 730 Nematology
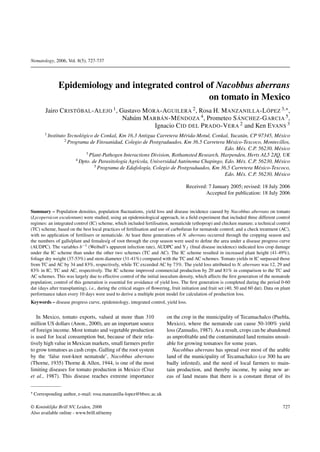
- 5. Epidemiology and control of Nacobbus aberrans on tomato Fig. 2. Nacobbus aberrans population densities on tomato roots (Lycopersicon esculentum cv. Rio Grande) under three control schemes. A: Third- (J3) and fourth- (J4) stage juveniles per g of root; B: Obese females per g of root. IC = Integrated Control, TC = Technical Control, AC = Check. of the peaks of damage mentioned above (Table 1). In addition, the AUDPC and Yf were calculated, so allow- ing us to define the intensity of the epidemics for the whole cultivation cycle. The IC treatment showed a less intense epidemic than the other treatments according to all of the models (P = 0.05), whilst the AC treatment had the highest epidemic intensity (Table 2). The AUDPC for the numbers of obese females/g of root also showed that IC allowed nematode development but that this treat- ment achieved the greatest degree of control (P = 0.05) (Table 2). EFFECTS OF TREATMENTS ON VIGOUR AND CROP PRODUCTION The beneficial effects of IC resulted in greater plant vigour throughout crop development as estimated from plant height, foliage dry weight, and stem diameter (P = 0.01) (Fig. 4). In reducing epidemic intensity, the IC treatment increased plant height by 41 and 49.6%, foliage dry weight by 36.9 and 53.1%, and stem diameter by 31.1 and 41% with respect to the TC and AC treatments, respectively. TC exceeded AC in plant height and foliage dry weight, but not in stem diameter (P = 0.05) (Fig. 4). Similar total yields were obtained in treatments IC and TC, which exceeded AC by 78.7 and 74.7%, respectively (P = 0.05) (Fig. 5). However, marketable production in IC exceeded that in TC and AC by 33.9 and 82.0%, respectively, and TC exceeded AC by 72.8%. PRODUCTION LOSS MODELS The best multiple point model for calculating commer- cial production loss caused by N. aberrans on the tomato cv. Rio Grande, was Y = 15.505 − 0.045 × 4 − 0.045 × 5 − 0.024 × 6, which had an R2 of 0.83 (P < 0.05) and a Vol. 8(5), 2006 731
- 6. J. Cristóbal-Alejo et al. Fig. 3. Partial temporal progress curves of disease on tomato, Lycopersicon esculentum cv. Rio Grande (up to 50 days after transplanting), caused by Nacobbus aberrans (values are means of four replicates per treatment). IC = Integrated Control, TC = Technical Control, AC = Check. Table 1. Nacobbus aberrans epidemics on tomato (Lycopersicon esculentum cv. Rio Grande) under three different control schemes. Coefficient of determination (r2), mean square of error (MSE) and apparent infection rate (b−1) values for partial epidemics (50 days after transplanting) and complete epidemics (110 days after transplanting) as estimated by the Weibull model. Treatment Replicate Weibull model 50 days after transplanting 110 days after transplanting r2 MSE b−1 r2 MSE b−1 IC 1 0.97 0.004 0.025 0.40 0.098 0.052 2 0.97 0.010 0.043 0.54 0.070 0.045 3 0.94 0.018 0.050 0.31 0.114 0.050 4 0.96 0.011 0.039 0.42 0.094 0.049 TC 1 0.99 0.000 0.096 0.45 0.082 0.096 2 0.95 0.014 0.077 0.30 0.101 0.061 3 0.95 0.012 0.079 0.49 0.068 0.068 4 0.96 0.009 0.084 0.41 0.083 0.075 AC 1 0.97 0.008 0.080 0.62 0.049 0.078 2 0.97 0.010 0.084 0.46 0.086 0.049 3 0.96 0.009 0.083 0.31 0.090 0.060 4 o.97 0.009 0.082 0.46 0.075 0.062 IC = Integrated Control; TC = Technical Control; AC = Check; r2 = coefficient of determination; MSE = mean square of error (variance) of the estimated apparent infection rate; b−1 = progress of apparent infection rate obtained from the reciprocal of the b parameter of the Weibull model. 732 Nematology
- 7. Epidemiology and control of Nacobbus aberrans on tomato Table 2. Effect of control schemes on three parameters of the temporal progress of disease on tomato (Lycopersicon esculentum cv. Rio Grande) caused by Nacobbus aberrans in Tecamachalco (Mexico). Disease parameter Number of galls per plant Females per g of root IC TC AC IC TC AC Yf (%) 64.0 b 71.0 a 71.0 a – – – b−1 0.039 b 0.085 a 0.083 a – – – AUDPC 1525 b 2830 a 3263 a 1282 c 2733 b 3220 a Yf = Final incidence (110 days after transplanting); b−1 = rate of apparent infection (reciprocal of the b parameter of the Weibull model) 50 days after transplanting; AUDPC = area below the disease progress curve 110 days after transplanting; IC = Integrated Control; TC = Technical Control; AC = Check. Note: numbers with the same letters in the same row are not significantly different (Tukey, P = 0.05). Fig. 4. Tomato (Lycopersicon esculentum cv. Rio Grande) vigour estimates under three control schemes for Nacobbus aberrans. IC = Integrated Control, TC = Technical Control, AC = Check. Bars with the same letter are not significantly different (Tukey, P = 0.05). Cp of Mallow of 6.38. In this model, Y corresponds to the estimated production and ×4, ×5, and ×6 represent the estimates of damage (i.e., degree of galling) caused by the nematode at 40, 50, and 60 dat, coinciding with the pheno- logical periods of flowering, fruit initiation, and fruit set, respectively (Fig. 3). From this model, the theoretical pro- duction (sensu Zadoks & Schein, 1979) was estimated, for a damage level equal to zero, at 1.03 kg plant−1 . From this estimate and with a sowing density of 20 000 plants ha−1 , a theoretically achievable yield of 20 673 kg ha−1 was cal- culated. The experimental treatments produced average total yields of 0.991 kg plant−1 (18 253 kg ha−1 ), 0.729 kg plant−1 (14 593 kg ha−1 ) and 0.174 kg plant−1 (3497 kg ha−1 ) in IC, TC and AC, respectively. Thus, the estimated production losses on tomato caused by N. aberrans, cal- culated from the theoretical maximum possible produc- tion and the average production achieved with the dif- ferent treatments, were 0.121 kg plant−1 (2420 kg ha−1 ) with IC, 0.304 kg plant−1 (6080 kg ha−1 ) with TC and 0.858 kg plant−1 (17 176 kg ha−1 ) with AC, which corre- spond to 11.7, 29.4 and 83.1%, respectively. Discussion There are few studies of disease progress and yield loss caused by N. aberrans (Manzanilla-López et al., 2002). Otazú et al. (1985) determined the progress curve of N. Vol. 8(5), 2006 733
- 8. J. Cristóbal-Alejo et al. Fig. 5. Effects of three different systems of management of Nacobbus aberrans on the production of tomato cv. Rio Grande. IC = Integrated Control, TC = Technical Control, AC = Check. Bars with the same letters are not statistically different (Tukey, α = 0.05). aberrans infection on potato during the growing season. However, the present work is the first report of the use of epidemiological models and management schemes to estimate production losses due to N. aberrans on tomato crops under field conditions. Others have made estimates based on different treatments under glasshouse conditions (Costilla & Gómez, 1981) or on the traditional criteria of chemical control based mainly on different dosages of nematicides and intensity of control (Zamudio, 1987; Franco et al., 1993a, b). The critical period for controlling the nematode is during its first generation (0-60 dat), and the damage in our experiment was estimated best by measuring the damage caused by N. aberrans between 40 and 50 dat, i.e., when the crop is at the stage of flowering and fruit initiation. The decrease in numbers of nematodes in soil and roots at the end of crop growth found in all treatments is a behaviour already reported by Gómez (1991) and Cid del Prado et al. (1996a). This phenomenon seemed to be due to the decline of the crop, the consequent disintegration of the roots, and the invasion of secondary disease organisms, such that less nutritious tissue was available for the nematodes. The first peak of obese females corresponded to the inoculum of J3 and J4 and immature females already present in the field before the crop was transplanted and responsible for the galls that developed on the plants in the bio-assay. Figure 1B clearly shows the presence of J3 and J4 in the soil at transplanting, a feature reported previously for this pathosystem (Manzanilla-López, 1997). More generations may occur immediately if alternative crop hosts or weeds follow a tomato crop (Cid del Prado et al., 1996b, 1997). Also, it has been observed that the nematode is able to survive without any host for at least one year under field conditions as J3 and J4 (Cristóbal-Alejo et al., 2001b). These two stages can tolerate gradual dehydration over 15-30 days (Manzanilla- López & Pérez-Vera, 1999) and host absence for up to a year (Manzanilla-López, unpubl.) better than other life stages. This may explain why, at the time of transplanting, only J3 and J4 (4-6 nematodes/200 ml) were found in the soil (Fig. 1B), despite efforts to recover J2 through sieving techniques. Thus, from the present work, it seems that J3 and J4 represent the main inoculum for the progress of epidemics, and this is the first report that demonstrates the importance of these juvenile stages under field conditions. These stages must, therefore, be the principal target for the purposes of achieving an effective control of crop damage and management of the nematode. The chemical control in IC at the begining of the crop season was presumably the cause of the lowered peak in numbers of J2 (Fig. 1A), thereby reducing the impact of the initial inoculum of the nematode and helping to reduce the numbers of the first generation of obese females (Figs 2B; 3). 734 Nematology
- 9. Epidemiology and control of Nacobbus aberrans on tomato The overall beneficial effects of IC must have been due to the two main components (i.e., nematicides and fertilis- ers, both chemical and organic), which influence the ef- fective initial inoculum (estimated through Y0) by reduc- ing nematode densities and also improve host nutrition. Later, IC also reduced the values of the epidemic intensity parameters (AUDPC, b−1 , and Yf ). The positive effects of addition of chicken manure might be at least partly due to their restrictive effect on nematode development (Rodríguez-Kábana, 1986; Zavaleta-Mejía, 1986). How- ever, as with other types of amendment, it is important to study the effects of the amendment on various physico- chemical processes in the soil and on soil pH (Etchevers et al., 1989). Its effects on nematode antagonistic organ- isms (Mankau, 1962, 1963; Wallace, 1983) and the opti- mum period of application could also be important. The application of nematicide in this experiment, especially at the time of transplanting, did reduce the initial inocu- lum, but it would be informative to study the frequency of application, dose, and alternative chemical products, and to make cost-benefit analyses, to determine the most ef- fective strategy (Chew, 1995; Barker & Koenning, 1998; Yáñez et al., 2001). Conclusions Epidemiological models to assess disease progress have been built for few species of plant-parasitic nematodes. This is partly due to the lack of studies that include data on nematode population dynamics related to crop phenology, and this is especially true for Nacobbus. In the present study, information has been generated on the population dynamics of N. aberrans on tomato plants under field conditions in a comparison of treatments designed to increase production and to reduce the effect of the nematode on yield. At least three generations of N. aberrans seemed to occur through the cropping season and J3 and J4 were the main inoculum for the progress of epidemics. The critical period for controlling the nematode is probably during the first generation (0-60 dat). The epidemiological models for the disease caused by the nematode on tomato crops, revealed that the number of galls per plant and females per g of root through the crop season were the most practical and suitable variables for definition of the area under a disease progress curve (AUDPC). The variables b−1 (Weibull’s apparent infection rate), AUDPC and Yf (final disease incidence) indicated less crop damage under the IC scheme than under the other two schemes (TC and AC) (P = 0.05). However, comparison with AC also showed that chemical control only reduces the numbers of nematodes for a short period without exerting permanent control. Therefore, this could still permit a major loss in production but, by using the additional measures included in IC, such large losses are avoided, thus diminishing the impact of the disease (Chávez, 1995; Chew, 1995; Cid del Prado et al., 1997). The epidemiological approach used in the present study helped to assess the impact of the different control practices and their potential for increasing production and reducing the nematode population in infested soils. The results should help in planning and implementing improved control strategies. The IC programme would allow the disease to be managed in a sustainable production system and to increase crop yield (Téliz, 1992) in infested soils, thus reducing the area of land abandoned by small farmers because of infestation of the soil by N. aberrans and the consequent poor crop yields. Acknowledgements The first author thanks CONACYT (Mexico) for finan- cial support through the development of the research, and Manuel Rodríguez, the cooperating farmer. Rothamsted Research receives grant-aided support from the Biotech- nology and Biological Sciences Research Council of the United Kingdom. References ANON. (1988). SAS User´s guide: Basics version 6.03 edition. Cary, NC, USA, SAS Institute Inc., 28 pp. ANON. (2000). Estadísticas del comercio exterior de México. Información preliminar. México, INEGI. Vol. XXII 7, 163 pp. AYOUB, M.S. (1980). Plant nematology an agricultural train- ing aid. Sacramento, CA, USA, Department of Food and Agriculture Division of Plant Industry Laboratory Services- Nematology, 157 pp. BARKER, K.R. & KOENNING, S.R. (1998). Developing sus- tainable systems for nematode management. Annual Review of Phytopathology 36, 165-205. CAMPBELL, C.L. & MADDEN, L.V. (1990). Introduction to plant disease epidemiology. New York, USA, John Wiley & Sons Inc., 532 pp. CHAVEZ, A.J.J. (1995). Control integrado de la marchitez del Chile (Capsicum annuum L.) ocasionada por el hongo Phy- tophthora capsici L. en la Región de Valsequillo, Puebla, Méx- Vol. 8(5), 2006 735
- 10. J. Cristóbal-Alejo et al. ico. Tesis de Maestría, Colegio de Postgraduados, Montecillo, México, 98 pp. CHEW, M.Y.I. (1995). Evaluación de algunas estrategias de control de la virosis en el cultivo de Chile (Capsicum annuum L.). Tesis de Maestría, Colegio de Postgraduados, Montecillo, México, 95 pp. CID DEL PRADO, V.I., EVANS, K., MANZANILLA-L., R.H., CRISTÓBAL-ALEJO, J. & FRANCO-A., G.E. (1996a). Eval- uación de algunas estrategias para el manejo de Nacobbus aberrans en el cultivo de tomate (Lycopersicon esculentum Mill.). In: Congreso Nacional de Fitopatología, Guadalajara, Jalisco, México. Revista Mexicana de Fitopatología R83. [Abstr.] CID DEL PRADO, I., EVANS, K., MANZANILLA-L., R.H., CRISTÓBAL-ALEJO, J., FRANCO, E. & CARRILLO, C. (1996b). Dinámica poblacional de Nacobbus aberrans en parcelas con cultivo de tomate, maíz y maleza. In: Congreso Nacional de Fitopatología, Guadalajara, Jalisco, México. Revista Mexicana de Fitopatología R81. [Abstr.] CID DEL PRADO, V.I., CRISTÓBAL-ALEJO, J. & EVANS, K. (1997). Manejo de poblaciones de Nacobbus aberrans en el cultivo de tomate (Lycopersicon esculentum Mill.). Nematropica 27, 103-104. COSTILLA, B.H. & DE GÓMEZ, T. (1981). Ensayo de control químico del nematodo Nacobbus aberrans en tubérculos de papa. Nematropica 11, 78-79. CRISTÓBAL-ALEJO, J., CID DEL PRADO-VERA, I., SANCHEZ, G.P., MARBAN-MENDOZA, N., MANZANILLA- LOPEZ, R.H. & MORA-A., G. (2001a). Alteraciones nutrimentales en tomate (Lycopersicon esculentum Mill.) por efecto de Nacobbus aberrans. Nematropica 31, 219-226. CRISTÓBAL-ALEJO, J., CID DEL PRADO-VERA, I., MARBAN-MENDOZA, N., SANCHEZ, G.P., MORA-A., G. & MANZANILLA-LOPEZ, R.H. (2001b). Sobrevivencia de estados biológicos de N. aberrans en condiciones de campo. Nematropica 31, 227-233. CRUZ, M.A., ZERÓN, F. & DE LA JARA, F. (1987). Dispersión del nematodo fitoparásito Nacobbus aberrans en una región agrícola entre Actopán y Progreso, Estado de Hidalgo. Memorias, XIV Congreso Nacional de la Sociedad Mexicana de Fitopatología. Morelia, Michoacán, México, p. 83. DUNCAN, L.W. & FERRIS, H. (1983). Validation of model for prediction of host damage by two nematode species. Journal of Nematology 15, 227-234. ETCHEVERS, D.J., CORTES, J.L., MORA, G., GUTIÉRREZ, N., GARCÍA, R., TÉLIZ, D. & JUÁREZ, C. (1989). Tristeza del aguacate: fertilidad del suelo y nutrición de las plantas. Revista Mexicana de Fitopatología 7, 231-239. ETCHEVERS, D.J., GALVIS, A. & RODRÍGUEZ, J. (1994). A system approach for determining NP fertiliser recommenda- tions for annual crops. Theory. XV Congreso de la Ciencia del Suelo, Vols I and II. Acapulco, Guerrero, Mexico, pp. 438- 445. FRANCO, J., MONTECINOS, R. & MONTALVO, R. (1993a). Tratamiento químico de tubérculos infectados por Nacobbus aberrans para evitar su diseminación. Nematropica 23, 117. FRANCO, J., MONTALVO, R. & MONTECINOS, R. (1993b). Pérdidas en el cultivo de la papa causadas por Nacobbus aberrans en Cochabamba. Nematropica 23, 117. FRANCO-NAVARRO, F., CID DEL PRADO-VERA, I., ZAVA- LETA-MEJÍA, E. & SANCHEZ-GARCÍA, P. (2002). Appli- cation of organic ammendments for the management of Na- cobbus aberrans on tomato. Nematropica 32, 113-124. FREUND, R.J. & LITTELL, R.C. (1991). SAS® System for Regression. Second edition. Cary, NC, USA, SAS Institute, 210 pp. GÓMEZ, R.O. (1991). Efecto del Cempazúchil (Tagetes erecta L.) asociado con jitomate en Nacobbus aberrans e insec- tos transmisores de virus. Tesis Maestría en Ciencias en Protección Vegetal. Departamento de Parasitología Agrícola. UACH, Chapingo, Edo. de México, 83 pp. HANDELSMAN, J. & STABB, E. (1996). Biocontrol of soilborne plant pathogens. The Plant Cell 8, 1855-1868. MADDEN, L.V. (1983). Measuring and modelling crop losses at the field level. Phytopathology 73, 1591-1596. MANKAU, R. (1962). The effect of some organic additives upon a soil nematode population and associated natural enemies. Nematologica 7, 65-73. MANKAU, R. (1963). Effects of organic soil amendments on nematode populations. Phytopathology 83, 375-378. MANZANILLA-LÓPEZ, R.H. (1997). Studies on the characteri- sation and bionomics of Nacobbus aberrans (Thorne, 1935) Thorne & Allen, 1944 (Nematoda: Pratylenchidae). Ph.D. Thesis, University of Reading, UK, 395 pp. MANZANILLA-LÓPEZ, R.H. & PÉREZ-VERA, A.O. (1999). Survival of dehydration and infectivity of the development stages of Nacobbus aberrans (Thorne, 1935) Thorne & Allen, 1944. Nematropica 29, 125-126. MANZANILLA-LÓPEZ, R.H., COSTILLA, M.A., DOUCET, M., FRANCO, J., INSERRA, R.N., LEHMAN, P.S., CID DEL PRADO-VERA, I., SOUZA, R.M. & EVANS, K. (2002). The genus Nacobbus Thorne & Allen, 1944 (Nematoda: Praty- lenchidae): Systematics, distribution, biology and manage- ment. Nematropica 32, 149-227. MCSORLEY, R. (1987). Plot size and design for acquisition of field data in nematology. In: Veech, J. & Dickson, D. (Eds). Vistas on nematology. Hyattesville, MD, USA, Society of Nematologists, pp. 52-58. NOLING, J.W. (1987). Partitioning crop losses. In: Veech, J. & Dickson, D. (Eds). Vistas on nematology. Maryland, USA, Society of Nematologists, pp. 64-74. OTAZU, V., HOOPES, R., CAERO, G. & HUAYTA, I. (1985). El rosario de la papa causado por Nacobbus aberrans (Thorne, 1935) Thorne and Allen, 1944, su efecto en el rendimiento y algunos aspectos que inciden en su propagación y prevalencia en Bolivia. Fitopatología 20, 65-70. 736 Nematology
- 11. Epidemiology and control of Nacobbus aberrans on tomato PENNYPEKER, S.P., KNOBLE, H.D., ANTLE, C.D. & MAD- DEN, L.V. (1980). A flexible model for studying plant disease progression. Phytopathology 70, 232-235. RODRÍGUEZ-KÁBANA, R. (1986). Organic and inorganic nitro- gen amendments to soil nematode suppressants. Journal of Nematology 18, 129-135. SILVA, J.J. (1989). Manejo de Nacobbus aberrans (Thorne, 1935), Thorne & Allen, 1944, asociado al cultivo de frijol en el valle de Valsequillo, Puebla. Tesis de Maestría. Colegio de Postgraduados, Montecillo, México, 84 pp. STEEL, R.D. & TORRIE, J.H. (1986). Bioestadística. Princip- ios y procedimientos. Second edition. D.F. México, McGraw- Hill, 622 pp. TÉLIZ, O.D. (1992). Conceptos fitopatológicos: control o manejo de enfermedad? La enfermedad o el cultivo o el hom- bre? Revista Mexicana de Fitopatología 10, 24-28. TENG, P.S. (1984). Estimating and interpreting disease intensity and loss in commercial fields. Phytopathology 73, 1587-1590. THAL, W.M., CAMPBELL, C.L. & MADDEN, L.V. (1984). Sensitivity of Weibull model parameters estimates to varia- tion in simulated disease progression data. Phytopathology 74, 1425-1430. WALLACE, H.R. (1983). Interaction between nematodes and other factors on plants. Journal of Nematology 15, 221-226. YAÑEZ-JUÁREZ, M.G., ZAVALETA-MEJÍA, E., FLORES- REVILLA-C., CHÁVEZ-ALFARO, J. & VALDIVIA-ALCALÁ, R. (2001). Management of wilting (Phytophthora capsici Leo.), root galling (Nacobbus aberrans Thorne & Allen) and virosis in pepper (Capsicum annuum L.). Revista Mexicana de Fitopatología 19, 40-48. ZADOKS, J.C. & SCHEIN, R.D. (1979). Epidemiology and plant disease management. Oxford, UK, Oxford University Press, 427 pp. ZAMUDIO, G.V. (1987). Evaluación de la resistencia de colec- ciones y variedades comerciales de tomate (Lycopersicon spp.) a Nacobbus aberrans Thorne & Allen. Tesis de Maestría. Colegio de Postgraduados. Montecillo, Edo. de México, 159 pp. ZAVALETA-MEJÍA, E. (1986). Modificadores orgánicos en el manejo de enfermedades radicales. Revista Mexicana de Fitopatología 8, 42-51. Vol. 8(5), 2006 737