
Empfohlen
Empfohlen
Weitere ähnliche Inhalte
Was ist angesagt?
Was ist angesagt? (18)
Andere mochten auch
Andere mochten auch (9)
Ähnlich wie Pasture harvest trials show gains of 12-37% DM/Ha
Ähnlich wie Pasture harvest trials show gains of 12-37% DM/Ha (20)
Pasture harvest trials show gains of 12-37% DM/Ha
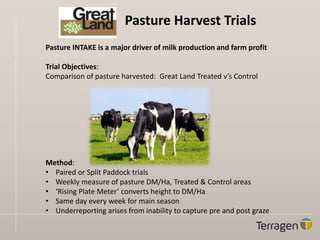
- 1. Pasture Harvest Trials Pasture INTAKE is a major driver of milk production and farm profit Trial Objectives: Comparison of pasture harvested: Great Land Treated v’s Control Method: • Paired or Split Paddock trials • Weekly measure of pasture DM/Ha, Treated & Control areas • ‘Rising Plate Meter’ converts height to DM/Ha • Same day every week for main season • Underreporting arises from inability to capture pre and post graze
- 2. 2015 Dairy Trial Farm Locations Western Victoria Gippsland Southern Riverina Northern Victoria
- 3. Pasture Harvest Trials Typical Weekly Pasture Reading Chart Split Paddock Line charts starts at week prior to first grazing
- 4. Pasture Harvest Trials Regional Summary Harvested Pasture >> MS Production >> Incremental Revenue Direct to Bottom Line (due to additional flow through benefits - input costs, animal health, productivity) REGION No. Farms Irrigated / Dryland No. Trials No. Trials Control (Base) kgDM/Ha GL Treat. Gain kgDM/Ha % Gain Range (%) North Vic 6 6 / 0 12 9 7,582 2,085 28% 14% to 75% Gippsland 8 5 / 3 14 12 5,169 1,895 37% 2% to 161% SW Vic 14 1 / 13 23 14 6,557 1,106 17% 5% to 79% Sthn Riverina 12 12 / 0 94 69 6,864 807 12% -9% to 25% OVERALL 40 24 / 16 143 104 Trials Completed and Reported (Average Gain)Trials Established
- 5. Pasture Harvest Trials Other observations beyond pasture harvest gains • Pasture uniformity, clover content, weeds • Pastures lasting longer in dry condition (improved soil moisture) • Grazing pressure and grazing uniformity • Animal health, calf health (where larger portion of farm is treated) Fact: 100,000 change in BSCC impacts milk production by 5% – subclinical
- 6. 7 Day Grazing Trials Objective: Measure influence of Great Land treated pasture on Milk Production Method: Graze nominated pasture for 7 day periods: Control > Treated > Control Need at least one third of the farm as treated paddocks Milk data from third party processor Approx 36 hours Intake to milk output
- 7. 8,000 9,000 10,000 11,000 12,000 13,000 14,000 15,000 16,000 17,000 18,000 May-C May-T May-C Jun-C Jun-T Jun-C July-C July-T Jul-C Nov-C Nov-T Nov-C Jan-C Jan-T Jan-C 7 Day Grazing Trial (2015/16), ‘Great Land’ Treatment Herd Average - Daily Milk Volume (L/Period) Control Treatment Season Average Volume to End Nov. Grazing Treated Paddocks = Gain 440 L/day (2.8%) No. Cows Reduced, Drying Off Source: Murray Goulburn
- 8. 50 75 100 125 150 May-C May-T May-C Jun-C Jun-T Jun-C July-C July-T Jul-C Nov-C Nov-T Nov-C Jan-C Jan-T Jan-C 7 Day Grazing Trial (2015/16), ‘Great Land’ Treatment BMCC - Herd Average for Period ('000) Control Treatment Source: Murray Goulburn
- 9. Full Farm - Demonstration Case Tasmania Conventional Scenario • Fertilisers dominated by urea (250- 350 kg N/yr), super phosphate, muriate of potash • Pastures not responding to N applications, pastures thin and limited clover. • Weed problems Results of Biological Approach Over 5-7 years, with GL in FY15 • Milk & MS production increased • BSCC reduced by > 100,000 • Revenue and profit increase • Pastures more even, clover dense and leaves double in size, root zone much deeper • Weeds under control • Corby grubs significantly supressed • Cows filling up on pasture more quickly (nutrient quality), pasture utilisation increased, stocking rate increased, • Fertility increased, portion of heifer calves increased (consistently)
- 10. Full Farm Performance Tasmania 2013/14 2014/15 Variance Herd Size 550 610 60 11% Pasture (tDM/ha) 6.8 9.8 3.0 44% Milk price ($/kg MS) 6.63 6.22 -0.43 -6% Milk Production (Milk Solids – MS) Per Cow 368 389 21 6% Per Hectare 889 1,040 151 17% Dairy Profit Per hectare $625 $1,121 $496 79% Per cow $259 $419 $160 62%
- 11. Pasture MT DM/Ha Dairy Profit +$113,000 Dairy Revenue Herd +60 Head Milk Solids 35,000kg $142K $256K 79% Milk Price -$0.41/kg $1,343K $1,477K 10% $137K Impact on Dairy Revenue (FY15 vs FY14) -$83K $80K 6.8 MT 9.8MT 44% Revenue FY14 $1,343,100 Price Decrease -$83,090 Herd Size Increase $137,338 MS Volume & Value $79,678 Revenue FY15 Total $1,477,026 Revenue Increase $133,926 FY14 FY15 FY14 FY15 FY14 FY15
- 12. Using Trial Results Profit / Workload / Sustainable / Quality Conventional System Sustainable System Indirect Benefits: • Reduced Input Costs • Fertiliser/Chemicals/Health • Animal health gains, nutrient balance • Productivity • Cow Fertility • Calf Mortality Direct Benefits • More grass • More Milk
- 13. Nutrients Pasture Quality & Quantity Increased Growth Palatability Mastitis Mortality Fertility Milk Quality & Quantity Increased Milk Solids Decreased Somatic Cell Count Farm Inputs Decreased fertiliser Decreased Herbicides Decreased feed $ Increased Nutrient Availability • Improved soil structure • ↓ Nitrogen leaching • ↑Organic matter • ↑Moisture retention • Improved fertiliser efficiency Lameness Whole System Approach: Profits & Sustainability