1. Development of a control strategy to test the
capacity and efficiency ageing of a domestic
scale battery energy storage system (BESS)
Richard Parris (parris.richard@outlook.com)
Supervisor: Dr Yehdego Habtay
Introduction/Motivation
Design
Implementation and Results
Conclusions/Scope for Further Work
Key BESS Testing Principles:
1. Cell voltage determined the cycling capacity (maximum
charge and discharge levels).
2. Charging method: Constant Current (CC) followed by
Constant Voltage (CV), within manufacturer limitations.
Discharge method: Constant load (aluminium resistor)
3. Charge energy and elapsed cycle time were checked to
ensure the full BESS capacity was used for each cycle.
• Efficiency degradation is an issue for Lithium ion BESS
• The project successfully quantified efficiency degradation at 0.07%
per cycle over a small number of cycles.
• A robust test strategy and prototype were developed that can be
applied to other Lithium ion BESS for comparison.
• Further work: more cycles of the same type of BESS; testing of
other BESS units; testing under different environmental and
electrical conditions; variation of the length of both active cycling
and resting time.
References
Muenzel, V., Hollenkamp, A., Bhatt, A., de Hoog, J., Brazil, M., Thomas, D. and
Mareels, I. (2015). A Comparative Testing Study of Commercial 18650-Format Lithium-
Ion Battery Cells. Journal of the Electrochemical Society, 162(8), pp.A1592-A1600.
The project investigated BESS used in domestic power
applications. Lithium chemistry batteries were the primary
technology considered because of their growing
application to households (Muenzel et. al., 2015).
Objectives:
• Identify clear models of BESS operation and ageing
• Identify an effective BESS test methodology
• Design, implement and test a control strategy
• Test an appropriate BESS using the control system
70.00
71.00
72.00
73.00
74.00
75.00
76.00
77.00
78.00
79.00
80.00
0 2 4 6 8 10 12 14 16
CycleEfficiency(%)
Cycle Number (No units)
Block Diagram with Component Details for the Prototype:
Test System Component Board:
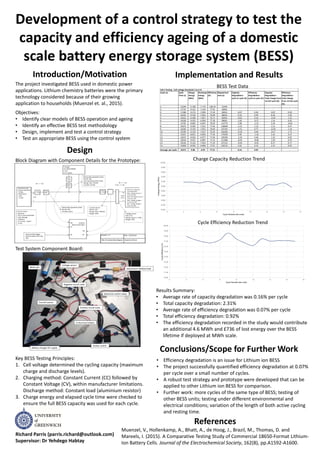
Cycle Efficiency Reduction Trend
Charge Capacity Reduction Trend
BESS Test DataCell 2 Testing - Cell voltage threshold: 2.6-4.1V
Cycle no. Cycle
Time (s)
Charge
Energy
(Whs)
Discharge
Energy
(Whs)
Efficiency
(%)
Elapsed test
time (s)
Capacity
Degradation -
cycle to cycle (%)
Efficiency
Degradation -
cycle to cycle (%)
Capacity
Degradation -
Total change from
1st full cycle (%)
Efficiency
Degradation -
Total change
from 1st full cycle
(%)
1 15344 5.190 -7.175 138.24 15344 - - - -
2 17737 9.167 -7.144 77.93 33081 - - - -
3 17360 9.173 -7.094 77.34 50441 -0.07 0.59 -0.07 0.59
4 16191 9.143 -7.031 76.90 66632 0.33 0.44 0.26 1.03
5 16321 9.200 -7.057 76.71 82953 -0.62 0.19 -0.36 1.22
6 16028 9.053 -6.996 77.28 98981 1.60 -0.57 1.24 0.65
7 15791 8.865 -6.967 78.59 114772 2.08 -1.31 3.29 -0.66
8 16072 9.056 -7.015 77.46 130844 -2.15 1.13 1.21 0.47
9 16263 9.193 -7.051 76.69 147107 -1.51 0.77 -0.28 1.24
10 16295 9.210 -7.017 76.20 163402 -0.18 0.49 -0.47 1.73
11 15627 8.851 -6.856 77.46 179029 3.90 -1.26 3.45 0.47
12 16027 9.054 -6.977 77.06 195056 -2.29 0.40 1.23 0.87
13 16010 9.057 -6.987 77.14 211066 -0.03 -0.08 1.20 0.79
14 16245 9.142 -7.054 77.16 227311 -0.94 -0.02 0.27 0.77
15 15820 8.955 -6.896 77.01 243131 2.05 0.15 2.31 0.92
Average per cycle: 16271 9.08 -6.95 77.21 - 0.16 0.07 - -
8.000
8.200
8.400
8.600
8.800
9.000
9.200
9.400
9.600
9.800
10.000
0 2 4 6 8 10 12 14 16
ChargeEnergy(Whs)
Cycle Number (No units)
Results Summary:
• Average rate of capacity degradation was 0.16% per cycle
• Total capacity degradation: 2.31%
• Average rate of efficiency degradation was 0.07% per cycle
• Total efficiency degradation: 0.92%
• The efficiency degradation recorded in the study would contribute
an additional 4.6 MWh and £736 of lost energy over the BESS
lifetime if deployed at MWh scale.