By narantsetseg purev beneficiary view 2
•
1 gefällt mir•252 views

Research on the Financing for Development

Empfohlen
Empfohlen
Weitere ähnliche Inhalte
Andere mochten auch
Andere mochten auch (11)
Ähnlich wie By narantsetseg purev beneficiary view 2
Ähnlich wie By narantsetseg purev beneficiary view 2 (20)
Mehr von Purev Narantsetseg
Mehr von Purev Narantsetseg (20)
Kürzlich hochgeladen
Kürzlich hochgeladen (20)
By narantsetseg purev beneficiary view 2
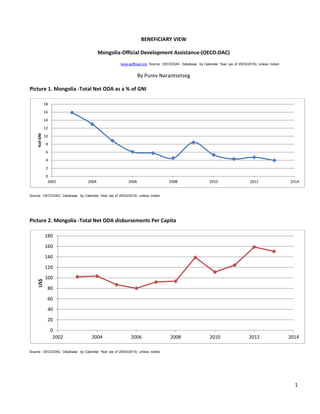
- 1. 1 BENEFICIARY VIEW Mongolia-Official Development Assistance-(OECD-DAC) www.aidflows.org Source: OECD/DAC Database by Calendar Year (as of 25/03/2015) unless noted. By Purev Narantsetseg Picture 1. Mongolia -Total Net ODA as a % of GNI Source: OECD/DAC Database by Calendar Year (as of 25/03/2015) unless noted. Picture 2. Mongolia -Total Net ODA disbursements Per Capita Source: OECD/DAC Database by Calendar Year (as of 25/03/2015) unless noted. 0 2 4 6 8 10 12 14 16 18 2002 2004 2006 2008 2010 2012 2014 %ofGNI 0 20 40 60 80 100 120 140 160 180 2002 2004 2006 2008 2010 2012 2014 US$
- 2. 2 Picture 3. Mongolia- Total Net ODA Disbursement ( US$M) Source: OECD/DAC Database by Calendar Year (as of 25/03/2015) unless noted. Picture 4. Mongolia - Components of Total Net ODA Disbursements (in US$M) 0 50 100 150 200 250 300 350 400 450 2003 2004 2005 2006 2007 2008 2009 2010 2011 2012 2013 US$M ■ Net ODA disbursement, ■ of which IDA disbursements 0 100 200 300 400 500 2003 2004 2005 2006 2007 2008 2009 2010 2011 2012 2013 US$M ■ Bilateral ODA ■ Multilateral ODA
- 3. 3 Picture 5. Mongolia - ODA Disbursements by Type of Financing (in US$M) Picture 6. Mongolia - Net ODA Disbursements by Type of Financing (in US$M) 0 100 200 300 400 500 2003 2004 2005 2006 2007 2008 2009 2010 2011 2012 2013 US$M ■ Gross loan, ■ Net debt relief grants, ■ other grants 0 100 200 300 400 500 2003 2004 2005 2006 2007 2008 2009 2010 2011 2012 2013 US$M ■ gross loan, ■ other grants, ■ net debt relief grants
- 4. 4 Picture 7. Mongolia - Sources of ODA: Top 15 Donors of Net ODA Disbursements (average for last 5 years in US$M) Picture 8. Mongolia - Uses of ODA: Gross ODA Disbursements by Sector (in US$M) Sector 2010 2011 2012 2013 2014 A verage: Last 5 years Action relating to debt 0.62 0.00 0.76 0.00 0.00 0.27 0.001% Administrative costs 0.14 1.93 2.45 2.41 0.30 1.45 0.004% Economic infrastructure and services 86.99 85 .32 109.57 223.28 1.06 101.24 30.4% Education 46.84 57 .80 70.82 57.35 0.37 46.63 14% Health and population 25.20 2 9.49 27.56 33.96 9.98 25.24 7.5% Humanitarian aid 6.33 1.55 1.96 13.16 0.87 4.77 0.014% Multisector/cross-cutting 48.19 47.52 73.11 33.84 1.13 40.76 12.1% Other social sectors 69.13 75.76 88.85 60.93 2.26 59.39 17.8% Production sectors 45.29 5 5.12 69.74 45.92 0.84 43.38 13% Program assistance 5.65 8.75 19.11 2.74 0.19 7.29 2.2% unallocated/unspecified 2 .69 3.66 5.51 2.24 0.04 2.83 0.01% 0 10 20 30 40 50 60 70 80 Japan US Germany Korea Switzerland Australia Turkey Czech Republic France Netherlands Luxemburg Canada Russia Finland UK
- 5. 5 Picture 9. Mongolia - WBG & Trust Funds Gross Commitments (by fiscal year in US$M) Mongolia - World Bank Data, Source: World Bank Sources - data as of 31 December 2014 www.aidflows.org Picture 10. Mongolia - Undisbursed Commitments ( as of FY15 end in US$M) (as 31 December, 2014) Mongolia - World Bank Data, Source: World Bank Sources - data as of 31 December 2014 www.aidflows.org 0 20 40 60 80 100 2009 2010 2011 2012 2013 2014 2015 US$D IFC IDA IBRD MIGA TFs 0 20 40 60 80 100 120 140 IBRD IDA IFC MIGA TFs US$M
- 6. 6 Picture 11. Mongolia- IBRD, IDA and TF Disbursements (by fiscal year in US$M) (as 31 December, 2014) Mongolia - World Bank Data, Source: World Bank Sources - data as of 31 December 2014 www.aidflows.org Picture 12. Mongolia - Number of IBRD/IDA & TF Projects (by fiscal year) (as of 31 December, 2014) Mongolia - World Bank Data, Source: World Bank Sources - data as of 31 December 2014 www.aidflows.org 0 20 40 60 80 100 2009 2010 2011 2012 2013 2014 2015 US$M IBRD IDA TFs 0 2 4 6 8 2007 2008 2009 2010 2011 2012 2013 2014 2015 IBRD/IDA&TF-fin Stand alone TF
- 7. 7 Picture 13. Number of Grants Approved Number of Grants Approved FY11 FY12 FY13 FY14 FY15 Totals Co-financing 1 0 1 1 1 4 Debt-Service 0 0 0 0 0 0 Stand-alone 6 4 2 3 0 15 Total 7 4 3 4 1 19 Grant commitments Grant Commitments (in US$) FY09 FY10 FY11 FY12 FY13 T ot al s Co-financing 660,979 -431,544 83,133 592.093 431.446 473.215 Stand-alone 4,645,000 15,209,391 2,856,287 2.100.000 641.000 25.451.678 N/A 0 0 0 0 0 0 Total 5,305,979 14,777,848 2,939,420 2.692.000 1.072.446 25.924.893 Grant disbursements Grant Disbursements (in US$) FY09 FY10 FY11 FY12 FY13 T ot al s Co-financing 13,660,920 1,527,492 363,158 179.540 830.947 16.562.057 Stand-alone 7,639,565 2,773,170 3,543,304 7.652.034 5.788.701 27.396.774 N/A 0 0 0 0 0 0 Total 21,300,485 4,300,662 3,906,462 7.831.574 6.619.648 43.958.831 * Stand-alone Grants support specific development projects/activities as specified by the Donors. Mongolia - World Bank Data, Source: World Bank Sources - data as of 31 December 2014 www.aidflows.org IBMongolia - Commitments for Major Programs (by fiscal year in US$) Picture 14. IBRD/IDA disbursements by sector in %, as of 31 December, 2014 Energy&Mining Public Admin&Law Health&social service Finance Agricuture Transportation Water/Sanitation Education Info&communication industry&trade
- 8. 8 Picture 15. TF disbursements by sector in %, as of 31 December, 2014 Picture 16. Commitments for major TF programs (by fiscal year in US$) Program FY11 FY12 FY13 FY14 FY15 EDUCATN FOR ALL-FAST TRACK INITIATIVE 0 10,000,000 0 0 0 MONGOLIA FREE STANDING TF PROGRAM 203,273 85,284 284,881 -54.906 641.000 JAPANESE SOCIAL DEVELOPMENT FUND 2,743,926 2,457,579 0 0 0 KOREA TRUST FUND 1,650,000 -14,803 -246,161 0 0 AVIAN AND HUMAN INFLUENZA TRUST FUNDS 0 -120,405 2,900,700 0 -214.732 PHRD FUND-TECHNICAL ASSISTANCE TF -16,221 2,730,000 0 0 0 EFA FTI EDUCATION PROGRAM DEVELOPMENT F 0 -359,807 0 0 0 EXTRACTIVE INDUSTRIES TRANSPARENCY INITI 250,000 0 0 0 0 STATISTICAL CAPACITY BUILDING PROGRAM 0 0 0 0 0 INSTITUTIONAL DEVELOMENT FUND 350,000 0 293.550 277.000 0 Global Agriculture Food security program 0 0 11.000.000 0 0 Mongolia-Australia Partnership for sust. develop 0 0 0 2.100.000 0 Global Partnership for Social accountability 0 0 0 0 650.000 Mongolia - World Bank Data, Source: World Bank Sources - data as of 31 December 2014 www.aidflows.org Picture 17. Mongolia-Commitments for major TF programs Program FY11 FY12 FY13 FY14 FY15 MONGOLIA FREE STANDING TF PROGRAM 10,560,489 393,132 170,415 1.083.707 218.406 EDUCATN FOR ALL-FAST TRACK INITIATIVE 4,300,000 0 2,000,000 2.345.528 4.514.986 PHRD FUND-TECHNICAL ASSISTANCE TF 1,911,648 651,049 392,742 180.293 272.930 AVIAN AND HUMAN INFLUENZA TRUST FUNDS 1,234,585 650,745 900.000 1.785.967 0 JAPANESE SOCIAL DEVELOPMENT FUND 541,602 749,957 1,050,396 1.108.696 384.899 KOREA TRUST FUND 918,354 1,177,923 382,207 97.105 20.263 GEF-IBRD AS IMPLEMENTING AGENCY 857,488 456,963 -61.114 0 0 EFA FTI EDUCATION PROGRAM DEVELOPMENT F 215,238 0 0 EXTRACTIVE INDUSTRIES TRANSPARENCY INITI 129,889 138,414 44,470 67.115 -3.821 STATISTICAL CAPACITY BUILDING 330,149 0 0 0 0 Mongolia-Australia Partnership for sust. develop 0 0 0 0 612.540 GAFSP supervising entity 0 0 0 1.000.000 482.998 Energy&Mining Public Admin&Law Health&social service Finance Agricuture Transportation Water/Sanitation Education Info&communication industry&trade
- 9. 9 Picture 18. Millenium Development Goals Units 2009 2010 2011 2012 2013 Goal 1: Eradicate extreme poverty and hunger Poverty headcount ratio at $1.25 a day Poverty headcount ratio at national poverty line Share of income or consumption to the poorest quintile Prevalence of malnutrition PPP, % of population % of population % % of children under 5 n/a n/a n/a n/a n/a n/a 38.70% 33.70% 27.40% n/a n/a n/a n/a n/a n/a n/a n/a n/a n/a n/a Goal 2: Achieve universal primary education Primary school enrollment Primary completion rate Secondary school enrollment Youth literacy rate % net % of relevant age group % gross % of people ages 15-24 97.42% 98.62% 98.96% 97.33% n/a n/a 114.05% 119.32% 130.22% n/a 97.64% 91.58% 95.86% 103.48 n/a n/a 98.46% n/a n/a n/a Goal 3: Promote gender equality and empower women Ratio of girls to boys in primary and secondary education (%) Women employed in the nonagricultural sector Proportion of seats held by women in national parliament (%) % % of nonagricultural employment % 103.26% 102.42% 101.54% 100.31% n/a 52.00% 52.30% 50.60% 49.90% n/a 3.90% 3.90% 3.90% 14.90% 14.90% Goal 4: Reduce child mortality Under-5 mortality rate Infant mortality rate Measles immunization (proportion of one-year olds immunized, %) per 1,000 per 1,000 live births % 37.20 35.70 34.20 32.90 31.80 30.40 29.30 28.20 27.20 26.40 94.00% 97.00% 98.00% 99.00% 97.00% Goal 5: Improve maternal health Maternal mortality ratio Births attended by skilled health staff Contraceptive prevalence modeled estimate, per 100,000 live births % of total % of women ages 15-49 n/a 74.00 n/a n/a 68.00 n/a 98.80% n/a n/a n/a n/a 54.90% n/a n/a n/a Goal 6: Combat HIV/AIDS, malaria, and other major diseases Prevalence of HIV, total Incidence of tuberculosis Tuberculosis case detection rate (all forms) % of population ages 15-49 per 100,000 people 0 0.10% 0.10% 0.10% 0.10% 0.10% 220.00 214.00 205.00 193.00 181.00 76.00% 77.00% 75.00% 76.00% 84.00% Goal 7: Ensure environmental sustainability Access to improved water source Access to improved sanitation facilities Forest area Terrestrial protected areas CO2 emissions GDP per unit of energy use % of population % of population % of land area % of total surface area metric tons per capita constant 2005 PPP $ per kg of oil equivalent 81.10% 82.30% 83.40% 84.60% n/a 54.60% 55.10% 55.70% 56.20% n/a 7.07% 7.01% 6.96% 6.91% n/a 13.39% 13.78% n/a 13.78% n/a 4.14 4.24 n/a n/a n/a 5.08 5.09 5.72 n/a n/a Goal 8: Develop a global partnership for development Telephone mainlines Mobile phone subscriptions Internet users Personal computers per 100 people per 100 people per 100 people per 100 people 7.07 7.12 6.81 6.32 6.19 84.16 92.54 106.83 120.69 124.18 10.00 10.20 12.50 16.40 17.70 n/a n/a n/a n/a n/a www.aidflows.org , Mongolia Millenium Development Goals