1. 2020en Chiffres
REGION
Groß / Grande
APERÇU
Parts dans
l’ensemble de la
Grande Région
Part relative au
Produit Intérieur Brut (PIB)
de la Grande Région
5%
15%
35%
35%
9%
9%
31%
27%
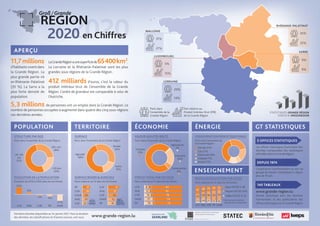
11,7millions
d’habitants vivent dans
la Grande Région. La
plus grande partie vit
en Rhénanie-Palatinat
(35 %). La Sarre a la
plus forte densité de
population.
5,3 millions de personnes ont un emploi dans la Grande Région. Le
nombre de personnes occupées a augmenté dans quatre des cinq sous-régions
ces dernières années.
LaGrandeRégionaunesuperficiede65400km2
.
La Lorraine et la Rhénanie-Palatinat sont les plus
grandes sous-régions de la Grande Région.
412 milliards d'euros, c'est la valeur du
produit intérieur brut de l'ensemble de la Grande
Région. L'ordre de grandeur est comparable à celui de
l'Autriche.
2020
LORRAINE
LUXEMBOURG
SARRE
RHÉNANIE-PALATINAT
WALLONIE
STRUCTURE PAR ÂGE SURFACE VALEUR AJOUTÉE BRUTE CONSOMMATION ÉNERGÉTIQUE FINALE
EMPLOI TOTAL PAR SECTEUR NIVEAU D‘ÉDUCATION PAR ISCED1SURFACE BOISÉE & AGRICOLEÉVOLUTION DE LA POPULATION
POPULATION TERRITOIRE ÉCONOMIE ÉNERGIE
ENSEIGNEMENT
GT STATISTIQUES
Boisée
36%
Agricole
48%
Autre
16%
20–60
ans
52%
60+ ans
28%
<20 ans
20%
Parts dans l’ensemble de la Grande Région
Dernières données disponibles au 1er janvier 2021. Pour la situation
des données, les classifications et d'autres sources, voir sous: www.grande-region.lu
Évolution de 2019 à 2050 dans les territoires
Parts dans l’ensemble de la Grande Région Parts dans l’ensemble de la Grande Région Parts dans l’ensemble de
la Grande Région
Parts relatives en % dans les territoiresParts relatives en % dans les territoires Parts relatives en % dans les territoires
1 International Standard
Classification of Education
23%
6%
-3% -6%
-21%
LUX WAL RP SAARLOR
23
29
33
39
41
LUX
WAL
SAAR
LOR
RP 8
12
14
21
19
10
6
6
5
6
81
81
78
74
73
LUX
WAL
LOR
SAAR
RP
Tertiaire
73%
Agriculture
1%
Industrie
20%
Construction
6%
Pétrole 37%
Charbon 7%
Électricité 18%
Autres 11%
Gaz 27%
1615212421
5956463832
2529333847
SAARRPLORWALLUX
Haut (ISCED 5–8)
Moyen (ISCED 3/4)
Faible (ISCED 0–2)
Les offices statistiques fournissent des
données comparables des statistiques
officielles dans la Grande Région.
5 OFFICES STATISTIQUES
Coopération transfrontalière au sein du
groupe de travail « Statistiques » depuis
plus de 45 ans.
DEPUIS 1974
www.grande-region.lu
Portail statistique avec des données
harmonisées et des publications des
offices statistiques sur la Grande Région.
140 TABLEAUX
14%
20%
41
43
50
51
61
RP
SAAR
LOR
WAL
LUX
STATISTISCHES LANDESAMT
2. 2020in Zahlen
REGION
Groß / Grande
ÜBERBLICK
Anteil an der
Bevölkerung
der Großregion
Anteil am
Bruttoinlandsprodukt (BIP)
der Großregion
35%
35%
9%
9%
11,7 Millionen
Einwohnerinnen und Ein-
wohner hatdieGroßregion.
Der größte Teil lebt in
Rheinland-Pfalz (35%). Das
Saarland hat die höchste
Bevölkerungsdichte.
5,3 Millionen Erwerbstätige arbeiten in der Großregion. Die Zahl
der erwerbstätigen Personen ist in den letzten Jahren in vier der fünf
Teilregionen gestiegen.
Die Großregion umfasst rund 65400km2
.
Lothringen und Rheinland-Pfalz sind die größten
Teilregionen.
412 Milliarden Euro beträgt das
Bruttoinlandsprodukt der gesamten Großregion.
Die Wirtschaftsleistung ist vergleichbar mit
der Österreichs.
2020
SAARLAND
RHEINLAND-PFALZ
ALTERSSTRUKTUR FLÄCHE BRUTTOWERTSCHÖPFUNG ENDENERGIEVERBRAUCH
ERWERBSTÄTIGE BILDUNGSSTAND NACH ISCED1WALD-&LANDWIRTSCHAFTSFLÄCHEBEVÖLKERUNGSENTWICKLUNG
BEVÖLKERUNG FLÄCHE WIRTSCHAFT ENERGIE
BILDUNG
AG STATISTIK
Wald
36%
Land-
wirtschaft
48%
Übrige
Fläche
16%
20–60
Jahre
52%
60+ Jahre
28%
<20 Jahre
20%
Anteile Großregion gesamt
Aktuell verfügbare Daten zum Stand 1. Januar 2021. Datenstand,
Klassifikationen und weiterführende Quellenangaben siehe: www.grande-region.lu
Veränderung 2019 bis 2050 nach Region
Anteile Großregion gesamt Anteile Großregion gesamt Anteile Großregion gesamt
Anteile in den Regionen in %Anteile in den Regionen in % Anteile in den Regionen in %
23%
6%
-3% -6%
-21%
LUX WAL RP SAARLOR
23
29
33
39
41
LUX
WAL
SAAR
LOR
RP 8
12
14
21
19
10
6
6
5
6
81
81
78
74
73
LUX
WAL
LOR
SAAR
RP
Dienst-
leistungen
73%
Landwirtschaft
1%
Industrie
20%
Bau-
gewerbe
6%
Mineralöl 37%
Kohle 7%
Strom 18%
Andere 11%
Gas 27%
1615212421
5956463832
2529333847
SAARRPLORWALLUX
Hoch (ISCED 5–8)
Mittel (ISCED 3/4)
Niedrig (ISCED 0–2)
Die Statistischen Ämter stellen vergleich-
bare Daten der amtlichen Statistik für
die Großregion bereit.
5 STATISTISCHE ÄMTER
Seit mehr als 45 Jahren grenzüberschrei-
tende Zusammenarbeit in der Arbeits-
gruppe Statistik.
SEIT 1974
www.grande-region.lu
Statistikportal mit harmonisierten Daten
und Veröffentlichungen der Statistischen
Ämter zur Großregion.
140 TABELLEN
LOTHRINGEN
14%
20%
5%
15%
LUXEMBURG
31%
27%
WALLONIE
41
43
50
51
61
RP
SAAR
LOR
WAL
LUX
1 International Standard
Classification of Education
STATISTISCHES LANDESAMT