1. www.ccsenet.org/ass Asian Social Science Vol. 7, No. 12; December 2011
Sustainable Maintenance of Navigation Channel: The Case of Port
Tanjung Pelepas (PTP) Port
O. O. Sulaiman
Faculty of Maritime Studies and Marine Science, Universiti Malaysia Terengganu
21030 UMT, Kuala Terengganu, Terengganu, Malaysia
E-mail: o.sulaiman@umt.edu.my, sdin@umt.edu.my
A.H. Saharuddin
Faculty of Maritime Studies and Marine Science, Universiti Malaysia Terengganu
21030 UMT, Kuala Terengganu, Terengganu, Malaysia
E-mail: sdin@umt.edu.my
A.S.A. Kader
Faculty of Mechanical Engineering, Department of Marine Technology, Universiti Technologi Malaysia
81300 Skudai, Johor, Malaysia
Tel: 60-19-717-5860 E-mail: abdsaman@fkm.utm.my
Received: February 28, 2011 Accepted: July 5, 2011 Published: December 1, 2011
doi:10.5539/ass.v7n12p175 URL: http://dx.doi.org/10.5539/ass.v7n12p175
Abstract
Maritime industry is the cradle of all modes of transportation where port is and ship is necessary to facilitate
trading through marine transportation. Human development and demand for international trade has resulted to
need for economic of large scale for ships. Recently, there is continuous growth or need for larger and
sophisticated ship through increasing shipping activities and this has lead to design and production of
sophisticated state of art safety oriented marine vehicle in term of size, speed and structure- albeit, this safety
based designed development is out of phase with conditions of navigation channels. To create a balance for safe
navigation in inland port which are considered to be restricted water, this big ships will ply, it is necessary to
maintain the channel to keep accepting the target largest vessel , and the channel should be maintain at frequency
the ship building are growing. This paper presents the result of application of best practice simplified method for
channel maintenance against vessel design and reception requirement. The model is used to calculate channel
dept requirement to be maintain for Port Tajun Palapes (PTP) in Johor, Malaysia which arrived at 15.2. The
paper also discusses reservation regarding sustainability reservation requirement for channel maintenance
Keywords: China insurance industry, Foreign fund, Challenge
1. Introduction
Recent time has proved continuous growth or need for larger and sophisticated ship through increasing shipping
activities and demands, this has lead to design and building of sophisticated, state of the art, safety oriented
marine vehicles in term of size, speed and structure, albeit, the design and production of vessels take little
consideration in phasing them with navigation channel requirement of waterways. To create a balance for safe
navigation in restricted water these big ships will ply, we must maintain the channel at a frequency the ships
building are growing. Maintenance dredging is the activity that involve periodic removal of material which has
been deposited in an area where capital dredging has been undertaken, The frequency of maintenance dredging
varies from port to port, however, the objective remain to allow ships to enter and leave port at stated draft
without delay and ensure efficiency of maintenance dredging, thus step must be taken during the process to
minimize siltation and shoaling in channel.
Published by Canadian Center of Science and Education 175
2. www.ccsenet.org/ass Asian Social Science Vol. 7, No. 12; December 2011
1.1 Shipping trend
Ships and shipping remains a very important instrument for mobility, if ships could no longer transit the
waterways, the people will experience shortages of power, heat and food in days or weeks at the outside. Recent
years have seen economic of scale due to improved trade, the significance of these trends is that larger ships will
continue to use our waterways for the foreseeable future. But there are limits on size of ship that a channel can
accommodate, and means of determining when special measures must be imposed on handling ships in order to
ensure the continued safe, efficient, and environmentally friendly use of our channel.
To create a balance for safe navigation in restricted water this big ship will ply, and the channel at a frequency
the ship production are growing must be maintained. Recent study provided data on the explosion in the size of
container ship that has occurred since the first “post Panama “ vessel analysis shows that ships exceeding the
panama canal limit (ship length , breath draught of 256mx32.2x11m) started to appear a few years ago. Other
study mad by transmarine also demonstrated that recent time is seeing vessel of size up to 18,000TEU
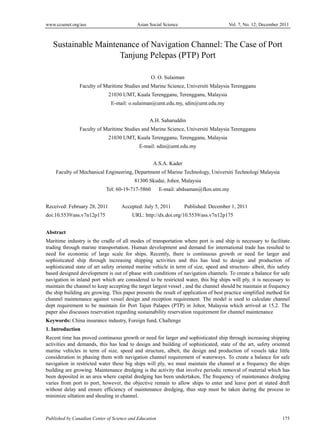
Mongelluzo (2005. See figure 1 for growing size of ships as presented by Transmarine.
<Insert Figure 1 Here>
RINA periodic recently report that Maesrk line has built 14, TEU ship that is ready for operations, however, safe
operation of those big will be operated remain is under deliberation. This show the rapid the growing trends of
container vessels and need of channel to match this growth. Recent projection is looking at 18,000 TEU Which I
believe the technological capability is there for such target. As the ship sizes are increasing it is imperative to do
periodic examinations of the requirement of the channel in regards to depth, width, squat, and alignment. Figure
2 shows the needs of the channel.
Channel design and maintenance work fall among the works that require multivariable exercise that need model
studies for good outcome. Shoaling remaining unavoidable part of most harbor and navigation channels and one
method to preventing shoaling and associated siltation hurdles is using of maintenance dredging at economical
frequency and sustainable manner .other study on ship size in respect to channel stressed on the fact that the
design of controllability of the ship is equally out of match with the size of the ship, all what has been the main
focus on design spiral is best design of basic requirement of speed, payload and endurance - focus is not placed
neither on channel design nor its maintenance Talley (2000)..
1.2 Present threat
Growing size of fleets and lack maintenance of channel has been going in human society for a long time,
(INTERTANKO report in 1996 on the same issue regarding US water). Analysis drawn from marine departments
revealed that disasters records of the Strait of Malacca collision where grounding takes the highest share of the
risk, Risk in the Strait of Malacca. Norske Veritas study on various navigation water ways put present the Strait
of Malacca as one of the high risk areas of the world. This issue is considered very necessary and required
diligent attention, especially in protected water and restricted water like the needy patronized Strait of Malacca
and its riparian which PTP is part of – where more than 800 ships pass through there a day, accident and
causality figure by Malaysian marine department.
Analysis made by the UNEP regarding region under coastal threat concluded that Asia coast is far more affected,
because Asia have the largest river runs off to the sea than any other continent. According to UNEP report
maintenance of navigation channel remains one sensitive area of environmental degradation concern for
environmental thematic problem especially dredging, its disposal disturbance to marine life Burt, et. al. (1997).
<Insert Figure 2 Here>
1.3 Pollution source and impacts to port
The pollution found in the sediments that accumulate in harbors is one of the main causes of environmental
impact of dredging operations. This is important feature since harbor waters and sediments are heavily polluted
worldwide- containing high levels of a range of chemicals. The sources of pollution are multiple; in many cases
they are linked to the harbor activity. TBT (tributyltin), is a compound used as antifouling that has been
recognized as a harmful pollutant and whose use has been restricted at the international level. However, the
problems caused by TBT will continue for many years, because TBT is kept stored in the harbor sediments. The
main source of TBT to marine waters is the direct release from surfaces treated with antifouling paints
containing TBT and other organotin compounds Csiti, et al (1999).
They have been used in order to prevent the attachment of aquatic organisms on the hull of ships or other devices
that are immersed in the sea, such as the cages used for fish-farms (Evans, 2000). Paints incorporating TBT are
176 ISSN 1911-2017 E-ISSN 1911-2025
3. www.ccsenet.org/ass Asian Social Science Vol. 7, No. 12; December 2011
regarded as the most effective antifoulants ever devised giving rise to important economic benefits. Their use
reduces the fuel consumption of the vessels (and thus reduces CO2 emissions), ships can go faster, and
repainting costs are lower. Little is still known of the effects on marine organisms of dredging operations
contaminated sediments, and the need of research on this issue is often claimed Evan (2000).
To assess the potential impacts of a certain project is a difficult task. First, although the (a priori) main possible
impacts of dredging can be identified, clearly it is not possible to review all the potential effects;, once the
impacts of concern are selected, it might be costly, complex or impossible to assess the extent and the
consequences of each of the effects caused by the activity assessed.. Consequently, the dredging operation causes
the resuspension of sediments, solids in water to some extent produces an effect called turbidity, which is
defined as an optical property of water related to attenuation of light (Peddicord and Dillon, 1997). Other factors
influence the level of turbidity (such as size distribution and shape of particles). Although, they are regarded as
“short-term” impacts, the presence of large quantities of particles in the water can cause serious effects in areas
where the system is not used to it, and particularly to sensitive species or areas (for example, coral reefs or
aquaculture ponds), as well as reduction of oxygen in water, release of toxic components from suspended solid,
covering of organisms, reducing food supply, etc (Bray, 2001). Moreover, lack of light may reduce
photosynthesis, which might be relevant for sensitive species.
This make it incumbent for authorities concerned regarding waterways to evaluate and address the risks
associated with ships that are plying them and find way and information sharing avenue systems for channel
designers, naval architects, ship masters and pilots, and waterway managers that will help develop policy
recommendations that will address the way channels are laid out, enlarged and how ships of various types using
them should be designed and handled Funtowicz (2004).. And of course, ways to monitor existing and new ships
operating at channel approach in order to guide ship designers to understand and review ships, pilotage, channel,
current design and operational practices on how to incorporate needed improvements Bridges (2001).
2. The Case of Port Tanjung Pelepas
The Port Tanjung Pelepas of the Sungai (river) Pulai located in Malay Peninsula’s most southern tip in the State
of Johor, close to the new Malaysia-Singapore Second Crossing, a new 1800-metre bridge linking Singapore
with Malaysia’s. The port development at Tanjung Pelepas is one unique state of art capital project design work
done on sensitivity and helps transform the river and mangrove area in 1998 into one of the world’s most
equipped container port. it remain one the significant implementation of Malaysian VISION 2020 plan, a 60
years concession 60-year concession for 800 ha port with Free Zone Status was made to Seaport Terminal
(Johor), under operation of her subsidiary company, Pelabuhan Tanjung Pelepas Sdn. Bhd of by Malaysian
Government and syndicate of banks agreement of RM 2 billion loan. The port has stimulated rapid development
in the region stretching from state capital Johor towards the west along the Johor Straits; it has changed the
region to developed area with excellent infrastructure, housing facilities and new areas for industrial
development.
<Insert Figure 3 Here>
What necessitated the port development initiative is again the demand and growth since the seventies, with
forecast for potential critical capacity problem by the year 2000. The Johor Port Authority reached maximum
expansion of the Port area with the completion of Phase 4 of Pasir Gudang studies in 1990 end up with selecting
Tanjung Pelepas as the most suitable location for Johor’s.
2.1 Previous dredging work
The initial main dredging work done on Phase 1 of PTP development towards complementing a fully operational
Container Terminal by end of 1999For the Dredging and Reclamation scoped for the removal by dredging of
existing soft material to provide an approach channel, turning basin and bund foundation area and construction
of the Wharf Bund and filling of the terminal and infrastructure areas to provide a stable platform for the
Container Area. Summary of work done is as follows:
i. Year 1997; Contact cost - US$ 158 million
ii. 200 hectares of Site Clearance, mangrove and bush clearing; Additional Site Investigation;
iii. Dredging of the 9-km long approach channel and turning basin, approx. volume 16,000,000 m3;
iv. Dredging to foundation level below Wharf Bund, approximate volume 5,500,000 m3;
v. Constructions of the Wharf Bund, approx. volume of sand 4,000,000 m3;
vi. Installation of 20,000,000 meters of wick drains as ground treatment;
Published by Canadian Center of Science and Education 177
4. www.ccsenet.org/ass Asian Social Science Vol. 7, No. 12; December 2011
Reclamation and surcharge of Phase 1 Area, Terra et Aqua – Number 80 – September 2000foundation area and
construction of the Wharf Bund and filling of the terminal and infrastructure areas to provide a stable platform
for the Container Area. Summary of work done is as follows :
vii. Year 1997; Contact cost - US$ 158 million
viii. 200 hectares of Site Clearance, mangrove and bush clearing; Additional Site Investigation;
ix. Dredging of the 9-km long approach channel and turning basin, approx. volume 16,000,000 m3;
x. Dredging to foundation level below Wharf Bund, approximate volume 5,500,000 m3;
xi. Constructions of the Wharf Bund, approx. volume of sand 4,000,000 m3;
xii. Installation of 20,000,000 meters of wick drains as ground treatment;
xiii. Reclamation and surcharge of Phase 1 Area, Terra et Aqua – Number 80 – September 2000
The construction, completion, maintenance of the Dredging and Reclamation Works involved the dredging of
16,000,000 m3 of soft and stiff material to form a 12 km Access Channel and Turning Basin, together with the
dredging of 5,500,000 m3 of soft to medium material from a trench to form the base for the new Wharf Structure.
The initial activity concentrated on dredging an access of 12 metres deep, 100 metres wide and approx. 5000
meters long (pre-dredging depth only approximately 4 metres by low tide) to allow the jumbo hopper dredgers to
reach the Site. Dumping ground -in the Malacca Straits northwest of Karimun and along the coast of Pontian up
to 120 km from The Sand was won from Karimun southeast. The most economical filling method for the bund
would have been:
i. Filling up to –6 to –7 CD direct dumping from a hopper dredger;
ii. From –6 to –7 to +4 CD rainbowing;
3. Channel Maintenance Process
Within the scope of this project the main elements that method will be faced are analysis of:
i. Channel dimension establishment through navigation requirements and Side slope tolerant
ii. Hydrographic and dredge volume concept , Calculation of yearly dredge quantity output
iii. Dredge capacity and selection of dredge equipment
iv. Disposal of dredge material, issue of transport distance and sustainability concept
v. Concept of uncertainty, risk cost and benefit assessment
<Insert Figure 4 and Figure 5 Here>
3.1 Navigation requirement
Having got various vessels to channel equipment ratio, what the size of the channel should be and how much to
dredge down can actually be determined.
3.2 Maintenance dredging requirement
Analysis will go through iterative round of all the thematic part of the project:
i. Need for channel maintenance
ii. Old, Current and new practice
iii. Technological change and opportunity
<Insert Figure 6 Here>
Recommendation for channel deepening work requires the following:
i. Loaded vessel draft / Squat, this involve the hydrodynamic sinking effect of lowering vessel keel
relative to channel bottom with speed.
ii. Wave induced motions, Safety clearance , Dredging tolerance
iii. Advance maintenance dredging
To determine this iterative process with regulatory requirement, necessary projection base on the following data
parameter as shown in the framework for depth calculation will be performed.
<Insert Table 1 Here>
178 ISSN 1911-2017 E-ISSN 1911-2025
5. www.ccsenet.org/ass Asian Social Science Vol. 7, No. 12; December 2011
<Insert Figure 7 and Figure 8 Here>
This three studies have been done prior to establishment of PTP prior to the initial capital, however to maintain
and capital dredging techniques for channel use similar process. Thus, methodology varies, and simplicity itself
remains the beauty of design.
3.3 Baseline Data Analysis
The input parameters are used to develop the requirements and design considerations for channel width and
depth, as demonstrated in the flow chart shown above which proves detail on the width and depth parameters.
Input data is captured from baseline studies that are undertaken involving an analysis and evaluation of the
following data supplied by PTP:
4. Pressure Need for Navigation Optimizing Navigation Channel, Economic and Fairway Analysis
The optimum channel depth requires studies of estimated costs, benefits and risk of various plans and alternative
designs considering safety, efficiency, and environmental impacts in order to determine the most economical,
functional channel alignment and design depth .Channel deepening design is often one of the major
cost-determining parameters for navigation project and design of such depth is of various types that require
adaptability of each design to future improvements for increased navigational capability.
<Insert Figure 9 and Figure 10 Here>
The optimum economic channel is selected from a comparison of annual benefits and annual costs for each
channel maintenance plans. Deeper channels will permit the use of larger ships, which are more economical to
operate.
4.1 Cost, benefit and depth increase
In respect to PTP and channel maintenance work the following economic analysis based on need and projection
datas analysis represent the demands stage of this work for the fairway.
<Insert Figure 11 Here>
Studies made by W. Winkelman estimated time saving in hour as a consequence of deepening of river Scheldt by
4 feet is as follows:
<Insert Figure 12 Here>
4.2 Channel dimensioning: navigation vessel and channel requirement
This involves the input variables required, to determine the minimum waterway dimensions required for safe
navigation.
4.2.1 Vessel requirement
The critical component in the design of the waterway is the selection of the "target" vessel. In evaluating the
waterway manoeuvring parameters, the target vessel is normally the largest vessel that the waterway is expected
to accommodate safely and efficiently. The largest vessel that has plied PTP is 340m, and the channel is
expecting to receive 420 m vessel.
<Insert Figure 13 Here>
4.2.2 Water level and depth of the waterway
<Insert Figure 14 Here>
For channel to accept ships there must be corresponding depth required to maintain vessel manoeuvrability.
Therefore, minimum value for water depth/draught ratio is necessary to for assurance and reliability.
<Insert Table 2 and Table 3 Here>
5. Results
Total Depth calculation: The design (authorized) depth will include the various allowances as shown in Figures.
Advance maintenance and dredging tolerance are provided in addition to the design depth.
Minimum Waterway Depth for safe navigation is calculated from the sum of the draught of the design vessel as
well as a number of allowances and requirements. The Canadian model the following recommended Canadian
model formula is used.
Actual Waterway Depth = Target Vessel Static Draught + Trim + Squat + Exposure Allowance + Fresh Water
Adjustment + Bottom Material Allowance + Over depth Allowance + Depth Transition - Tidal Allowance, (see
Published by Canadian Center of Science and Education 179
6. www.ccsenet.org/ass Asian Social Science Vol. 7, No. 12; December 2011
Figure 5: Components of Waterway Depth).
Channel (Advertised) Waterway Depth = Waterway Depth - Over depth Allowance
<Insert Table 4 Here>
5.1 Channel depth calculation for PTP
<Insert Table 5 Here>
Alternative equation for validation by UNDP
H=D+Z+I+R+C+#
5.2 Squat calculation
<Insert Figure 15 Here>
5.3 Maintenance dredging capacity - sediments output and estimates
Maintenance dredging with objective to reduce channel delay, accept big ship to be done in environmental
sustainable manner and optimal efficiency –in maintenance dredging quantifying the loss of depth pave wave for
dredging requirement to be determined and this lead to optimal choice of dredger. Thus PTP is a new port with
very big clearance to accept third generation ships, personal communication with the health, safety and
environmental department there also confirmed regular survey for siltation towards planning to maintain balance
which is put at 2- 3 year for now( personal communication. Issue relating to investigation or communication
about what size vessel will ply the channel in the 10 years is rarely discussed by channel workers, and this is a
big issue and what to in such case should be a big issue.
Generic calculation on data results from analysis of:
i. Vessel and channel requirement
ii. Channel dimension
iii. Hydrographic data
iv. Basic rate output of the dredger
v. Computation of volume
vi. Cycle time and Number of work day per year
vii. Working condition and Environmental discounting
Where:
Output = number of cycle per day X load factor x hopper capacity x number of working day
Load factor = volume/ hopper volume
Number of working day per year= 365 days
For PTP:
<Insert Table 6 Here>
Alternative equation for validation (USACE) -> V=0.5x (A1+A2) x (S2-S1)
5.4 Dredger selection
Hydraulic dredgers, for example, are based in the use of pumps for raising the materials (suction dredgers). The
dimension of dredging as an economic activity itself at the global level is considerable. The other main group is
that of mechanical dredgers. Such as the backhoe Previous PTP dredging work was made using state of art
combo slip hopper barge dredger, uniqueness in this dredger stand on capacity to contain dredge material while
in operation, transit until disposal location, (personal communication).
Split hopper dredger is a modern hydraulic excavator, mounted on a platform fixed to the seabed. The material is
excavated by the bucket of the excavator, kept and contained. Then is raised above water and transported directly
to the disposal site. The soil at PTP is basically silt and mud, and the dredgers well sweated for this. Accuracy is
only achieved if monitoring and control equipment are used. Thus, the containment has guarantee of no leakage
during transportation.
The volume of soil is very important in dredger selection, a smaller and more economic and environmental
sustainable dredger is preferred.
180 ISSN 1911-2017 E-ISSN 1911-2025
7. www.ccsenet.org/ass Asian Social Science Vol. 7, No. 12; December 2011
<Insert Table 7 Here>
Considering PTP specification grab hopper is a good choice of dredger, for maintenance dredging. Traditionally,
dredging quantities for purposes of design estimates and construction payment have been obtained from
cross-sectional surveys of the project area. These surveys are normally run perpendicular to the general project
alignment at a predetermined constant spacing. The elevation data are plotted in section view along with the
design/required depth and/or allowable over depth templates. One or more reference or payment templates may
be involved on a dredging project (e.g., zero tolerance, null ranges, etc.). Given sectional plots of both
preconstruction and post construction (as-built) grades (or, in some cases, intermediate partial construction
grades), the amount of excavated (cut) or placed (fill) area can be determined at each cross section. Figure shows
the typical templates used to compute relative cut/fill quantities.
6. Conclusion
Conclusively, in regards case studies and the discussion presented here, I would like to highlight some of the
main lessons that I think might be extracted from them. They are reflections that hopefully could be helpful for
understanding the meaning and relevance simplified monitoring procedure, understanding and the concept
sustainability in practical cases of environmental management. The model tested in this work from the records
will allow us a first look at the simple system for monitoring the channel and to draw the following conclusions,
The depth of the channel is large; approximately 16m x 420 and taking ships in the order of approximately
350-420m LOA But there is tendency that the channel wil soon get close to its limit. The rate of design ship to
the channel state still exhibits non-linear behavior; bigger ship is coming there and the channel remains the same.
The best that could be done is removing the shoal. 20m is projected against 2020, to meet the demand, however
but. Critical study and employing a sustainable risk based methodology with good record of environmental
change rationalization will be necessary .The phenomena of squat its effect are of major importance to the
system ,applying simplifies model tested in this work could help close monitoring towards reliability and
confidence of the channel .
Approximately 600,000 million cubic yards of sediment will be dredged annually from the navigable water, and
the condition environmental change of such sediment required. The contaminants of concern and their risk to the
environment and to humans will vary widely depending upon site-specific factors ranging from ecological
habitat to sediment particle size distribution. The soft alluvium in previous work allowed consolidate under high
surface loads, resulting in settlement of finished ground surfaces, however continuous analysis on geo-technical
engineering studies will always be required to complement sustainable planning work. Facing capacity
difficulties are issue of concern everywhere today particularly the fate of the channels. Demand for ship has
approached supply and the tradeoffs will be more and more carefully scrutinized by the resources available and
environmental demands. The channel is very important for land and land use, and safety linked to environment
required, as demands of the ship increase so does the need for system integration at local and international level.
7. The Way forward
Waterways development need to have a strategy for the future of its marine structures program by examining the
removal of non-core operations, and negotiate responsibilities for water depth forecasting with the Hydrographic
Department. The case tests how to develop plans for simple waterways performance measurement information
system, it is recommended that such method could be incorporate could tap existing information and
communication to link reporting system of data to National Channel Inventory system. Such system could be
implemented in line with the accountability framework), in order to provide improved monitoring and
performance reporting capability on measures and indicators such as: channel monitoring level of service
compliance; subject matter expertise level of activities; timeliness of notification to mariners; and actual repairs to
structures versus required. Under doctrine of sustainability, it has been widely accepted that new approach to
design and maintaining system should focus on top down risk based, whose matrix will holistically cover all issues
of concern including uncertainty. Uncertainty itself remains a big issue who’s definitional and framing fall under
complex circumstance. Future studies on this work then lies on issue of risk based assessment for channel design
and decision support system, simple data inventory system, system integration, and extensive studies that cover
type of uncertainty that exist.
References
Bray, Nick. (2001). IADC-CEDA Guide 7, Frameworks, Philosophies and the Future. The Hague, The
Netherlands. pp. 35-38. EPA Guidance Manual, Turbidity Provisions, April 1999. [Online] Available:
http://www.epa.gov/volunteer/stream/vms55.html
Published by Canadian Center of Science and Education 181
8. www.ccsenet.org/ass Asian Social Science Vol. 7, No. 12; December 2011
Bridges, J. W. and Bridges, O. (2001). Hormones as growth promoters: the precautionary Principle or a political
risk assessment? In: Late lessons from early warnings: the precautionary principle 1896-2000. European
Environmental Agency (ed.) Environmental Issue report No 22.
Burt, N., C. Fletcher, and E. Paipai. (1997). Guide 2B. Conventions, Codes and Conditions: Land Disposal.
Environmental Aspects of Dredging. IADC and CEDA (eds.) TheNetherlands.
Craye, M. (2004). Interactive uncertainty assessment through pedigree-based tools: what, why and how?
European Commission-Joint Research Center. Ispra. Italy.
Csiti, A. and Burt, N. (1999). Guide 5. Reuse, recycle or relocate. In: Environmental Aspects of Dredging. IADC
and CEDA (eds.). The Netherlands. Proceedings of the International Symposium on Uncertainty and Precaution
in Environmental Management. Technical University of Denmark. Copenhagen, June 2004.102
Evans, S. M. (2000). Marine Antifoulants. In: Seas at the Millennium: An Environmental Evaluation. Sheppard,
C. (ed.). Elsevier Science, pp. 247-256.
Funtowicz, S. O. (2004). Models of Science & Policy: From Expert Demonstration to Post Normal Science.
Proceedings of the International Symposium on Uncertainty and Precaution in Environmental Management.
Technical University of Denmark. Copenhagen, June 2004.
Gibbs, P. E., Bryan, G. W., Pascoe, P. L. and Burt, G. R. (1987). The use of the dogwhelk (Nucella lapillus) as an
indicator of TBT contamination. Journal of the Marine Biological Association of the United Kingdom, 67:
507-524, 103.
Mongelluzo, Bill. (2005). Landside Logjam: New generation of big ships will force ports, railroads to change
operations. Journal of Commerce.
Peddicord, Richard and Dillon, Thomas M. (1997). IADC-CEDA Guide 3, Investigation, Interpretation and
Impact. The Hague, The Netherlands. pp. 53-55.
Talley, Wayne K. (2000). Ocean Container Shipping: Impacts of a Technological Improvement. Journal of
Economic Issues, Vol. 34, No. 4, December.
U.S. Port and Terminal Safety Study. (1996). INTERTANKO/
UNEP. (2008). [Online] Available: http://www.grid.unep.ch/activities/assessment/indianocean_crisis/index.php
Table 1. Navigation depth parameters requirement
Depth parameters Subparameters
Draught vessel static draugh
Trim Vessel depth
Squat Vessel speed, draught, channel depth, block coefficient
Exposure Vessel size, traffic density, local wave climate
allowance
Fresh water Water salinity and vessel size
allowance
Maneuvering
allowance Channel bottom, operational characteristics, vessel speed and controllability
Overdepth Nature channel bottom, dredging tolerant and siltation
allowance
transition Depth Sudden change in channel depth
allowance
Tidal allowance
Reference datum, highest and lowest level tidal window
182 ISSN 1911-2017 E-ISSN 1911-2025
9. www.ccsenet.org/ass Asian Social Science Vol. 7, No. 12; December 2011
Table 2. PTP channel parameters
Width 250
Manoeuvring lane 1.6 to 2.0 times vessel beam
The ship clearance lanes 80% of the vessel beam
Bank clearance 80% of vessel beam is added to both sides of the channel
Depth 12.5m (Bellow MLLW) related to LAT
Under keel clearance 1m
Safety clearance O.3
Advanced maintenance 0.5m
dredging Allowance
Turning basin 600m
TEU estimate 6000 TEU
Berth 18m below LAT with containment dike for future dredging
Projection 350m wide by 20m with turning basin of 750m diameter
Side slope 1:8 to 1:6 vertical: horizontal) for silt and mud- assumption at
1:10, depending on material
Table 3. Environmental criteria [PTP]
POS PARAMETER DATA/SIZE/DIMENTION SOURCE
MAX WIND SPEED DURING MASTER PLAN
14.3.1 VESSEL BERTHNG 22M/S VOL.2
MASTER PLAN
14.3.2 MAX WIND AT BERTH 27.7M/S VOL.2
MAX SIGNIFICANT WAVE MASTER PLAN
14.3.3 HIGHT Hmax=1.2m VOL.2
SELLHORN WIND
WAVE PERIOD Ts =4-5 sec WAVE CAL.
MASTER PLAN
14.3.4 MAX. RIVER CURRENT 1.0m/s VOL.2
Table 4. PTP Water depth
Published by Canadian Center of Science and Education 183
10. www.ccsenet.org/ass Asian Social Science Vol. 7, No. 12; December 2011
Table 5. Channel depth calculation
Table 6. Dredge output for PTP
1. Number of cycle 4- 5 per day,
2. Hopper capacity = 2500- 5000/6000
3. Number of days = 150,000/6000
4. Volume of maintenance dredging = 300,000-400,000 for 3 years
5. Load factor= 150,000/year
6. Output = 150,000/5000=30,000
Table 7. Below is guideline for dredger selection given by [UNDP]
Site conditions Cutter Bucket Standard Grab Bucket Grab
Suction Wheel Trailer Hopper chain
Bed arterial
Loose silt 1 1 1 2 2 2
Cohessive silt 1 1 1 1 1 1
Fine sand 1 1 1 2 2 2
Meiumm sand 1 1 1 2 2 2
Coarse sand 1 1 1 2 2 2
Sea conditions
Enclosed water 1 1 3 1 2 2
Shelter water 1 1 1 1 1 1
Exposed water 3 3 1 3 3 N
Disposal to:
Shore 1 1 2 N 2 1
Sea N N 1 1 1 1
Quantities
100,000 cubic meters 1 1 2 1 2 1
250, 000 cubic meters 1 1 1 1 1 1
500,000, cubic meter 1 1 1 2 1 1
>500,000 cubic meter 1 1 1 3 1 3
1- Suitability 2- Acceptability 3- Marginal N – unsuitability
184 ISSN 1911-2017 E-ISSN 1911-2025
11. www.ccsenet.org/ass Asian Social Science Vol. 7, No. 12; December 2011
Figure 1. Vessel size increase [Transmarine, 2005]
C h a n n e l - c o n d i t io n n e e d
b o tt o m m a t e r ia l c h a r a c te ri st ics ;
de pth ;
c u r r e n t v e lo c it y a n d d ir e c t io n ;
A lig n m e n t s w in d ve lo cit y a n d d ir e c tio n ;
w a v e h e ig h t ; a n d n a v ig a t io n
4 a id / p ilo t se r v ice .
Q8
P o rt K la n g
Q 2 Q1
Q Squa t C ha nnel D epth
4 Q3
1 3
2
Q 7
Q Q or t
P5 d ic k s o n
w h er e: 6
Z = s qu at;
d = ves s el dr au gh t; M a la c ca
D = c h an n el d ep th ;
M o b il e B a y e l npe a n;c e
P e n s a c ol a P a ss W id t h
V s = ve ss E s tr ed
g = gr avi ty a c c el era ti on ; 5
W = c h ann e l w i dth ; 1
B = ve s s el b ea m ; an d
Q A BC
F w = c h an n el w i d th fa c tor .
W i th F w = 1 , w h e re W > 9 . 61 B ;
a , b , c ar e c om m on c o effi c i en ts :
a = 0. 2 98 , b = 2. 28 9 , c = -2 . 97 2
, w h er e W < 9 . 61 B ; an d
S q ua t r e f e r s to t he in cr e a se o f a sh ip ' s d r a ug ht
5 /1 4 /2 0 0 6 e s u l t o f i t s m o ti o n t h r o u g h w a te r.
as a r
Figure 2. The Strait of Malacca and channel requirement
Published by Canadian Center of Science and Education 185
12. www.ccsenet.org/ass Asian Social Science Vol. 7, No. 12; December 2011
Figure 3. Port Tanjung Pelepas Map
Research method and outcome
Investigation+comparison+evaluation=outputs
Efficient operations
Efficient operations
Through
Through
Public
Public
Environment
?
Environment 1. use of large ships
1. use of large ships
cost
cost 2. reduced transit time
2. reduced transit time
Analysis 3. Reduce insurance rate
3. Reduce insurance rate
Analysis 4. use of water transportation
Mitigation 4. use of water transportatio
Mitigation
Options
Options
sustainability
sustainability Selection
Selection Multi-cost reduction
Multi-
Maintenance Multi-cost reduction
Maintenance Through
Through
ship
ship 1. reduce tug service cost
1. reduce tug service cost
2. Reduce accident rate
2. Reduce accident rate
regulations
regulations
3. Reduce storage cost
3. Reduce storage cost
channel 4. Efficient monitoring
4. Efficient monitoring
channel
5/4/2006
Cost benefit output
Figure 4. Navigation channel maintenance process
186 ISSN 1911-2017 E-ISSN 1911-2025
13. www.ccsenet.org/ass Asian Social Science Vol. 7, No. 12; December 2011
Components of Each Stage
Demand studies
Analysis
Comparative •Impacts and risk
• Need for channel design
studies •Cost benefit
•Current procedures
•Literature survey •Alternatives
•New procedures
•Case study •Water boundary
survey •comparative studies, and
•interview technological change
• opportunity model
Requirements •Mitigation
• vessels requirements •option
• Monitoring
•Channel requirement
•Regulatory requirements
Recommendation
•Environmental requirements
• maintenance
•monitoring
5/4/2006
Figure 5. Components of each stage
Method – navigation requirement
Data +
Baseline data
Case studies
Questionnaire survey
*To identify the
limitation of the
existing methods
*To acquire actual
examples on the size
of the research
problem
** PTP will be used-
port of Netherlands
and and
west African rivers
5/4/2006
will be use for min-
max comparison
Figure 6. Navigation parameters
Maintenance planning
Output calculation Dredger capacity Selection of dredgers
Figure 7. Maintenance dredging components
Published by Canadian Center of Science and Education 187
14. www.ccsenet.org/ass Asian Social Science Vol. 7, No. 12; December 2011
Sustainability
Economics Environmental Technical
Figure 8. Dredging and sustainability Process
2020 Cargo projection -Total
Container (teu)-PTP
6,000,000
5,000,000
Container 4,000,000
3,000,000
(teu) 2,000,000 Total Container
1,000,000 (teu)
0
1999/2000 2020
Years
Figure 9. Port output projection
Fairway analysis
Series1
600 Series2
S5 Series3
400
S4 Series4
S3 Series5
200
S2
S1
0
Depth DWT
Figure 10. Fairway analysis- Source PTP
188 ISSN 1911-2017 E-ISSN 1911-2025
15. www.ccsenet.org/ass Asian Social Science Vol. 7, No. 12; December 2011
$900
$800
$700
$600
$500 34-38
$400 38-40
$300 >50
$200
$100
$0
Cost per hour for given draught
Figure 11. Hourly cost of vessel [UNDP]
Studies made by W. Winkelman estimated time saving in hour as a consequence of deepening of river Scheldt by
4 feet is as follows
$900
$800
$700
$600
$500
34-38
$400
38-40
$300
>50
$200
$100
$0
Cost per In going Outgoing
hour
Figure 12. Estimated time due to deepening
Published by Canadian Center of Science and Education 189
16. www.ccsenet.org/ass Asian Social Science Vol. 7, No. 12; December 2011
Trend Ship port and and size
400
350
300
250
200
150
100
50
0
Day Longest LOA Number of ships
Figure 13. Trends ship calling port , shows trend for day time, longest ship and number of ships calling at PTP
[PTP]
Figure 14. Channel depth allowance
190 ISSN 1911-2017 E-ISSN 1911-2025
17. www.ccsenet.org/ass Asian Social Science Vol. 7, No. 12; December 2011
Squat as a function of speed.
Huuska-ICORELS, coefficients 1.7, 2.0 and 2.4.
SQUAT (Co = 1.7) SQUAT (Co = 2.0) SQUAT (Co = 2.4)
0.0
0.2
0.4
0.6
0.8
1.0
1.2
1.4
1.6
1.8
2.0
Squat, m
2.2
2.4
2.6
2.8
3.0
3.2
3.4
3.6
3.8
4.0
4.2
4.4
4.6
4.8
5.0
5.0 6.0 7.0 8.0 9.0 10.0 11.0 12.0 13.0 14.0 15.0
Speed (knots)
Figure 15. Squat calculation
Published by Canadian Center of Science and Education 191