
Empfohlen
Empfohlen
Weitere ähnliche Inhalte
Ähnlich wie OECD-FAO Agricultural Outlook 2020-2029
Ähnlich wie OECD-FAO Agricultural Outlook 2020-2029 (20)
Kürzlich hochgeladen
Kürzlich hochgeladen (20)
OECD-FAO Agricultural Outlook 2020-2029
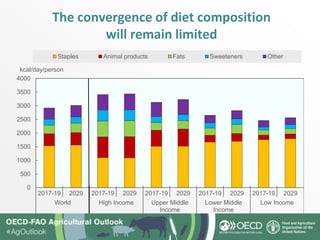
- 1. The convergence of diet composition will remain limited 0 500 1000 1500 2000 2500 3000 3500 4000 2017-19 2029 2017-19 2029 2017-19 2029 2017-19 2029 2017-19 2029 World High Income Upper Middle Income Lower Middle Income Low Income kcal/day/person Staples Animal products Fats Sweeteners Other
- 2. Per capita consumption of main food groups (protein equivalent), by income group 0 20 40 60 80 100 120 2017-19 2029 2017-19 2029 2017-19 2029 2017-19 2029 2017-19 2029 World High Income Upper Middle Income Lower Middle Income Low Income g/day/person Staples Animal products Other
- 3. Limited change in the structure of commodity demand 0 200 400 600 800 1000 1200 1400 2017-19 2029 2017-19 2029 2017-19 2029 2017-19 2029 2017-19 2029 2017-19 2029 2017-19 2029 2017-19 2029 2017-19 2029 2017-19 2029 2017-19 2029 Maize Other coarse grains Rice Wheat Oilseeds and products Pulses Roots and tubers Meat Dairy Fish Sugar Mt Food Feed Fuel Other uses Crushing of oilseeds is not reported as the uses of 'vegetable oil' and 'protein meal' are included in the total; Dairy refers to all dairy products in milk solid equivalent units; Sugar biofuel use refers to sugarcane and sugarbeet, converted into sugar equivalent units.
- 4. Population growth main driver of demand growth 0.0 0.5 1.0 1.5 2.0 2.5 3.0 3.5 4.0 4.5 2010-19 2020-29 2010-19 2020-29 2010-19 2020-29 2010-19 2020-29 2010-19 2020-29 2010-19 2020-29 Cereals Meat Fish Fresh dairy Sugar Vegetable oil % Due to per capita demand growth (food & other uses) Due to population growth
- 5. Limited growth in demand for biofuel feedstock (share of biofuel feedstock in total use) 0 10 20 30 40 50 60 2017-19 2029 2017-19 2029 2017-19 2029 2017-19 2029 2017-19 2029 2017-19 2029 2017-19 2029 2017-19 2029 Cereals Maize Wheat Other coarse grains Sugarcane Vegetable oil Molasses Roots and tubers %
- 6. Growth in crop production mostly come from higher yields -120 -60 0 60 120 180 240 300 360 420 480 540 -10 -5 0 5 10 15 20 25 30 35 40 2010-19 2020-29 2010-19 2020-29 2010-19 2020-29 2010-19 2020-29 2010-19 2020-29 2010-19 2020-29 Asia Pacific Sub-Saharan Africa Near East and North Africa Europe and Central Asia North America Latin America Mha% Growth in land use Growth in multi-cropped land Growth in yields Area harvested in 2029 (right axis)
- 7. Livestock production will grow faster than animal numbers, as feed use grow -0.5 0.0 0.5 1.0 1.5 2.0 2.5 3.0 Production Animalnumbers Production Animalnumbers Production Animalnumbers Production Animalnumbers Production Animalnumbers Pasture Feed Poultry Pigmeat Sheepmeat Beef and veal Milk Inputs Annual growth 2020-29 Annual growth 2010-19% p.a.
- 8. Aquaculture is on track to overtake capture fisheries globally 0 20 40 60 80 100 120 1999 2004 2009 2014 2019 2024 2029 Mt Aquaculture Total capture Capture for human consumption
- 9. Livestock will be responsible for 80% of additional direct GHG emissions -1 1 3 5 7 9 -1 0 1 2 3 4 5 6 7 8 9 Total Ruminants Other livestock Synthetic fertiliser Rice cultivation Other %Gt Co2-eq 2017-19 2029 Total growth 2017-19 to 2029 (right axis)
- 10. Agricultural output will grow faster than direct GHG emissions, 2020 to 2029 -0.5 0 0.5 1 1.5 2 2.5 Asia Pacific Sub-Saharan Africa Near East and North Africa Europe and Central Asia North America Latin America and Caribbean % p.a. Growth in agricultural production Growth in GHG emissions
- 11. Trade specialisation between regions increasing over time -80 -60 -40 -20 0 20 40 60 80 100 2000 2002 2004 2006 2008 2010 2012 2014 2016 2018 2020 2022 2024 2026 2028 bln USD Latin America and the Caribbean North America Europe and Central Asia Sub Saharan Africa Asia Pacific Near East and North Africa
- 12. Trade is essential for global food security (Imports as a share of total calorie availability) 0 10 20 30 40 50 60 Asia Pacific Sub-Saharan Africa Near East and North Africa Europe and Central Asia North America Latin America and Caribbean World % 2007-09 2017-19 2029
- 13. Exports are critical to livelihoods in many countries (% dependency on foreign markets) 0 10 20 30 40 50 60 70 80 New Zealand Paraguay Norway Canada Australia Argentina Ukraine Brazil % 2007-09 2017-19 2029
- 14. Projected evolution of FAO Food Price Index 0 50 100 150 200 250 Index 2002- 04=100 FAO Food Price Index (nominal) FAO Food Price Index (real)
- 15. Projections are consistent with long-term trends… but volatility is always possible 0 50 100 150 200 250 300 350 400 450 500 1960 1964 1968 1972 1976 1980 1984 1988 1992 1996 2000 2004 2008 2012 2016 2020 2024 2028 Index (2019=100) Soybeans Maize Beef Pork
Hinweis der Redaktion
- Per capita consumption of main food groups (calorie equivalent), by income group Note: The 38 individual countries and 11 regional aggregates in the baseline are classified into the four income groups according to their respective per-capita income in 2018. The applied thresholds are: low: < USD 1 550, lower-middle: < USD 3 895, upper-middle: < USD 13 000, high: > USD 13 000. Staples includes cereals roots and pulses. Animal products include meat, dairy products (exluding butter), eggs and fish. Fats include butter and vegetable oil. The category others include fruits, vegetables etc.
- Note: The 38 individual countries and 11 regional aggregates in the baseline are classified into the four income groups according to their respective per-capita income in 2018. The applied thresholds are: low: < USD 1 550, lower-middle: < USD 3 895, upper-middle: < USD 13 000, high: > USD 13 000. Staples includes cereals roots and pulses. Animal products include meat, dairy products (exluding butter), eggs and fish. The category others include fruits, vegetables etc.
- Note: Crushing of oilseeds is not reported as the uses of 'vegetable oil' and 'protein meal' are included in the total; Dairy refers to all dairy products in milk solid equivalent units; Sugar biofuel use refers to sugarcane and sugarbeet, converted into sugar equivalent units.
- Note: The population growth component is calculated assuming per capita demand remains constant at the level of the year preceding the decade. Growth rates refer to total demand (for food, feed and other uses).
- Share of biofuel in total use
- Global growth in crop production Note: Figure shows the decomposition of total production growth (2010-19 and 2020-29) into growth in land use, land intensification through growth in multi-cropped land, and growth in yields. It covers the following crops: cotton, maize, other coarse grains, other oilseeds, pulses, rice, roots and tubers, soybean, sugarbeet, sugarcane, wheat and palm oil.
- Direct GHG emission from crop and livestock production, by activity Note: The category ''other'' includes direct GHG emissions from burning crop residues, burning savanna, crop residues, and cultivation of organic soils. Source: FAO (2019). FAOSTAT Emissions-Agriculture Database, http://www.fao.org/faostat/en/#data/GT; OECD/FAO (2020), “OECD-FAO Agricultural Outlook”, OECD Agriculture statistics (database), http://dx.doi.org/10.1787/agr-outl-data-en.
- Annual change in agricultural production and direct GHG emissions, 2020 to 2029 Note: Figure shows projected annual growth in direct GHG emissions from agriculture together with annual growth in the estimated net value of production of crop and livestock commodities covered in the Outlook (in billions of USD, measured at constant 2004-6 prices). Source: FAO (2019). FAOSTAT Emissions-Agriculture Database, http://www.fao.org/faostat/en/#data/GT; OECD/FAO (2020), “OECD-FAO Agricultural Outlook”, OECD Agriculture statistics (database), http://dx.doi.org/10.1787/agr-outl-data-en.
- Note: Net trade (exports minus imports) of commodities covered in the Agricultural Outlook, measured at constant 2004-06 USD.
- Imports as a share of total calorie availability for selected regions Note: Calculations using average calorie content of commodities included in the Outlook. Note that imports include feed, and availability includes processing of commodities which may be re-exported.
- Exporting countries with greater than 25% dependency on foreign markets