
Empfohlen
Weitere ähnliche Inhalte
Was ist angesagt?
Was ist angesagt? (20)
Andere mochten auch
Andere mochten auch (20)
Ähnlich wie ECO Northwest, Hood River Housing Needs Analysis
Ähnlich wie ECO Northwest, Hood River Housing Needs Analysis (20)
Mehr von NeighborhoodPartnerships
Mehr von NeighborhoodPartnerships (15)
Kürzlich hochgeladen
Kürzlich hochgeladen (20)
ECO Northwest, Hood River Housing Needs Analysis
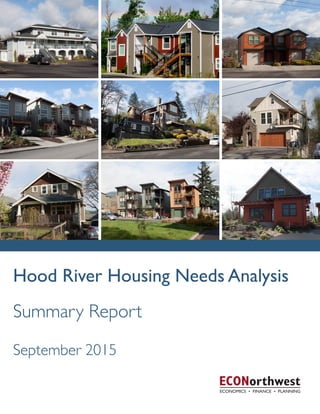
- 1. Hood River Housing Needs Analysis ECONorthwest Summary Report September 2015 December 2014
- 2. 2 • ECONorthwest FINAL ACKNOWLEDGEMENTS Acknowledgements ECONorthwest prepared this report for the City of Hood River. ECONorthwest and the City of Hood River thank the many people who helped to develop the Hood River Housing Needs Analysis. Technical Advisory Committee Bill Irving, Hood River Planning Commissioner Heather Staten, Executive Director, Hood River Valley Residents Committee Joel Madsen, Executive Director, Mid-Columbia Housing Authority John Roberts, Hood River County Community Development Director Kate McBride, Hood River City Councilor Kate Sinner, Regional Solutions Coordinator, North Central Region, Office of the Governor Maui Meyer, Hood River County Commissioner State of Oregon Scott Edelman, Central Oregon Regional Representative, Community Services Division, Oregon Dept. of Land Conservation and Development (DLCD) Central Regional Solution Center Gordon Howard, Urban Planning Specialist, DLCD City of Hood River Cindy Walbridge, Planning Director Kevin Liburdy, Senior Planner This project is partially funded through a technical assistance grant from the Department of Land Conservation and Development. For over 40 years ECONorthwest has helped its clients make sound decisions based on rigorous economic, planning, and financial analysis. For more information about ECONorthwest please visit www.econw.com. For more information about this report, please contact: Cindy Walbridge, Planning Director City of Hood River 211 2nd Street Hood River, OR 97031 541-387-5210 cindy@ci.hood-river.or.us Beth Goodman ECONorthwest 222 SW Columbia, Suite 1600 Portland, OR 97201 503-222-6060 goodman@econw.com
- 3. FINAL Hood River Housing Needs Assessment • 3 INTRODUCTION Introduction Hood River is a growing city, adding more than 1,600 new residents between 2000 and 2013, accounting for more than half of the population growth in Hood River County. Growth in population has resulted in growth in housing, with Hood River adding more than 1,100 new dwelling units within the Urban Growth Boundary (UGB) between 2000 and 2014, the majority of which were single-family detached housing. As the City’s population and housing stock have grown, housing has become less affordable to people living in Hood River. Nearly one-third of Hood River’s households are unable to afford their current housing, with roughly 40% of renters unable to afford their housing costs. Homeownership has become less affordable in Hood River since 2000. In 2013, the average house cost 6.4 times the median household income, compared to 4.5 times median household income in 2000. One of the factors that contributes to the changes in housing affordability is growth in demand for second homes and short-term rental housing. This study estimates that between 8% and 12% of Hood River’s current housing stock is either second homes or short-term rental housing, making it unavailable for year- round housing. One of the City’s key policy questions is whether (and how) to regulate short-term rental housing in the future. This report provides information about these and other issues that will shape housing demand in Hood River over the 2015 to 2035 period. The purpose of the report is to provide the City with a factual basis to support changes to Hood River’s Comprehensive Plan and zoning ordinance to provide options for addressing Hood River’s unmet housing need. This summary report presents the results of two longer reports: • Hood River Housing Needs Analysis 2015 to 2035 presents the full results of the housing needs analysis (HNA) for the City of Hood River and is intended to comply with statewide planning Goal 10 (housing) and OAR 660-008. The focus of the HNA is to assess whether Hood River has enough land within the City’s UGB to accommodate expected population growth. • Hood River Housing Strategy presents recommendations for revisions to policies in Hood River’s Comprehensive Plan Housing Element and policy actions intended to result in policy changes that provide opportunities for development of housing to meet Hood River’s identified housing needs. City staff and ECONorthwest staff worked with a Technical Advisory Committee (TAC) to review the results of the Housing Needs Analysis and develop the Housing Strategy. The Planning Commission and City Council will review the TAC’s recommendations for housing policy changes, resulting in revisions to the Housing Strategy. In the Fall of 2015, the City plans to begin the process of implementing key policy changes identified in the Housing Strategy through the public hearings process. Since 2000, Hood River’s population grew by 1,600 people, and housing stock grew by 1,100 dwellings. The Hood River Housing Needs Analysis documents Hood River’s housing needs in detail. The Hood River Housing Strategy presents recommendations to the City’s development policies.
- 4. 4 • ECONorthwest FINAL HOOD RIVER’S POPULATION AND HOUSEHOLDS Hood River’s Population and Households Population and housing characteristics are useful for better understanding Hood River and the people who live here. Characteristics such as population growth, age of residents, household size and composition, commuting patterns, average pay per employee, and home ownership provide useful information about how the characteristics of Hood River’s households compare to Hood River County and Oregon. Unless otherwise noted, all data in this document are from the U.S. Census. 34 38 39 POPULATION, 2013 Source: Portland State University, Population Research Center MEDIAN AGE, 2013 7,460 1.9% Hood River 3,919,020 1.1% Oregon 23,295 1.0% Hood River Co. POPULATION AGED 60 AND OLDER, HOOD RIVER COUNTY 2015 & 2035 Source: Oregon Office of Economic Analysis AVERAGE POPULATION GROWTH PER YEAR, 2000-2013 Hood River OregonHood River Co. Hood River OregonHood River Co. 21% 28% 2015 2035 Hood River’s population has grown 1.9% annually since 2000, nearly twice the County or State average. Hood River’s population is, on average, younger than the County or State averages. Hood River County’s population over age 60 is expected to increase over the next 20 years.
- 5. FINAL Hood River Housing Needs Assessment • 5 HOOD RIVER’S POPULATION AND HOUSEHOLDS PERCENT OF HOUSEHOLDS THAT ARE SINGLE-PERSON, 2010 AVERAGE NUMBER OF PEOPLE PER HOUSEHOLD, 2013 2.4 Hood River 2.5 Oregon 2.6 Hood River Co. OregonHood River Co.Hood River 24% 28%35% HOUSEHOLD COMPOSITION, 2013 Oregon Hood River Co. Hood River Families with children Families without children Non-family households PERCENT OF POPULATION THAT IS HISPANIC OR LATINO, 2000 AND 2013 OregonHood River Co.Hood River 2000 2000 2000 2013 2013 2013 23% 26% 25% 30% 8% 12% A family household is one in which the resident is related to at least one other person in the household by birth, marriage, or adoption. Non-family households include people living alone, unmarried couples, and unrelated housemates. Hood River has a larger percentage of single person households than the County or State. Hood River has a larger percentage of non-family households than the County or State. Hood River’s population is more ethnically diverse than the State average. 62% 83% 72% 35% 16% 23%4% 2% 3%
- 6. 6 • ECONorthwest FINAL HOOD RIVER’S HOUSING MARKET Hood River’s Housing Market Analysis of historical development trends in Hood River provides insights into how the local housing market functions in the context of Hood River County. This report groups housing into the three housing types shown below. HOUSING TYPES MIX OF EXISTING HOUSING TYPES, 2013 Oregon Hood River Co. Hood River Single-family detached Single-family attached Multifamily 62% 83% 72% 35% 16% 23%4% 2% 3% BUILDING PERMITS ISSUED, 2000-2014 Source: Hood River Building Permit Database. 2000 2001 2002 2003 2004 2005 2006 2007 2008 2009 2010 2011 2012 2013 2014 50 units 100 units Single-family detached (includes mobile and manufactured homes) Single-family attached (townhouses) Multifamily (condos, apartments, duplexes) More than one third of Hood River’s housing stock is multifamily housing, more than Hood River County or the State. Hood River added more than 1,100 dwelling units between 2000 and 2014. Three-quarters of new development was single- family detached housing. Most of new housing was located within Hood River’s city limits, with a little less than one-fifth of new housing located in the urbanizing area between the city limits and the UGB.
- 7. FINAL Hood River Housing Needs Assessment • 7 HOOD RIVER’S HOUSING MARKET Short-term Rentals and Secondary Housing Hood River is a tourism destination and some of Hood River’s housing has long been used by people staying in Hood River for a short period or by people who own second houses in Hood River. This report uses the following definitions to describe these types of non-primary residential uses: • Short-term rentals (STRs) are houses rented to people for a period of 30 days or fewer, generally for vacation uses. • Secondary housing refers to houses that are the secondary residences of people who do not reside in Hood River. Secondary housing may also be used as a short-term rental. Hood River tracks the number of units used for short-term rentals through its Transient Room Tax system but does not track the number of dwellings used for secondary housing. This study estimates that Hood River has about 190 dwelling units used as short-term rentals and 150 secondary homes. Together, these 340 units account for 9.6% of Hood River’s housing stock. The Census estimates the amount of housing that is vacant for seasonal, recreational, or occasional uses, which is generally consistent with the study’s classification of short-term rentals and secondary housing. In 2010, 8% of Hood River’s housing stock was vacant for seasonal, recreational, or occasional uses, up from 4% in 2000 and 1% in 1990. BendAshlandHood River Newport Lincoln City Cannon Beach PERCENT OF HOUSING UNITS VACANT FOR SEASONAL, RECREATIONAL, OR OCCASIONAL USE, SELECTED GEOGRAHIES, 2010 8% 3% 4% 14% 29% 54% The amount of housing used for short-term rentals and secondary housing in Hood River has grown over the last two decades. According to Census data, the percentage of housing in Hood River that was vacant for seasonal, recreational, or occasional use increased from 1% of housing in 1990 to 4% of housing in 2000 to 8% of Hood River’s housing in 2010. About 8% to 12% of Hood River’s housing is used for short-term rentals or secondary housing.
- 8. 8 • ECONorthwest FINAL HOUSING AFFORDABILITY Housing Affordability The term affordable housing refers to a household’s ability to find housing within its financial means. Housing affordability affects both higher- and lower-income households and is an important issue for Hood River and the mid-Columbia Gorge region. Low-income households have fewer resources available to pay for housing and have the most difficulty finding affordable housing. Key points about affordability in Hood River include: • Hood River will have an ongoing need for housing affordable to lower- income and moderate-income households. • The City is planning for needed housing types for households at all income levels and will work with non-profit and private housing providers to ensure availability of housing affordable to lower- and moderate-income households. • Future housing affordability will depend on the relationship between income and housing price. The key question, which is difficult to answer based on historical data, is whether housing prices will continue to outpace income growth. It seems likely that without public intervention, housing will become less affordable in Hood River. $38,400 $3,200 60% $51,200 $4,270 80% $76,800 $6,400 120% $64,000 $5,330 100% Annual Income Monthly Income Utilities and Owner Costs Rent or Mortgage Payment $960 $1,280 $1,600 $1,920 $100 $860 $1,130 $1,200 $1,420 $150 $400 $500 Affordable Housing Cost Likely Tenure Typical Housing Type Renter Renter Owner or Renter Owner or Renter Apartment Apartment Small house Small house Townhouse Cottage House Condominium Percentage of MFI = + HOUSING AFFORDABILITY BASED ON HOOD RIVER COUNTY MEDIAN FAMILY INCOME (MFI) OF $64,000 IN 2014 Source: US Department of Housing and Urban Development, 2014
- 9. FINAL Hood River Housing Needs Assessment • 9 HOUSING AFFORDABILITY PERCENT OF HOUSEHOLDS THAT ARE COST BURDENED, 2013 Cost-burdened households spend more than 30% of their gross income on housing. 32% Hood River 40% Oregon 35% Hood River Co. PERCENT OF HOOD RIVER’S HOUSEHOLDS THAT ARE COST BURDENED, BY OWNERSHIP STATUS, 2013 25%40% Renter-occupied households Owner-occupied households MEDIAN HOME SALES PRICES, 2014 Source: Zillow, 2014 $311,400 $239,600$311,300 Hood River OregonHood River Co. RATIO OF MEDIAN OWNER-OCCUPIED HOUSING VALUE TO MEDIAN HOUSEHOLD INCOME, 2013 Lower ratios indicate that housing is more affordable. HUD’s standard is 3.0. 6.4 Hood River 4.7 Oregon 5.7 Hood River Co. AFFORDABLE HOUSING WAGE FOR A 2-BEDROOM APARTMENT, 2013 The affordable housing wage is based on the Fair Market Rent for a 2-bedroom apartment provided by the U.S. Department of Housing and Urban Development (HUD). HUD calculates the Fair Market Rent for each metropolitan statistical area (MSA) as the amount below which 40% of standard-quality apartments are rented. A household making the affordable housing wage will be able to afford Fair Market Rent without spending more than 30% of household income on housing costs. $16.25 Hood River $18.15 Portland $15.46 Bend One-third of Hood River’s households are paying more than they can afford for housing, with one- quarter of owner- occupied households cost burdened and 40% of renter households cost burdened.
- 10. 10 • ECONorthwest FINAL FACTORS AFFECTING HOUSING NEED Factors Affecting Housing Need Studies and data analysis have shown a clear linkage between demographic characteristics and housing choice, as shown in the figure below. Key relationships include: • Housing needs change over a person’s lifetime. • Homeownership rates increase as income increases. • Homeownership rates increase as age increases. • Choice of single-family detached housing increases as income increases. • Renters are much more likely to choose multifamily housing than single- family housing. • Income is a strong determinant of tenure and housing-type choice for all age categories. family single young adult young couple family with 3 children family with 1 child older couple HOUSING LIFE CYCLE
- 11. FINAL Hood River Housing Needs Assessment • 11 FACTORS AFFECTING HOUSING NEED The linkages between demographics and housing need can be used to predict future housing need in Hood River. Three demographic trends are particularly important for Hood River: • Aging of the Baby Boomer Generation (born 1946 to 1964) • Aging of the Millennial Generation (born early 1980s to early 2000s) • Continued growth of the Hispanic/Latino population Aging of the Millennials Hood River’s population is younger than the State averages and Hood River has a larger share of people aged 20 to 39. Hood River’s ability to attract and retain Millenials will depend on availability of affordable owner- and renter-occupied housing. Implications for Hood River’s Housing: Need for affordable owner and renter housing, especially in walkable neighborhoods. Millennial incomes will increase as they age. They will need opportunities for affordable, owner- occupied single-family housing, such as cottages or townhouses. LIKELY TRENDS AMONG MILLENNIAL HOUSEHOLDS: Household sizes (as they form families) Homeownership rates Income Continued growth of the Hispanic/Latino Population Hood River’s Hispanic/Latino population grew by more than 550 people (3%) between 2000 and 2013. Nationwide, the Hispanic/Latino population is predicted to be the fastest growing racial/ethnic group over the next few decades. Implications for Hood River’s Housing: Need for larger, lower- cost renting and ownership opportunities for larger households with more children and multiple generations. CHARACTERISTICS OF HISPANIC HOUSEHOLDS COMPARED TO NON-HISPANIC HOUSEHOLDS: Household sizes Homeownership rates Hispanic households have higher homeownership rates at younger ages. Continued lower than average income Implications for Hood River’s Housing: Need for smaller, lower- cost housing near transit and urban amenities such as shopping and health care services. LIKELY TRENDS AMONG BABY BOOMER HOUSEHOLDS: Household sizes (more 1 person households) Homeownership rates (especially after 75 years old) Income Aging of the Baby Boomers Consistent with state and national trends, Hood River’s population is growing older. By 2035, 28% of the population of Hood River Counties is forecast to be 60 and over, up from 21% in 2015.
- 12. 12 • ECONorthwest FINAL DEVELOPMENT CAPACITY Development Capacity Hood River has about 318 acres of residential land that is vacant or partially vacant. The majority of Hood River’s buildable residential land is in low density designations and in the urbanizing area between the city limits and the Urban Growth Boundary. The capacity analysis estimates the number of new dwelling units that can be accommodated on Hood River’s buildable vacant and partially vacant residential land based on historical densities, with deductions for future rights-of-way. Hood River’s vacant and partially vacant residential land base, plus land in the General Commercial (C-2) designation, can accommodate 2,460 new dwelling units at historical development densities. Definitions Buildable residential land: Unconstrained suitable vacant and partially-vacant land designated for residential development. Vacant land: Unconstrained suitable land designated for residential development. Partially vacant land: Unconstrained suitable land with existing residential development that could support additional residential development. Constrained land: Land that is not available for development based upon one or more factors such as environmental protections or lands committed for public use. Capacity: Number of dwelling units that can be accommodated on buildable land at planned densities. Housing density: Number of dwelling units in an acre of land, with 43,560 square feet to 1 acre. HOOD RIVER’S BUILDABLE VACANT AND PARTIALLY VACANT RESIDENTIAL LAND, BY PLAN DESIGNATION, 2015 1 square represents 2 acres. 318 acres of buildable land Urban Low Density Residential (R-1 / 76 acres / 24%) Urban Standard Density Residential (R-2 / 29 acres / 9%) Urban High Density Residential (R-3 / 18 acres / 6%) Urban Low Density Residential (U-R-1 / 113 acres / 35%) Urban Standard Density Residential (U-R-2 / 81 acres / 26%) CAPACITY ON RESIDENTIAL LAND, BY PLAN DESIGNATION 1 square represents 30 dwelling units. 2,460 dwelling units 405 dwelling units / R-1 227 dwelling units / R-2 307 dwelling units / R-3 597 dwelling units / U-R-1 624 dwelling units / U-R-2 Capacity on Buildable Residential Land 300 dwelling units / General Commercial (C-2) DENSITY ON HOOD RIVER’S RESIDENTIAL LAND BASED ON HISTORICAL DENSITIES, DWELLING UNITS PER GROSS ACRE 5.3 R-1 7.7 R-2 17.0 R-3 25.0 C-2 U-R-1 5.3 U-R-1 7.7
- 13. FINAL Hood River Housing Needs Assessment • 13 DEVELOPMENT CAPACITY I-84 30 218 35 C o l u m b i a R i v e r Hood River Residential BLI Vacant and Partially Vacant Land by Development Status with Constraints Hood River, Oregon ¯0 0.25 0.5 Miles Development Status Partially Vacant Vacant Wetlands Slopes > 25% Hood River City Limits Hood River UGB, 2012
- 14. 14 • ECONorthwest FINAL ACCOMODATING NEEDED HOUSING Accommodating Needed Housing Demand for Residential Land, by Housing Type Hood River’s population growth over the next 20 years will affect the number of new households created and the demand for residential land. Hood River’s forecast for new housing is based on the forecast for population growth within the Hood River UGB. Using Hood River County’s population forecast as the basis, Hood River population will grow at a rate of 2.0% per year, adding 4,528 new people between 2015 and 2035. New population in Hood River will require 1,985 new dwelling units over the 20- year period. The analysis of housing affordability, the factors affecting housing need, and demographic changes suggests that Hood River needs more diverse and affordable housing types, including more small-scale single-family detached housing, townhouses, and more multifamily housing. Comparison of Housing Capacity to Housing Demand The last step in the Housing Needs Analysis is to compare the capacity of Hood River’s vacant and partially-vacant residential land with demand for housing by Comprehensive Plan designation. Hood River has enough land in its residential plan designations to accommodate growth of single-family detached and single- family attached (townhouses). Hood River has enough capacity in the Urban High Density and General Commercial designations to accommodate multifamily growth. This assumes that about 300 dwellings locate in General Commercial, on second and third stories of mixed-use buildings. Without residential development in C-2, Hood River would have a deficit of land for multifamily development. Hood River’s population growth will result in the addition of 1,985 new dwelling units between 2015 and 2035. FORECASTED TOTAL NEW POPULATION, HOOD RIVER UGB, 2015-2035 2015 2035 9,317 13,845 Population increase: 4,528 Hood River’s population is forecast to grow at 2% per year, adding more than 4,500 new residents.
- 15. FINAL Hood River Housing Needs Assessment • 15 ACCOMODATING NEEDED HOUSING The key findings of the housing needs analysis are: • Hood River’s policies generally comply with Goal 10, except for regulation of townhouse development. Hood River’s zoning code only allows townhouses in R-2 and R-3, where they are a conditional use. Single- family attached housing is a needed housing type in Hood River and Goal 10 requires that needed housing types are regulated through clear and objective standards. • Hood River has limited opportunities for future expansion of the UGB. While this project did not include consideration of a UGB expansion, the City has considered UGB expansion in the past. The City is surrounded by the Columbia River Gorge National Scenic Area and by farmland. Expansion in either of these areas will be extremely complicated and difficult. • Hood River has a limited supply of residential land for multifamily development. Having enough land for multifamily development is important because multifamily housing is a comparatively affordable type of housing. Hood River’s residential land supply is essentially enough land to meet expected growth of new residents in Hood River over the next 20 years. Factors that may affect the City’s ability to accommodate residential growth are: o Vacation rentals and secondary homes will require additional residential land for development. The forecast for growth and sufficiency of land do not account for growth of short-term rentals and secondary housing. o Timing of development of land will affect the availability of land for development. About 60% of Hood River’s vacant residential land is in U-R-1 or U-R-2 and more than 65 acres are actively being used for agriculture. The supply of available residential land may become more constrained if landowners choose to delay development in these areas. • Hood River has an existing deficit of affordable housing. Hood River’s housing prices, especially ownership prices, have increased substantially since 2000. The City’s policy options for providing opportunities to build affordable housing (both market-rate and government-subsidized affordable housing) are limited. The most significant way that the City can encourage development of housing is through ensuring that enough land is zoned for residential development, eliminating barriers to residential development, and providing infrastructure in a cost-effective way. • Hood River has a very limited supply of land for multifamily development. Hood River has about 18 acres of vacant R-3 land and is able to accommodate much of the multifamily need on this land. Accommodating all multifamily growth requires assuming that some land zoned C-2 will develop with housing, as part of a mixed-use development. In the future, the City will need to use R-3 land as efficiently as possible and manage residential development in C-2 to ensure the long-term availability of land for employment uses.
- 16. 16 • ECONorthwest FINAL HOUSING STRATEGY Housing Strategy The Housing Strategy addresses the key findings of the Housing Needs Analysis. The Housing Strategy presents the TAC’s recommendations for policy changes to address the issues identified in the Housing Needs Analysis. These policy changes should be made over the next one to three years. Beginning in September 2015, City staff expect to begin working with the Planning Commission to implement changes to the land use code based on the direction of the Housing Strategy from the Planning Commission and City Council. The Hood River Housing Strategy is organized into three broad strategic areas: increasing residential land use efficiency, regulation of secondary housing and short-term rental housing, and development of affordable housing. Strategy 1: Increase the efficiency of use of land within the Hood River UGB The following recommended policy changes are intended to increase the capacity of Hood River’s existing residential land base by increasing the efficient use of land. Using Hood River’s residential land well is key to ensuring that Hood River has opportunities to grow from 2015 to 2035, and beyond. Action 1.1: Identify land to rezone to allow additional multifamily development. This action will require that the City identify residential land to rezone for higher development densities, with the intention of providing more opportunities for development of moderate- and high-density multifamily housing. When selecting land to rezone, the City should focus on land that is vacant, along transportation corridors, in areas with current or planned water and wastewater service, in areas with current or planned access to retail and other services, and in a location that will not disrupt existing neighborhoods. Action 1.2: Allow townhouses as a permitted use in R-2 and R-3. Townhouses are currently a conditional use in R-2 and R-3. To be in compliance with Goal 10, the City must adopt standards for townhomes in the R-2 and R-3 zoning districts that are clear and objective, and that do not restrict the development of townhomes through unreasonable cost or delay. The City can craft clear and objective standards that address community concerns about townhome development, such as their use for short-term rental housing. Action 1.3: Reduce lot size in R-1 Zone to 5,000 square feet. This action would result in a change to Hood River’s zoning code to allow 5,000 square foot lots, smaller than the existing minimum lot size of 7,000 square feet. Action 1.4: Reduce lot size in R-2 Zone. This action would result in a change to Hood River’s zoning code to set a new minimum lot size in R-2, such as 4,000 square foot lots or even 2,500 square foot lots. Action 1.5: Revise Planned Unit Development (PUD). The purpose of changing the PUD ordinance is to make it easier to use and to encourage use of the ordinance by developers in Hood River. Bell Tower in Wilsonville
- 17. FINAL Hood River Housing Needs Assessment • 17 HOUSING STRATEGY Action 1.6: Develop a Cottage Code to allow development of denser single- family detached housing. This action would result in an ordinance that allows small single-family housing, often 800 to 1,300 square feet of built space, built in clusters around a common open space. Action 1.7: Revise Accessory Dwelling Units (ADUs) ordinance. This action would continue the City’s ongoing revision of the existing ADU ordinance. Strategy 2: Regulate and manage secondary and short- term rental housing The following recommended policy changes are intended to regulate and manage secondary and short-term rental housing in Hood River. Action 2.1: Enhance the existing system for licensing and permitting short- term rental housing. The purpose of this action is to enhance the City’s existing licensing and permitting system, tailored to Hood River’s needs and preferences. This action would result in the following changes to Hood River’s policies: • Action 2.1A. Establish a fee for short-term rental permitting. • Action 2.1B. Develop a system for inspections of short-term rental housing. • Action 2.1C: Develop City guidelines for short-term rental housing management about occupancy, garbage collection, parking limitations, and other relevant issues. • Action 2.1D: Require a local contact for short-term rentals. Action 2.2: Monitor changes in the number and character of short-term rentals and revisit options for regulation or other limitations on short-term rentals in one year. The City will monitor the number of short-term rental units and secondary houses in the City and report the findings of this monitoring annually to the City Council. In one year (Fiscal Year 2016 to 2017), at the direction of the Council, the City may consider additional options for the regulation or limitation of short-term rentals.
- 18. 18 • ECONorthwest FINAL HOUSING STRATEGY Strategy 3: Develop affordable housing The following recommended policy changes are intended to encourage development of market-rate and government-subsidized affordable housing in Hood River. Action 3.1: Identify publicly-owned properties that could be used for affordable housing and partner with the Mid-Columbia Housing Authority to develop affordable housing. The City and County should identify surplus properties, work with the Mid-Columbia Housing Authority to evaluate whether these properties are suitable for affordable housing development, and determine the best way to proceed forward with developing affordable housing on these properties. Action 3.2: Establish a policy that notifies and allows local governments or qualified nonprofits the right of first refusal on surplus or tax delinquent private properties. This action would ensure that local agencies involved with affordable housing development would have an opportunity to purchase publicly owned surplus or tax delinquent properties for affordable housing development. Action 3.3: Reduce parking requirements for affordable or multifamily housing. The purpose of this action is to reduce development costs where that reduction in costs will directly result in the development of housing with lower than average rents, such as government-subsidized housing. This policy may be one that the City chooses to implement selectively, such as affordable senior housing. Action 3.4: Use Tax Increment Financing in the Heights Urban Renewal area to support government-subsidized and market-rate multifamily housing development. As the City amends the Urban Renewal Plan for the Heights, the City should consider including urban renewal projects that support development of government-subsidized and market-rate multifamily housing. Action 3.5: Work with a nonprofit to develop a community land trust to support development primarily of owner-occupied housing. The City’s role in a community land trust would be to work as a partner with a nonprofit, who would lead the development and management of housing to ensure that housing remains affordable over a long period of time. Action 3.6: Identify sources of funding to support government-subsidized affordable housing development. Hood River does not currently have funding to support affordable housing development. This action would direct the City to identify sources of funding to support affordable housing development. Action 3.7: Develop a tax abatement program, such as the multiple-unit limited tax exemption program, to promote development of affordable and market- rate multifamily housing. The purpose of this action is to provide an incentive for development of government-subsidized and/or market-rate multifamily housing. Action 3.8: Develop a program to defer systems development charges for affordable housing development. The purpose of the policy is to defer payment of systems development charges (SDC) through financing SDC payments over time, making it easier for developers to pay for projects by reducing upfront costs.