Nashik Call Girl Just Call 7091819311 Top Class Call Girl Service Available
Invetment strategy
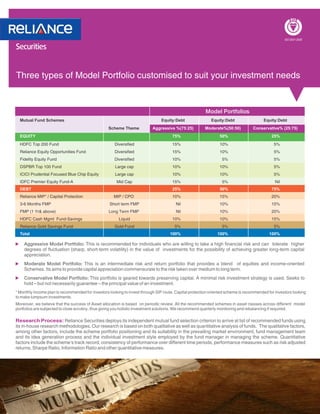
1. Three types of Model Portfolio customised to suit your investment needs
Model Portfolios
Mutual Fund Schemes Equity:Debt Equity:Debt Equity:Debt
Scheme Theme Aggressive %(75:25) Moderate%(50:50) Conservative% (25:75)
EQUITY 75% 50% 25%
HDFC Top 200 Fund Diversified 15% 10% 5%
Reliance Equity Opportunities Fund Diversified 15% 10% 5%
Fidelity Equity Fund Diversified 10% 5% 5%
DSPBR Top 100 Fund Large cap 10% 10% 5%
ICICI Prudential Focused Blue Chip Equity Large cap 10% 10% 5%
IDFC Premier Equity Fund-A Mid Cap 15% 5% Nil
DEBT 25% 50% 75%
Reliance MIP* / Capital Protection MIP / CPO 10% 15% 20%
3-6 Months FMP Short term FMP Nil 10% 15%
FMP (1 Yr& above) Long Term FMP Nil 10% 20%
HDFC Cash Mgmt Fund-Savings Liquid 10% 10% 15%
Reliance Gold Savings Fund Gold Fund 5% 5% 5%
Total 100% 100% 100%
u Aggressive Model Portfolio: This is recommended for individuals who are willing to take a high financial risk and can tolerate higher
degrees of fluctuation (sharp, short-term volatility) in the value of investments for the possibility of achieving greater long-term capital
appreciation.
u Moderate Model Portfolio: This is an intermediate risk and return portfolio that provides a blend of equities and income-oriented
Schemes. Its aims to provide capital appreciation commensurate to the risk taken over medium to long term.
u Conservative Model Portfolio: This portfolio is geared towards preserving capital. A minimal risk investment strategy is used. Seeks to
hold – but not necessarily guarantee – the principal value of an investment.
* Monthly income plan is recommended for investors looking to invest through SIP route. Capital protection oriented scheme is recommended for investors looking
to make lumpsum investments.
Moreover, we believe that the success of Asset allocation is based on periodic review. All the recommended schemes in asset classes across different model
portfolios are subjected to close scrutiny, thus giving you holistic investment solutions. We recommend quarterly monitoring and rebalancing if required.
Research Process: Reliance Securities deploys its independent mutual fund selection criterion to arrive at list of recommended funds using
its in-house research methodologies. Our research is based on both qualitative as well as quantitative analysis of funds. The qualitative factors,
among other factors, include the scheme portfolio positioning and its suitability in the prevailing market environment, fund management team
and its idea generation process and the individual investment style employed by the fund manager in managing the scheme. Quantitative
factors include the scheme’s track record, consistency of performance over different time periods, performance measures such as risk adjusted
returns, Sharpe Ratio, Information Ratio and other quantitative measures.
2. Recommended Mutual Fund Schemes
EQUITY Average AUM CAGR Returns (%) Volatility( 3 years)
^ #
(in Crores) 6M 1 Yrs 3 Yrs 5 Yrs Since Inception SD Beta Sharpe
HDFC Top 200 Fund 10,692 -12.6 -16.6 16.5 13.2 21.5 43.6 1.1 0.3
Diversified
Reliance Equity Opportunities Fund 3,193 -6.0 -13.9 23.6 12.2 20.4 54.9 1.3 0.4
Fidelity Equity Fund 3,387 -9.8 -13.3 16.8 12.2 20.4 41.8 1.0 0.3
BSE-500 -13.7 -20.0 9.2 6.1
Large cap
DSPBR Top 100 Fund 3,015 -9.5 -13.8 13.1 12.5 29.5 35.4 0.9 0.2
ICICI Pru Focused Blue Chip Equity 3,105 -10.0 -10.1 19.7 13.1 31.4 1.0 0.9
BSE-100 -14.1 -19.0 8.8 6.4
Mid Cap
IDFC Premier Equity-A 2,388 2.8 -8.6 24.1 23.0 21.3 50.5 1.2 0.4
BSE MIDCAP -10.6 -24.2 8.5 3.5
DEBT Annualised Returns (%) Volatility( 1 year)
^ #
SD Beta Sharpe
1M 3M 6M 1 Year 3 Years
Reliance MIP 6,466 4.2 -0.6 2.3 1.4 15.1 2.7 0.2 -0.4
MIP
Crisil MIP Blended Index 1.6 -1.4 0.7 1.9 7.8
Liquid
Fund
HDFC Cash Management Fund-Savings 3,423 8.3 8.7 8.7 8.3 6.6 1.1 -0.1 -1.4
Crisil Liquid Fund Index 8.0 7.8 7.8 7.8 6.2
Note: Average AUM as on 30th September 2011 includes Growth & dividend option. Returns under Equity category below 1 year are absolute and over 1 year
compounded annualised. The data is as on 30/09/2011.
^ Standard Deviation
# Sharpe Ratio
SIP Returns (CAGR)
Systematic Investment Plan ( Years) 1 Year 3 Year 5 year
HDFC Top 200 Fund -20.6 13.6 12.0
Reliance Equity Opportunities Fund -13.3 24.0 15.2
Fidelity Equity Fund -15.8 15.5 11.0
BSE-500 -23.3 7.2 3.8
DSPBR Top 100 Fund -17.0 9.7 8.9
ICICI Pru Focused Blue Chip Equity -15.1 16.7
BSE-100 -22.7 6.5 3.8
IDFC Premier Equity-A -2.5 26.5 20.7
BSE MIDCAP -23.9 9.1 2.7
Reliance MIP 2.4 9.0 11.3
Crisil MIP Blended Index 1.8 5.8 6.3
Disclaimer:
This document is meant for the customers of Reliance Securities Limited only. In case you are a non resident, please note that you need to comply with the relevant local laws of the country of your residence, before investing. Mutual
Funds and securities investments are subject to market risks, and there is no assurance or guarantee that the objectives of the Scheme will be achieved. As with any investment in securities, the Net Asset Value (NAV) of the Units issued
by Mutual Fund Schemes can go up or down depending on the factors and forces affecting the securities market. There are no assurances or guarantees that the objectives of any of the mutual fund schemes will be achieved. The
investments may not be suited to all categories of investors. Please read the Scheme Information Document and Statement of Additional Information of the respective mutual fund carefully before investing.
The views herein constitute only the opinions and do not constitute any guidelines or recommendation on any course of action to be followed by the readers. This information is meant for general reading purpose only and is not meant to
serve as a professional investment guide for the readers. This document has been prepared on the basis of publicly available information, internally developed data and other sources believed to be reliable. Reliance Securities Limited
(RSL) or its directors, employees, affiliates or representatives do not assume any responsibility for, or warrant the accuracy, completeness, adequacy and reliability of such information. Due care has been taken to ensure that the
disclosures and opinions given fair and reasonable. No action has been solicited based upon the information provided herein, and the information is not intended to be an offer or solicitation for the purchase or sale of any financial product
or instrument. Recipients of this information should rely on information/data arising out of their own investigations. Readers are advised to seek independent professional advice and arrive at an informed investment decision before
RSL/010/25.5.2011
making any investments. None of the directors, employees, affiliates or representatives of RSL shall be liable for any direct, indirect, special, incidental, consequential, punitive or exemplary damages, including lost profits arising in any
way whatsoever from the information contained in this material. RSL, the directors, employees, affiliates or representatives of RSL, associate companies, affiliates, and representatives including persons involved in the preparation or
issuance of this material may from time to time, have long or short positions in, and buy or sell the securities thereof, of company(ies) / specific economic sectors / mutual funds, if mentioned herein.
For further information please contact:
Reliance Securities Limited, Registered Office: 11th Floor, R-Tech Park, Nirlon Complex, Western Express Highway, Goregoan (E), Mumbai- 400 063. Tel +91 22 3059 1377 | Fax +91 22 3059 1594,
BSI Certifies Reliance Securities Limited for providing Equity & Equity Derivatives Trading services through online trading system