1. Analyzing social media to characterize HIV at-risk populations among MSM in San Diego
Narendran Thangarajan1, Dr. Nella Green3, Dr. Amarnath Gupta2, Dr. Susan Little3, Dr. Nadir Weibel1
Digital
Epidemiology
This research is funded by Frontier of Innovative Scholars Program, UCSD
and Center for AIDS Research, UCSD
1 Department of CSE, UC San Diego,
2 San Diego Supercomputer Center, 3 School of Medicine, UC San Diego
naren@ucsd.edu
35 MILLION people with AIDS worldwide.
1.2 MILLION people with AIDS in US.
660,000 total deaths caused by AIDS in US.
78% of the new infections in 2010 were MSM.
California (along with Florida) had the
highest number of HIV diagnoses in 2013.
Interesting recent trend - Proliferation of social networks and
real-time communication capabilities.
FISP CFAR
+ =
“Just treated a HIV infected person from location X.We should
probably conduct a PrEP intervention at X.”
“We should deploy peer education in locationY, most of our
patients are from there.”
Ineffective prevention strategies: 50,000 new HIV infections each year.Problem
Characterize and identify HIV at-risk MSM populations by studying
user sentiments and behaviors on social networks.
2015
2012
Salathé et. al. published “Digital Epidemiology” in PLoS
Computational Biology Journal
Solution
2014
Ginsberg et. al. published “Detecting influenza epidemics using
search engine query data” in Nature journal.
2008
Methods of using real-time social media technologies for
detection and remote monitoring of HIV outcomes - Sean D.
Young et. al., Elsevier Preventive Medicine, 2014.
Unraveling Abstinence and Relapse: Smoking Cessation
Reflected in Social Media - Dr. Elizabeth Murnane, CHI 2014.
1. Data collection, classification and refinementMethod
• Tweets are collected in real-time
through theTwitter Streaming API.
Twitter’s “filter hose” is used to collect
tweets from San Diego county.
• Each tweet is cleaned by removing
stop words, punctuations and
converting to lower case.
III. Migration from raw twitter data to social network graph
II. Improving the accuracy of HIV risk tweets classification using machine learning
To improve the accuracy of HIV
risk tweets classified, we
evaluated two linear classifiers -
SupportVector Machines (SVM)
and Logistic Regression with
different sets of features.
Feature Set SVM Logistic Regression
Bag of Words 15.73% 15.72%
Stop Word Removal 12.9% 12.98%
Domain Specific Terms 11.37% 7.42%
Tweeter information 17.12% 15.23%
Error rates using different linear classifiers
• The property graph model was
adopted as the data model for HIV at-
risk MSM twitter social network.
• 7 node types and 9 edge types were
identified as shown.
• Ontologies (shown in green) are used
to infer indirect relationships between
entities. For instance, it allows us to
query for users who post tweets
related to meth and sex venues.
• The resulting graph was materialized
in a graph database called Neo4J.
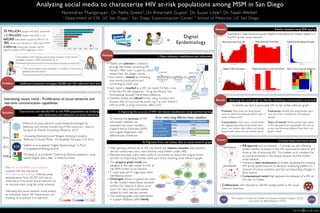
Results obtained using EDA queriesAnalysis
Exploratory Data Analysis queries helped understand the hidden patterns in
the HIV at-risk social network.
Querying the social graph to identify interesting communication structuresResults
Currently, we have a query-able HIV at-risk twitter network graph.
Proximity: How close are drug bucket
users to other homosexual bucket users in
terms of hop count?
Topics of interest: What are the main topics
in the discussions among people who are at
a one-hop following distance from their sub-
graph’s hubs?
Conversations: How many conversations
are happening among drug bucket users
alone , sex bucket users alone and across
drug bucket users and sex bucket users?”
Preferences: Identify two drug bucket users
who are most consulted by homosexual
people.
Current status and future worksFuture
(0) Drug (1) Homosexual (2) STI
(3) Sex (4) SexVenues
The HIV at-risk MSM social network
coupled with the real-world
HIV transmission network inferred using
phylodynamics from SD PIC will help us
understand if the actual sexual network can
be reconstructed using the social network.
Ultimately, this social network could predict
an individual’s future HIV transmission risk
enabling us to prevent it in real-time.
• Each tweet is classified as a HIV risk tweet if it falls in one
of the five HIV risk categories - Drug, SexVenues, Sex,
Homosexual, SexuallyTransmitted Infections.
• Classified tweets are refined further using exclusion and
inclusion lists of co-occurring words. e.g.“ice cold” doesn't
refer to meth (a drug commonly called “ice")
• After getting a refined set of HIV risk tweets, the relevant metadata (like tweeters
and the mentioned users) were fetched usingTwitter’s public APIs.
• Retweet and reply chains were pulled in recursively to ensure the original tweet
and the corresponding tweeter were part of the resulting social network graph.
Most active time of the day Most active day of the week Power-law distribution of tweets
Length of HIV risk tweets Tweets distribution across risk buckets Most co-occurring risk categories
• IRB approval and recruitment - Currently, we are collecting
twitter handles of people in the HIV transmission network and
those at risk of acquiring HIV. This enables us to compare the
structural similarities in the sexual network and the twitter
social network.
• Interactive data visualizations to enable visualizing the evolving
HIV at-risk social network to decipher underlying patterns in
network structure evolution and the corresponding changes in
SNA metrics.
• Computational model that captures the behavior of a HIV at-
risk user onTwitter.
Social
Network
Sexual
Network
• Collaboration with Harvard to identify change-points in the social
network structure.