
Empfohlen
Empfohlen
Weitere ähnliche Inhalte
Ähnlich wie new CHAPTER_FOUR_and_FIVE.docx
Ähnlich wie new CHAPTER_FOUR_and_FIVE.docx (20)
Kürzlich hochgeladen
Kürzlich hochgeladen (20)
new CHAPTER_FOUR_and_FIVE.docx
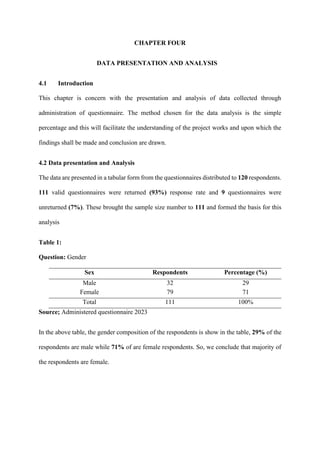
- 1. CHAPTER FOUR DATA PRESENTATION AND ANALYSIS 4.1 Introduction This chapter is concern with the presentation and analysis of data collected through administration of questionnaire. The method chosen for the data analysis is the simple percentage and this will facilitate the understanding of the project works and upon which the findings shall be made and conclusion are drawn. 4.2 Data presentation and Analysis The data are presented in a tabular form from the questionnaires distributed to 120 respondents. 111 valid questionnaires were returned (93%) response rate and 9 questionnaires were unreturned (7%). These brought the sample size number to 111 and formed the basis for this analysis Table 1: Question: Gender Sex Respondents Percentage (%) Male 32 29 Female 79 71 Total 111 100% Source; Administered questionnaire 2023 In the above table, the gender composition of the respondents is show in the table, 29% of the respondents are male while 71% of are female respondents. So, we conclude that majority of the respondents are female.
- 2. Table 2: Question: Age distribution Age Respondents Percentage (%) 18 – 23 6 6 24 – 29 39 35 30 – 35 26 23 36 and above 40 36 Total 111 100% Source; Administered questionnaire 2023 In the table above, 6% of the respondents are under 23years, 35% of the respondents are 24 – 29, 23% of the respondents are 30 – 35, while 36% of the respondents are 36years and above. So, we conclude that the majority of the respondents are 36years and above. Table 3 Question: Profession Variable Respondents Percentage (%) Architect 26 23 Civil Engineer 63 57 Facility Manager 4 3 Project Manager 11 10 Quantity Surveyor 2 2 Structural Engineer 5 5 Total 111 100% Source; Administered questionnaire 2023 In the table above, 23% of the respondents are Architect by profession, 57% of the respondents are Civil Engineers, 3% of the respondents are Facility Managers, 10% of the respondents are Project Manager, 2% of the respondents are Quantity Surveyor while 5% respondents are Structural Engineers. We conclude that the majority of the respondents are Civil Engineers. Table 4
- 3. Question; what is the nature of your Organisation? Variable Respondents Percentage (%) Consulting Organisation 18 16 Contracting Organisation 65 59 Contracting Organization, Consulting Organisation 3 3 Public Organization 23 21 Public Organization, Contracting Organization 1 1 Public Organization, Contracting Organization, Consulting Organisation 1 1 Total 111 100% Source; Administered questionnaire 2023 Table 4 above, shows the nature of business engage by the respondents, 16% of the respondents are into Consulting, 59% of the respondents are into Contracting, 3% of the respondents are into Contracting and Consulting, 21% of the respondents are into Public Organization, 1% of the respondents are in Public and Contracting Organization while 1% of the respondent are in Public, Contracting and Consulting Organisation. Table 5 Question; What is your position in the Organisation? Variable Respondents Percentage (%) Management Staff 37 33 Technical Staff 74 67 Total 111 100% Source; Administered questionnaire 2023 In the above table, 33% of the respondents are Management Staff, while 67% of the respondents are Technical Staff. Table 6
- 4. Question: Projects Executed under Due Process Policy. Variable Respondents Percentage (%) 1-5 projects 26 23 6-10 projects 17 15 11-15 projects 23 21 16-20 projects 39 35 21 and above projects 6 6 Total 111 100% Source; Administered questionnaire 2023 The table above shows that a total of 23% of the respondents have Executed Projects under Due Process Policy for 1-5 years, 15% for 6-10 years, 21% for 11-15 years, 35% for 16-20 years while 6% Executed Projects under Due Process Policy for 21 years and above. SECTION B: Research Questions 4.3 Descriptive Statistics 4.3.1 Descriptive Statistics for Hypothesis One Table 4.7 shows the summary of the descriptive statistics of questions related to Hypothesis one. The descriptive statistics include measures of central tendency such as the mean and measure of dispersion such as the standard deviation, minimum and maximum for these questions. From the table below, the means and standard deviations of the responses to all the questions are shown. Therefore, the mean of all the questions are 22.2 and the sum as stated in administration of questionarie. Consequently, the standard deviation of Questions 1 to 5 are 36.70422, 33.69273, 24.80323, 31.57847, and 34.73039 respectively this is the first set of the question that are for the first hypothesis while, the standard deviation of the second set of the question that are for the first hypothesis was shown as 34.76636, 30.47458, 36.18978, 29.14961 and 31.30016 for questions 6 to 10 respectively.
- 5. However, the minimum numbers of all the questions is 0 except for question 3 with the minimum number of 8. Also the Maximum numbers for the questions 1 to 10 are shown as 86, 80, 66, 76, 82, 81, 73, 86, 70, and 75 respectively. Table 4.7: Descriptive Statistics Questions Sum Mini Max Mean Standard Deviation Observing due process in public contracts awarding 111 0 86 22.2 36.70422 Transparency and fair play in public contract procurements 111 0 80 22.2 33.69273 No transparency and fair play in public contract procurements 111 8 66 22.2 24.80323 Participation of reputable, competent and reliable contractors in public contract 111 0 76 22.2 31.57847 Due process ensures faith by tenders for public contract 111 0 82 22.2 34.73039 Regulating and setting standards to enforce harmonizing bidding and tender documents in contract bidding. 111 0 81 22.2 34.76636 Formulation of general policies and guideline on public sector procurement and monitoring prices of tendered items and provide data base advisors. 111 0 73 22.2 30.47458 Documenting and monitoring government projects to completion and ensuring that executed contracts are according to specification and costs. 111 0 86 22.2 36.18978 Upholding professional ethics and reporting erring contractors for sanctions, thereby ensuring sanity in the Nigerian construction industry. 111 0 70 22.2 29.14961 Co-coordinating, trainings to promote capacity building of procurement personnel and systems. 111 0 75 22.2 31.30016 Source: Authors computation SPSS, (2020) 4.3.2 Descriptive Statistics for Hypothesis Two Table 4.8 shows the summary of the descriptive statistics of questions related to Hypothesis one. The descriptive statistics include measures of central tendency such as the mean and measure of dispersion such as the standard deviation, minimum and maximum for these questions. From the table below, the means and standard deviations of the responses to all the questions are shown. Therefore, the mean of all the questions are 22.2 and the sum as stated in administration of questionarie.
- 6. Consequently, the standard deviation of Questions 1 to 10 are 17.71, 17.71, 14.925, 18.381, 22.581, 22, 25, 14, 24, and 20 respectively this is the first set of the question that are for the first hypothesis while, the standard deviation of the second set of the question that are for the first hypothesis was shown as 18, 27, 23, 20, 14, 23, 14, 28, 15, and 30 for questions 11 to 20 respectively. However, the minimum numbers of the questions is shown as 8, 7, 7, 5, 2, 6, 6, 6, 7, 3, 6, 3, 5, 4, 4, 3, 7, 3, 3, and 3 for 1 to 20 respectively. Also the Maximum numbers for the questions 1 to 20 are shown as 44, 50, 46, 53, 60, 56, 66, 41, 65, 56, 49, 70, 57, 55, 40, 62, 35, 72, 40, and 76 respectively. Table 4.8: Descriptive Statistics Questions Sum Min Max Mean Standard Deviation Signing of a binding Contract Agreement 111 8 44 22.2 17.710 Open Competitive Bidding 111 7 50 22.2 17.710 Project Award to the lowest priced responsive bidder 111 7 46 22.2 14.925 Requalification of Contractors 111 5 53 22.2 18.381 Contractor's Programme of Works execution 111 2 60 22.2 22.581 Tender analysis and Evaluation 111 6 56 22.2 22.000 Tender Negotiation with Responsive Bidders 111 6 66 22.2 25.000 Detailed Project Design 111 6 41 22.2 14.000 Actual Verification of Performance/ Warranties 111 7 65 22.2 24.000 Due process compliance certificates 111 3 56 22.2 20.000 Total Building Commissioning 111 6 49 22.2 18.000 Standard Tender Documents for Procurement 111 3 70 22.2 27.000 Supervision of Project Implementation Stage 111 5 57 22.2 23.000 The Bid Evaluation Process 111 4 55 22.2 20.000 Project review and Certification 111 4 40 22.2 14.000 Standard request for Proposals for Selection of Consulting firms 111 3 62 22.2 23.000 Appropriation of budget allocation/or financial impacts 111 7 35 22.2 14.000 Contractor's Request for Clarification 111 3 72 22.2 28.000 Cost Benefit Analysis of the project 111 3 40 22.2 15.000 Statement of Essential Technical/Project Performance 111 3 76 22.2 30.000 4.3 Test of Research Hypothesis The following hypotheses were formulated to guide this study.
- 7. H01: Due Process contract mechanism has no significant influence on the Project performance in construction industry? H02: Due process policy has no significant effect on the performance of construction industry in Nigeria? Test of Hypothesis One: Computation The hypothesis can be tested using the data from the survey carried out. The H0 which is the null hypothesis and H1 which is the alternative hypothesis can be tested from the data available from the response to question which are related to Hypothesis one, for a clearer understanding this would be analysed in a tabular form below. Observed frequency table Question s A B C D E F G H I J Total SA 86 80 10 24 82 27 27 86 70 26 518 A 21 24 18 76 23 81 73 15 29 75 435 U 4 5 8 10 6 3 11 9 11 9 76 D 0 2 9 1 0 0 0 1 1 0 14 SD 0 0 66 0 0 0 0 0 0 1 67 Total 111 111 111 111 111 111 111 111 111 111 1110 Expected frequency table Formula
- 8. Expected frequency = Row total X Column total Grand total Expected frequency table Questions A B C D E F G H I J Total SA 51.8 51.8 51.8 51.8 51.8 51.8 51.8 51.8 51.8 51.8 518 A 43.5 43.5 43.5 43.5 43.5 43.5 43.5 43.5 43.5 43.5 435 U 7.6 7.6 7.6 7.6 7.6 7.6 7.6 7.6 7.6 7.6 76 D 1.4 1.4 1.4 1.4 1.4 1.4 1.4 1.4 1.4 1.4 14 SD 6.7 6.7 6.7 6.7 6.7 6.7 6.7 6.7 6.7 6.7 67 Total 111 111 111 111 111 111 111 111 111 111 1110 Contingency table Computation Chi Square = (Observed Frequency – Expected Frequency)2 Expected Frequency Contingency table A B C D E F G H I J SA 22.58 15.35 33.73 14.92 17.61 11.87 11.87 22.58 6.39 12.85 169.76 A 11.64 8.74 14.95 24.28 9.66 32.33 20.01 18.67 4.83 22.81 167.92 U 1.71 0.89 0.02 0.76 0.34 2.78 1.52 0.26 1.52 0.26 10.05 D 1.40 0.26 41.26 0.11 1.40 1.40 1.40 0.11 0.11 1.40 48.86 SD 6.70 6.70 524.85 6.70 6.70 6.70 6.70 6.70 6.70 4.85 583.30 Chi Square (X2) 979.888 Degree of freedom
- 9. Df = (R- 1) (C -1) (5 – 1) (10 -1) 4 x 9 Df = 36 Level of significance = 0.05 The chi-square distribution statistical table value is 50.998 Decision rule Since the computed value is greater than the table value then we reject the Null hypothesis (H0) which stated that Due Process contract mechanism has no significant influence on the Project performance in construction industry and accept the alternative hypothesis (H1) which stated that Due Process contract mechanism has significant influence on the Project performance in construction industry. From the observation of the test of hypothesis it is clearly depicted that the value of X2 is 979.89 and is greater than the table value of 50.998. Hence, we accept the alternative hypothesis which states that Due Process contract mechanism has significant influence on the Project performance in construction industry. Test of Hypothesis Two: Computation The hypothesis can be tested using the data from the survey carried out. The H0 which is the null hypothesis and H1 which is the alternative hypothesis can be tested from the data available
- 10. from the response to question which are related to Hypothesis one, for a clearer understanding this would be analysed in a tabular form below. Observed frequency table Questions Opt. 1 Opt. 2 Opt. 3 Opt. 4 Opt. 5 Total A 8 10.67 9.33 43.67 39.33 111 B 6.67 10.33 12.67 49.67 31.67 111 C 6.67 13.33 46 24 21 111 D 5.33 13 53.33 19.33 20 111 E 2.33 11 13 24.67 60 111 F 6 9.33 56.33 31.33 8 111 G 6 17 66 13 9 111 H 6.33 11.67 22.67 40.67 29.67 111 I 7 14 13.33 11.67 65 111 J 2.67 11.67 17.67 56 23 111 K 6 12.67 49.33 12.67 30.33 111 L 3 13 70 18.67 6.33 111 M 6 9.67 4.67 33.33 57.33 111 N 4.33 10 13.33 28.67 54.67 111 O 4.33 10.67 29.33 40 26.67 111 P 2.67 19 14.67 13 61.67 111 Q 8.33 7.33 34.33 35.33 25.67 111 R 3.33 7.33 12.33 16.33 71.67 111 S 2.67 11 28.33 28.67 40.33 111 T 2.67 10.33 11.67 10.67 75.67 111 Total 100.33 233 578.33 551.33 757 2220
- 11. Expected frequency table Formula Expected frequency = Row total X Column total Grand total Expected frequency table Question Opt. 1 Opt. 2 Opt. 3 Opt. 4 Opt. 5 Total A 5.017 11.65 28.92 27.57 37.85 111 B 5.017 11.65 28.92 27.57 37.85 111 C 5.017 11.65 28.92 27.57 37.85 111 D 5.017 11.65 28.92 27.57 37.85 111 E 5.017 11.65 28.92 27.57 37.85 111 F 5.017 11.65 28.92 27.57 37.85 111 G 5.017 11.65 28.92 27.57 37.85 111 H 5.017 11.65 28.92 27.57 37.85 111 I 5.017 11.65 28.92 27.57 37.85 111 J 5.017 11.65 28.92 27.57 37.85 111 K 5.017 11.65 28.92 27.57 37.85 111 L 5.017 11.65 28.92 27.57 37.85 111 M 5.017 11.65 28.92 27.57 37.85 111 N 5.017 11.65 28.92 27.57 37.85 111 O 5.017 11.65 28.92 27.57 37.85 111 P 5.017 11.65 28.92 27.57 37.85 111 Q 5.017 11.65 28.92 27.57 37.85 111 R 5.017 11.65 28.92 27.57 37.85 111 S 5.017 11.65 28.92 27.57 37.85 111 T 5.017 11.65 28.92 27.57 37.85 111 Total 100.33 233 578.33 551.33 757 2220 Contingency table Computation Chi Square = (Observed Frequency – Expected Frequency)2 Expected Frequency
- 12. Contingency table 1 2 3 4 5 A 1.77 0.08 13.26 9.40 0.06 24.58 B 0.54 0.15 9.13 17.72 1.01 28.55 C 0.54 0.24 10.09 0.46 7.50 18.84 D 0.02 0.16 20.62 2.46 8.42 31.67 E 1.44 0.04 8.76 0.31 12.96 23.50 F 0.19 0.46 25.99 0.51 23.54 50.70 G 0.19 2.46 47.56 7.70 21.99 79.89 H 0.35 0.00 1.35 6.23 1.77 9.69 I 0.78 0.47 8.40 9.17 19.47 38.30 J 1.10 0.00 4.38 29.33 5.83 40.63 K 0.19 0.09 14.42 8.05 1.49 24.24 L 0.81 0.16 58.37 2.87 26.24 88.45 M 0.19 0.34 20.34 1.21 10.03 32.10 N 0.09 0.23 8.40 0.04 7.47 16.24 O 0.09 0.08 0.01 5.61 3.30 9.09 P 1.10 4.64 7.02 7.70 14.99 35.44 Q 2.19 1.60 1.01 2.19 3.92 10.92 R 0.56 1.60 9.51 4.58 30.21 46.46 S 1.10 0.04 0.01 0.04 0.16 1.36 T 1.10 0.15 10.29 10.36 37.78 59.68 Chi Square (X2) 670.36
- 13. Degree of freedom Df = (R- 1) (C -1) (20 – 1) (5 -1) 19 x 4 Df = 76 Level of significance = 0.05 The chi-square distribution statistical table value is 101.88 Decision rule Since the computed value is greater than the table value then we reject the Null hypothesis (H0) which stated that due process policy has no significant effect on the performance of construction industry in Nigeria and accept the alternative hypothesis (H1) which stated that Due process policy has significant effect on the performance of construction industry in Nigeria. From the observation of the test of hypothesis it is clearly depicted that the value of X2 is 670.36 and is greater than the table value of 101.88. Hence, we accept the alternative hypothesis which states that Due process policy has significant effect on the performance of construction industry in Nigeria. 4.4 Discussion of Findings The findings of the study are based on the data evaluated, observation made in the course of the study and the inference from the result of the hypothesis tested. These findings have been identified by the researchers into specific and general findings. In regard to specific finding from the data analysed, the following observations were made:
- 14. 1. Due Process contract mechanism has significant influence on the Project performance in construction industry. 2. Due process policy has significant effect on the performance of construction industry in Nigeria. The general findings are discussed as follows: There is a positive influence in observing due process in the awards of public contracts using mechanism that establish transparency and fair play in contract procedures for procurement of public contract. The mechanisms has established transparency and fair play in contract procedures for procurement of public contracts and allow participation of reputable, competent and reliable contractors. The due process mechanism ensures utmost good faith by tenders in the tendering mechanism. There are regulating and standards to enforce harmonizing bidding and tender documents in contract bidding and formulation of general policies and guideline on public sector procurement and monitoring prices of tendered items and provide data base advisors. There are documenting and monitoring of government projects to completion and ensuring that executed contracts are according to specification and costs.
- 15. CHAPTER FIVE SUMMARY, CONCLUSION AND RECOMMENDATION 5.1 Summary This study was basically carried out to evaluate the impact of policy and procedural framework on project performance in construction industry in Abuja, Nigeria. The study was able to examine the various methods used contract awarding procedures in Abuja, Nigeria in promoting due process in the construction industry. This research work went further to examine the due process policy significance on the performance of construction industry in Nigeria. 5.2 Conclusion Despite the air of secrecy surrounding project performance data from due process offices, the following were highlights of few interviews granted: Under due process, contract sum must never be exceeded. In other words Contract Sum must be lesser than or equal to Total Project Cost- except in special situations such as Client-initiated scope change. E.g. request for additional floor by Client. Due process contracts are mostly fixed contracts. On issue of timely delivery, about 70% of the delay encountered in government projects, were due to intermittent funding pattern/ delayed settlement of payment certificates. According to him, the payment certificates sometimes may remain unpaid for 2 to 3 months or more due to administrative bottlenecks involved. Or on Federal government sponsored projects, the funds are released in phases. Consequently, this makes contractor to submit delay related claims (request for extension of time and preliminaries)- and in a particular situation, the contractor charged bank interest (cost of finance) as an item of claim.
- 16. Quality of projects is better guaranteed under due process. Prequalification and better documentation and contract and milestone certifications/ project support services from the parastatals helps deliver better quality of works. 5.3 Recommendations The implication of this study is that it serves as a feedback to the construction stakeholders in Nigeria and contains useable information for optimizing the existing due process mechanism to enhance not only probity, accountability, transparency and competition in public contract awards, but also the policy’s resultant effects on quality of executed projects, delivery-on- budget and time considerations. The international community, especially developing countries will also benefit from the Nigerian procurement reform. Future research direction would be on elemental analysis of variance between initial Bill of Quantities (BOQ) and final account of selected projects under due process– to verify grey areas of cost prediction /budgeting under Due Process.
- 17. 1.3 Objectives of the Study The objectives set to unveil the relationship and effect of policy and procedural framework on Project performance in Construction industry in Abuja, Nigeria. Specific objectives include; 1. To ascertain the influence of due Process contract mechanism on the Project performance in construction industry 2. To establish the effect of due process policy on the performance of construction industry in Nigeria. 1.4 Research Questions The study sought to answer the following research questions: 1. What is the influence of due Process contract mechanism on the Project performance in construction industry? 2. What is the effect of due process policy on the performance of construction industry in Nigeria? 1.5 Research Hypotheses H01: Due Process contract mechanism has significant influence on the Project performance in construction industry? H02: Due process policy has significant effect on the performance of construction industry in Nigeria?