Time Spent on Digital Media
•Als PPTX, PDF herunterladen•
0 gefällt mir•26 views

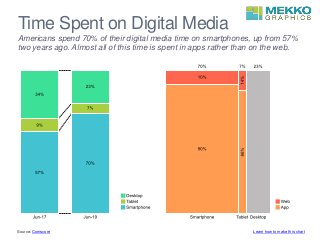
Americans spend 70% of their digital media time on smartphones, up from 57% two years ago, as shown in the 100% stacked bar chart on the left. Time spent on desktops went down from 34% to 23% and time spent on tablets went down from 9% to 7%. Almost all of this time is spent in apps rather than on the web, as shown in the Marimekko chart on the right. On smartphones, 90% of time is in apps and on tablets 84% is spent in apps. Data are compiled by Comscore
Melden
Teilen
Melden
Teilen
Empfohlen
Empfohlen
VIP Call Girls Napur Anamika Call Now: 8617697112 Napur Escorts Booking Contact Details WhatsApp Chat: +91-8617697112 Napur Escort Service includes providing maximum physical satisfaction to their clients as well as engaging conversation that keeps your time enjoyable and entertaining. Plus they look fabulously elegant; making an impressionable. Independent Escorts Napur understands the value of confidentiality and discretion - they will go the extra mile to meet your needs. Simply contact them via text messaging or through their online profiles; they'd be more than delighted to accommodate any request or arrange a romantic date or fun-filled night together. We provide –(Anamika) VIP Call Girls Napur Call Now 8617697112 Napur Escorts 24x7
(Anamika) VIP Call Girls Napur Call Now 8617697112 Napur Escorts 24x7Call Girls in Nagpur High Profile Call Girls
Weitere ähnliche Inhalte
Mehr von Mekko Graphics
Mehr von Mekko Graphics (20)
Choosing the Right Chart: Strategies for Effectively Presenting Data
Choosing the Right Chart: Strategies for Effectively Presenting Data
Kürzlich hochgeladen
VIP Call Girls Napur Anamika Call Now: 8617697112 Napur Escorts Booking Contact Details WhatsApp Chat: +91-8617697112 Napur Escort Service includes providing maximum physical satisfaction to their clients as well as engaging conversation that keeps your time enjoyable and entertaining. Plus they look fabulously elegant; making an impressionable. Independent Escorts Napur understands the value of confidentiality and discretion - they will go the extra mile to meet your needs. Simply contact them via text messaging or through their online profiles; they'd be more than delighted to accommodate any request or arrange a romantic date or fun-filled night together. We provide –(Anamika) VIP Call Girls Napur Call Now 8617697112 Napur Escorts 24x7
(Anamika) VIP Call Girls Napur Call Now 8617697112 Napur Escorts 24x7Call Girls in Nagpur High Profile Call Girls
Falcon stands out as a top-tier P2P Invoice Discounting platform in India, bridging esteemed blue-chip companies and eager investors. Our goal is to transform the investment landscape in India by establishing a comprehensive destination for borrowers and investors with diverse profiles and needs, all while minimizing risk. What sets Falcon apart is the elimination of intermediaries such as commercial banks and depository institutions, allowing investors to enjoy higher yields.Falcon Invoice Discounting: The best investment platform in india for investors
Falcon Invoice Discounting: The best investment platform in india for investorsFalcon Invoice Discounting
Kürzlich hochgeladen (20)
Call Girls Hebbal Just Call 👗 7737669865 👗 Top Class Call Girl Service Bangalore
Call Girls Hebbal Just Call 👗 7737669865 👗 Top Class Call Girl Service Bangalore
(Anamika) VIP Call Girls Napur Call Now 8617697112 Napur Escorts 24x7
(Anamika) VIP Call Girls Napur Call Now 8617697112 Napur Escorts 24x7
FULL ENJOY Call Girls In Majnu Ka Tilla, Delhi Contact Us 8377877756
FULL ENJOY Call Girls In Majnu Ka Tilla, Delhi Contact Us 8377877756
Nelamangala Call Girls: 🍓 7737669865 🍓 High Profile Model Escorts | Bangalore...
Nelamangala Call Girls: 🍓 7737669865 🍓 High Profile Model Escorts | Bangalore...
Value Proposition canvas- Customer needs and pains
Value Proposition canvas- Customer needs and pains
Call Girls From Raj Nagar Extension Ghaziabad❤️8448577510 ⊹Best Escorts Servi...
Call Girls From Raj Nagar Extension Ghaziabad❤️8448577510 ⊹Best Escorts Servi...
Eluru Call Girls Service ☎ ️93326-06886 ❤️🔥 Enjoy 24/7 Escort Service
Eluru Call Girls Service ☎ ️93326-06886 ❤️🔥 Enjoy 24/7 Escort Service
Call Girls Ludhiana Just Call 98765-12871 Top Class Call Girl Service Available
Call Girls Ludhiana Just Call 98765-12871 Top Class Call Girl Service Available
Falcon Invoice Discounting: The best investment platform in india for investors
Falcon Invoice Discounting: The best investment platform in india for investors
Call Girls Zirakpur👧 Book Now📱7837612180 📞👉Call Girl Service In Zirakpur No A...
Call Girls Zirakpur👧 Book Now📱7837612180 📞👉Call Girl Service In Zirakpur No A...
BAGALUR CALL GIRL IN 98274*61493 ❤CALL GIRLS IN ESCORT SERVICE❤CALL GIRL
BAGALUR CALL GIRL IN 98274*61493 ❤CALL GIRLS IN ESCORT SERVICE❤CALL GIRL
Lundin Gold - Q1 2024 Conference Call Presentation (Revised)
Lundin Gold - Q1 2024 Conference Call Presentation (Revised)
Business Model Canvas (BMC)- A new venture concept
Business Model Canvas (BMC)- A new venture concept
Falcon Invoice Discounting: Empowering Your Business Growth
Falcon Invoice Discounting: Empowering Your Business Growth
Chandigarh Escorts Service 📞8868886958📞 Just📲 Call Nihal Chandigarh Call Girl...
Chandigarh Escorts Service 📞8868886958📞 Just📲 Call Nihal Chandigarh Call Girl...
Time Spent on Digital Media
- 1. Time Spent on Digital Media Americans spend 70% of their digital media time on smartphones, up from 57% two years ago. Almost all of this time is spent in apps rather than on the web. Learn how to make this chartSource: Comscore