CALL ON ➥8923113531 🔝Call Girls Kesar Bagh Lucknow best Night Fun service 🪡
Effects of outliers on productivity analyses based on Farm Accountancy Data Network (EU-FADN-DG AGRI)
1. Effects of outliers on productivity analyses based on
the Farm Accountancy Data Network (EU-FADN - DG AGRI)
Thomas Kirschstein∗
, Mathias Kloss†
, Steffen Liebscher∗
, Martin Petrick†
∗
Martin-Luther-University Halle-Wittenberg, †
Leibniz Institute of Agricultural Development in Central and Eastern Europe (IAMO)
Motivation
2005 2006 2007 2008 2009 2010 2011 2012
05000150002500035000
year
deflatedgrossvalueaddedofthe
agriculturalindustryinEURmillion
Germany Spain France Italy UK
• stagnating agricultural productivity
• data used for productivity analysis may con-
tain abnormal observations (outliers)
• in this work a two-step approach is used that
combines
– non-parametric multivariate outlier
identification procedures
– production function estimation
Data base
• FADN individual farm-level data for Ger-
many (East/West) made available by the EC
FADN code Variable description
Outputs
SE131 Total output (EUR)
Inputs
SE011 Labour input (hours)
SE025 Total utilised agricultural
area (ha) = land
SE275 Total intermediate consump-
tion (EUR) = materials
SE360 Depreciation (EUR) = fixed
capital
Conclusion
• outliers present in samples influence elasticity
estimates
• after outlier correction returns-to-scale signifi-
cantly = 1
• outliers: small companies (East) and labour-
intensive companies (West)
⇒ decision makers should consider advanced
outlier detection procedures
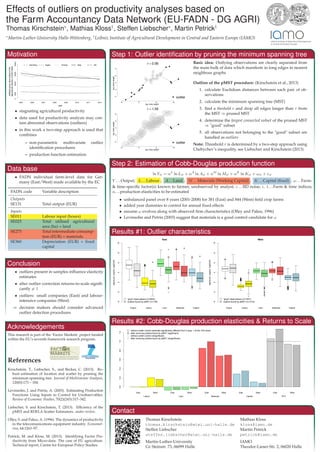
Step 1: Outlier identification by pruning the minimum spanning tree
q
q
qq
q
q
q
q
q
q
q
q
q
q
q
q
q
q
q
q
q
q
q
q
q
q
q
q
−5 0 5 10
02468
log. body weight
log.brainweight
outlier
r = 0.56
q
q
qq
q
q
q
q
q
q
q
q
q
q
q
q
q
q
q
q
q
q
q
q
q
q
q
q
−5 0 5 10
02468
log. body weight
log.brainweight
outlier
r = 1.55
Basic idea: Outlying observations are clearly separated from
the main bulk of data which manifests in long edges in nearest
neighbour graphs
Outline of the pMST procedure: (Kirschstein et al., 2013)
1. calculate Euclidean distances between each pair of ob-
servations
2. calculate the minimum spanning tree (MST)
3. find a theshold r and drop all edges longer than r from
the MST ⇒ pruned MST
4. determine the largest connected subset of the pruned MST
⇒ "good" subset
5. all observations not belonging to the "good" subset are
handled as outliers
Note: Threshold r is determined by a two-step approach using
Chebychev’s inequality, see Liebscher and Kirschstein (2013)
Step 2: Estimation of Cobb-Douglas production function
ln Yit = αL
ln Lit + αA
ln Ait + αM
ln Mit + αK
ln Kit + ωit + εit
Y . .. Output; L...Labour ; A...Land ; M...Materials (Working Capital) ; K...Capital (fixed) ; ω...Farm-
& time-specific factor(s) known to farmer, unobserved by analyst; ε...IID noise; i, t...Farm & time indices;
α. .. production elasticities to be estimated
• unbalanced panel over 8 years (2001-2008) for 381 (East) and 844 (West) field crop farms
• added year dummies to control for annual fixed effects
• assume ω evolves along with observed firm characteristics (Olley and Pakes, 1996)
• Levinsohn and Petrin (2003) suggest that materials is a good control candidate for ω
Results #1: Outlier characteristics
qqqqqqqqqqqqqqq
qq
qqqqq
qqq
q
q
q
q
q
q
qq
East
qq
q
qqqqqq
q
q
qq
qqqq
qqqqq
qq
qq
qq
−20246810
log(hours),log(ha),log(EUR)
Output Labour Land Materials Capital
'good' observations (n=3652)
outliers found by pMST (n=139)
qqq
q
q
qq
q
qq
q
qqqqqqqqqqq
qqqqqq
q
q
qq
qqq
qqqqq
qqq
q
qq
qq
qqqqqq
qqqqqqqqqqqq
qqqqqq
qq
q
q
qqqq
qq
q
qq
qqqqqqq
q
q
qq
qq
q
qqq
qq
q
qqqqqq
qqq
q
qqqq
qq
q
q
qqqqqqq
q
q
q
qqqq
qqq
q
qq
qq
q
qqqq
q
qqqqq
q
q
qq
q
qqqqqqq
qq
qq
q
q
q
qq
q
qq
qqqqqqq
q
qq
qqq
qq
q
qqq
q
qqqqqqqqqqqq
qqqqq
West
qq
q
q
q
q
q
q
q
q
qq
q
q
qqqqqq
q
qqq
qq
qq
qqq
−20246810
log(hours),log(ha),log(EUR)
Output Labour Land Materials Capital
'good' observations (n=7481)
outliers found by pMST (n=1210)
Results #2: Cobb-Douglas production elasticities & Returns to Scale
0.00.20.40.60.81.01.2
East West East West East West East West East West
Labour Land Materials Capital RTS
without outlier control (estimate significantly different from 0 resp. 1 at the 10% level)
after removing outliers found by pMST (significant)
without outlier control (insignificant)
after removing outliers found by pMST (insignificant)
Acknowledgements
This research is part of the ’Factor Markets’ project funded
within the EU’s seventh framework research program.
References
Kirschstein, T., Liebscher, S., and Becker, C. (2013). Ro-
bust estimation of location and scatter by pruning the
minimum spanning tree. Journal of Multivariate Analysis,
120(0):173 – 184.
Levinsohn, J. and Petrin, A. (2003). Estimating Production
Functions Using Inputs to Control for Unobservables.
Review of Economic Studies, 70(2)(243):317–342.
Liebscher, S. and Kirschstein, T. (2013). Efficiency of the
pMST and RDELA Scatter Estimators. under review.
Olley, S. and Pakes, A. (1996). The dynamics of productivity
in the telecomunications equipment industry. Economet-
rica, 64:1263–97.
Petrick, M. and Kloss, M. (2013). Identifying Factor Pro-
ductivity from Micro-data: The case of EU agriculture.
Technical report, Centre for European Policy Studies.
Contact
Thomas Kirschstein Mathias Kloss
thomas.kirschstein@wiwi.uni-halle.de kloss@iamo.de
Steffen Liebscher Martin Petrick
steffen.liebscher@wiwi.uni-halle.de petrick@iamo.de
Martin-Luther-University IAMO
Gr. Steinstr. 73, 06099 Halle Theodor-Lieser-Str. 2, 06020 Halle