Rough cut connect2-xyz
•
1 gefällt mir•21 views

This document discusses connecting data between SharePoint, Tableau, and IBM BPM. It provides concepts and examples for extracting data from SharePoint into Tableau using a data extract utility. It also discusses capturing production data like story points and weighted hours to calculate costs. Finally, it addresses treating certain digital assets like portals and applications as capital expenditures to be depreciated over multiple years for accounting purposes.

Empfohlen
Weitere ähnliche Inhalte
Was ist angesagt?
Was ist angesagt? (18)
Ähnlich wie Rough cut connect2-xyz
Ähnlich wie Rough cut connect2-xyz (20)
Mehr von Brij Consulting, LLC
Mehr von Brij Consulting, LLC (20)
Kürzlich hochgeladen
Kürzlich hochgeladen (20)
Rough cut connect2-xyz
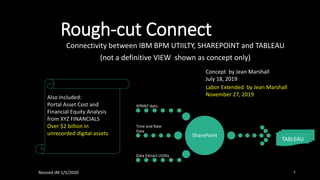
- 1. Rough-cut Connect Connectivity between IBM BPM UTIILTY, SHAREPOINT and TABLEAU (not a definitive VIEW shown as concept only) Concept by Jean Marshall July 18, 2019 SharePoint SPRINT data Time and Rate Data Data Extract Utility TABLEAU Also Included: Portal Asset Cost and Financial Equity Analysis from XYZ FINANCIALS Over $2 billion in unrecorded digital assets Labor Extended by Jean Marshall November 27, 2019 1Revised JM 1/5/2020
- 2. SharePoint>TABLEAU>IBM BPM CONNECT In order to obtain the correct dashboard concept the data has to be articulated in the fields even from alternate sources such as data entry, rate or time based utilizations and sprint 2
- 3. SharePoint List Creation • Create the List from the Database for Tableau • Data is derived for the underlying strength of the Dashboard • Course also shows utilizing external data • Azure connectivity is sponsored • Tableau shows connects TABLEAU SHAREPOINT Extracted from a SharePoint Course and a Tableau Knowledge base 3
- 5. Costed Sprint Level Reporting Brij Consulting, LLC July 18, 2019 5
- 7. Portal Asset Investment Cost We believe that Portal Asset Cost is an important financial construction and should be booked as a Leasehold Improvement as part of the Bank’s Financial Statement, in order to replace Brick and Mortar Bank Assets… see next slide Figures on this slide do not correspond to case example following 7
- 8. XYZ INTERPOLATION from FINANCIALS Equity Loss interpolation from XYZ FINANCIAL STATEMENT 8 S&P reports this as a UNIVERSAL PROBLEM
- 9. GAAP REQUIREMENT • Section 3350: Internal-use Software [U.S. GAAP before the Codification] 350-40 Internal-use software AICPA SOP 98-1, Accounting for the Costs of Computer Software Developed or Obtained for Internal Use 1. Three stages to develop software (1) Preliminary project stage (2) Application development stage (3) Post-implementation/operation stage 2. Preliminary project stage --> Costs are expensed as incurred 3. Application development stage --> Costs to develop internal-use software --> during the application development stage --> are capitalized 4. Post-implementation/operation stage --> Costs are expensed as incurred 5. Upgrades and enhancements to software --> Costs may be capitalized --> if "additional functionality" is added 6. Capitalized software costs --> are amortized on a "straight line" basis --> over the estimated useful life and --> should be reviewed for impairment Capitalization of revenue producing portal assets (leasehold improvement) 9
- 10. PRODUCTION DATA 10 Production Data has a unique quality of being weighted by the means of the factory or facility burden It is not merely the matter of applying the hours x labor rate but it is weighted hours along the critical path x labor rate x burden rate Product metrics have to include the facility cost and the frame application (this is why the story points should be included in product cost.) Ultimately the Production if it can be carried at the level of an asset bears up the burden that is not being sold at a margin, by increasing the internal margin of the company. This builds the equity relationship.
- 11. Weighted Product Time includes Story Points of all Directs The direct rate is the hands on labor + contractors Split between upgrade and maintenance The use of a one individual table is pointing to the econometric standard product Each individual direct rate needs to be applied to each individual product outcome (not as shown) 11
- 13. Units Delivered GAAP BASIS DIALOGUE The Reason for suggesting this example of unit reporting on Sprint Costs is to evaluate the Invested Value of Portal Assets being developed and to attempt a depiction of the kind of information required; This is likened to a Production Asset in a Kanban Manufacturing Environment. Completed Delivery ? WIP Portal Assets Metrics Y N 13 Digital Forms L-T Inventory on Revenue Items for External Facing Applications
- 14. Burden Calculation • The Burden Calculation related to production includes all costs necessary to the satisfactory delivery of the production to its portal operation ready state. • Another type of burden is the Asset burden against the cost of maintenance including amortization. In our broad example both happen to be equal. Lifting the capital cost of portal assets off of the income statement is a relief of the business performance factors to supply for internal capital and technological advancement in the future of product development. 14
- 15. Econometrics for Individual Performance Measures (Suggested) It appears to be prudent to use the weighted individual performance based on the accomplishment of a more complex project which marks level of performance. Notice beginner figure of 230 is a solid econometric measure as a min. standard. Actual rates can be used, otherwise variance is booked in recording production 15
- 16. Accounting This type of Accounting (Self- Constructed Portals) would be new to most industries, since it is unique to manufacturing of inhouse construction of platforms for machinery and equipment. Before proceeding check with Auditors for recommendations. 16Revised JM 1/5/2020 Sample journal entry Record Payroll and Overhead Expenses Total Company Ops Volume Adjusted As Booked 5.89 192,295,752.34 32,640,000.00 326400 Payroll Expense (4 person payroll only) 2,003,080.75 340,000.00 3400 Vacation Pay 42.5 80 3400 60,982,631.76 10,351,102.80 103,511 Fringes s/b actual 0.31386 329800103,511 38,830,621.79 6,591,053.00 65,911 Overhead s/b actual 0.19985 32980065,911 615,927.30 104,546.60 1,045 G&A Expense s/b actual 0.00317 3298001,045 (294,728,013.94) (50,026,702.40) (500,267) Expense Clearing 180,584,645.94 30,652,173.91 306,521.74 Standard Labor 11,711,106.40 1,987,826.09 19,878.26 Variance to Actual Labor Applied 1.581 848,348,031.08 143,997,355.10 1,439,973.55 Production Cost 883,712,097.16 150,000,000.00 1,500,000.00 Standard Production Cost 35,364,066.08 6,002,644.90 60,026.45 Favorable Variance (1.29) 227,659,818.42 38,642,644.90 386,426.45 Total Production Related Costs (67,068,195.53) (11,384,057.50) (113,840.58) 188,960,887.69 32,073,944.95Maintenance 38,698,930.73 6,568,699.95Upgrade Assets 227,659,818.42 38,642,644.90Sum 5.89 COMPANY ENTRY Local Entry (294,728,013.94) (50,026,702.40) 38,698,930.73 6,568,699.95 Book Portal Maintenance 188,960,887.69 32,073,944.95 Book Self- Constructed Assets 67,068,195.53 11,384,057.50Book CIP/WIP - -Book Miscellaneous 0.00 0.00Net Note: Standard Costs enable the reconciliation of units that permit a more refined delivery mechanic too difficult to deploy in a brief example
- 17. Digital Assets to be Capitalized • Revenue Earning Platforms for Customer and Vendor Transactions • Templates, Models and Customized Applications for Subscriptions that are currently in use (Long-Term Production Asset) • Specialized Digitalized Assets for Education and Professional use that are intellectually devised as a Design Base Model, can be held as a long-term asset. • When the model is consumed in a lease-arrangement it can be amortized and should be reviewed for impairment by technological obsolescence • When it is held as a template program is an inventoriable item because it has a value associated with it, that is a stock item for the company. 17 CHECK FOR GAAP COMPLIANCE
- 18. Digital Asset Leveraging Model 18 • Our belief is that Virtual Glass would provide a great metric and interpolative scheme for transitional and transformative enterprise
- 19. 19 Justification Standards Approach using multi-source rate comparison ROI IS ON EQUITY BASIS
- 20. Asset Recapitalization • Putting Soft Structure in the form of Digital Portals, Forms and Applications to work in the present cycle of business • Capitalize Portal Assets for a life of 17 years based on initial cost plus labor to install plus upgrade cost, plus the cost of forms carried as inventory, write off in 3 years and the cost of applications capitalized over 3 years. (Suggested) 20
- 21. Size, Scale, Form and Method XYZ COMPANY Balance Sheet ($Millions USD) as of Dec. 31, 2017 as of Dec. 31, 2017 ASSETS LIABILITIES & EQUITY Current Assets Liabilities Checking/Savings Long Term Liabilities Checking $ 85 Deferred Charges- Inventory $ 6,796 Savings 100 Total Long-Term Liabilities 6,796 Total Checking/Savings 185 Total Liabilities 6,796 Total Current Assets 185 Equity Fixed Assets Capital Investment 391 Accumulated Depreciation (550) Opening Balance Equity 5,108 Furniture and Equipment 1,523 Owner Funding 3,104 Total Fixed Assets 973 Net Income (3,612) Other Assets Total Equity 4,991 Copyrights 149 TOTAL LIABILITIES & EQUITY $ 11,787 Production Inventory 10,480 Total Other Assets 10,629 TOTAL ASSETS $ 11,787 Equity Statement of Change as of Dec. 31, 2017 as of Dec. 31, 2016 Change +/- Capital Investment $ 391 391 $ - Opening Balance Equity 5,108 3,466 1,642 Owner Funding 3,104 1,683 1,421 Net Income (3,612) (39) (3,573) Total Equity $ 4,991 5,501 $ (510) 21 XYZ COMPANY ASSETS as of Dec. 31, 2018 Current Assets Checking/Savings Checking $ 84 Savings $ 101 Total Checking/Savings $ 184 Total Current Assets $ 184 Fixed Assets Accumulated Depreciation (1,059) Furniture and Equipment 1,523 Total Fixed Assets 465 Other Assets Copyrights 149 Production Inventory 10,480 Total Other Assets 10,629 TOTAL ASSETS $ 11,278 LIABILITIES& EQUITY Liabilities Long Term Liabilities Deferred Charges- Inventory $ 6,796 Total Long Term Liabilities 6,796 Total Liabilities 6,796 Equity Capital Investment 392 Opening Balance Equity 4,600 Owner Funding 2,674 Net Income (3,183) Total Equity 4,482 FMV TOTAL LIABILITIES& EQUITY $ 11,278 1,533 (0) 12,811.34 Equity Statement Current Yr Capital Investment $ 392 Opening Balance Equity 4,600 Owner Funding 2,674 Net Income (3,183) Total Equity $ 4,482 XYZ COMPANY Summary Equity 4,482 Deferred Charges- Inventory 6,796 Inventory Asset 11,278 10,480 Cash - 184 Copyrights 149 Net Property 465 Sum Assets $ 11,278 This type of Accounting would be new to most industries, however we believe that there are several subjects notable in the delivery of the reporting method. In this example the Digital Template such as the Dashboard or the EXTERNAL FACING FORMS that deliver Customer Details are part of what is PRODUCTION INVENTORY. It would be important to keep it separated from CIP Assets, or self-constructed portals as they are not amortized but when discarded should be removed from the inventory, and must be upgraded to avoid obsolescence. The other aspect of reporting is that unless size and scale is maintained within the reporting cycle on various client compositions, the REAL metric relationship is lost. The utility of the bank or institution has to have its own metrics in order to interpolate its wealth management and this is critical in preparing dashboards and other devices for the scaled view of requirements. This startup company is using digital software and the performance subsidy of other companies to do its work and it appears as though it is not achieving a financial goal. The Intellectual property that it is building in its knowledge base and the capability of servicing its clients is not recorded, and it appears to be unstructured. But in terms of scale and industry issues it gets lost in a sea of hardware companies that appear to be outperforming its affiliated nature. Also the Market Value of its product offering may be under-rated. STARTUP COMPANY INVESTING IN DIGITAL PORTFOLIO 2016 2017 2018 Sales 1,500 10 1,533 EBITDA 469 (3,104) (2,675) Assets 12,297 11,787 11,278 Equity 5,501 4,991 4,482 Asset Turns 0.12 0.00 0.14 Margin 31% -31040% -174% ROA 3.8% -26.3% -23.7% Assets/Equity 2.24 2.36 2.52 ROI 9% -62% -60% 9% -62% -60% Notice that the burden composition of the business gets little relief from its digital dependency on a soft form of structure Bit Form Theory should supply a Plait invested Asset Structure Four Improvements: 1. Recapitalization of Digital Assets 2. Digital Plait 3. Forward Facing Portal with client accessibility 4. Workforce Availability with capital replenished 5. Wealth Management
- 22. PARAMETRIC TEST 22 - 1,000.00 2,000.00 3,000.00 4,000.00 Econometric Time Distr. TransitionBurden Map Parametric Distribution Cost of Assets Upgrade Assets Maintenance $- $500,000,000.00 $1,000,000,000.00 $1,500,000,000.00 $2,000,000,000.00 $2,500,000,000.00 Cost of Assets Upgrade Assets Maintenance Sum of Cost BOOK INFERENCE Using Econometrics we derived a universal and scalable approach to this problem
- 23. Valued Partnering to IBM BPM 23 • https://www.hcltech.com/financial-services/retail-corporate-banking • https://www.hcltech.com/digital-process-operations/toscana