Mind map us auto case study by manpreet singh digital
•
5 gefällt mir•2,013 views

solution of US auto Case study, by Manpreet Singh Digital

Empfohlen
Weitere ähnliche Inhalte
Ähnlich wie Mind map us auto case study by manpreet singh digital
Ähnlich wie Mind map us auto case study by manpreet singh digital (20)
Mehr von Manpreet Singh Chhabra
Mehr von Manpreet Singh Chhabra (20)
Kürzlich hochgeladen
Kürzlich hochgeladen (20)
Mind map us auto case study by manpreet singh digital
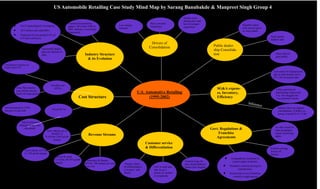
- 1. Revenue Streams Cost Structure Industry Structure & its Evolution Customer service & Differentiation Govt. Regulations & Franchise Agreements U.S. Automotive Retailing (1995-2002) Drivers of Consolidation New vehicles gives 50-60% i.e $ 410 bn (7-8% profit margin Used vehicle, $379 bn 11-13% profit margin Service & parts $ 118 bn, 45-55% profit margin Insurance & finance $93 bn, 100 margin, per unit Low cost Variable cost (62%) Fixed (38 %) Compensation expenses are Largest about 47% Floor Plan interest cost critical success factor for large player Advertising led to 125% increase in unit sold Std OverHead in- cluding leasing were accounted Primary factor of differentiation is location and Brand NACA rated auto Ind. As no.1 source of custom- er complaints. Limited scope for price based differen- tiation (low margin) Geographical constraints to protect rights of dealers. Mandatory uniform pricing by manufactures. Restrictions to no.of franchise owned by single person Uniform pricing Across all Dealers. No other dealer in same geographic region, protecting rights. Automobile dealer- ship sole channel of sales. 22131 dealerships,$1 trn industry 38.5 million unit sold(2001) Employed 6.6 mn people(4.5% of US total workforce) Franchise decreased by approx. 20% from 1980 to 2001. Industry is extremely fragmented. Public dealer- ship Consolida- tion Republic indus- tries went to grow as Auto nation Sonic group highest sales Many players goes public Low margin business Poor consumer Experience Dealers were strong and could have leveraged acquisition SG&A expens- es, Inventory, Efficiency It accounts for high percent- age of sales bottom out to $1-1.5bn in annual sales Lithia experienced diminishing returns and UA, AN struggles for +ve economic returns . Industry does not support consolidation, if SG&A ex- penses exceeds $1.0-1.5 Bn Inference US Automobile Retailing Case Study Mind Map by Sarang Banubakde & Manpreet Singh Group 4