2. 4124 Sci. Res. Essays
Table 1. Chemical composition of the powders used for mechanical alloying.
Element Ni Cr Al2O3 Ti Y2O3
Wt (%) Balance 20 4 0.6 0.4
(a) (b)
(c) (d)
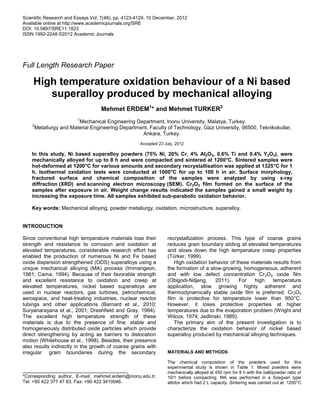
Figure 1. SEM images of the oxidized sample surface for various duration: (a) 1,
(b) 10, (c) 50 and (d) 100 h.
and then samples were deformed by 75%. After cutting the samples
by using an electro erosion device, secondary recrystallization
process was applied at 1325°C for 1 h. The surface area of sample
was grinded and polished before calculating the surface area and
then the sample was weighed with the accuracy of 10-5
g.
Isothermal oxidation tests were conducted at 1000°C for 1, 10, 50
and 100 h in air. After removal from the furnace, the weight change
of each sample, which eventually includes losses due to spalling,
was measured using a Sartorius balance with the accuracy of
1/10000. In order to obtain reliable results, all samples were
weighed at least three times and the mean weight was calculated.
For scanning electron microscopy (SEM) analysis, samples were
fractured in liquid nitrogen.
To preserve the integrity of the brittle oxide layer on the surface of
the samples during the metallographic processes and for the
purpose of determination of the oxide thickness, the material
surfaces were electroplated with Ni to a thickness of about 10 µm.
To facilitate the nucleation process, each sample was sputter
coated with a layer (about 40 nm) of gold in order to assist in the
nucleation of the deposit on the insulating oxide film. Metallographic
mounts of the sample were performed using standard
metallographic techniques and then the samples were etched with
Marbel solution. Characterization of the surface appearance of the
samples after oxidation test was performed using JEOL JSM-6060
LV scanning electron microscope and XRD analyses were done by
Bruker D 8 Advance device.
RESULTS AND DISCUSSION
Oxidation behavior
The structure of surface topology of the samples,
exposed during 1, 10, 50 and 100 h, is shown in Figure
1a to d, respectively. After 1 h exposure (Figure 1a), a
very thin oxide layer consisting of fine particles appeared.
Increasing the exposure time to 10 h (Figure 1b), more
oxide particles covered the surface when compared to
the sample exposed for 1 h. Increasing the exposure time
to 50 h (Figure 1c), oxide film covered the entire surface
with coarse oxide particles. Further increase in the
oxidation time to 100 h (Figure 1d) caused the oxide
particles to cover the entire surface and some particle
coarsening (1 to 10 µm) at the surface also occurred.
Furthermore, the oxide film formed on the surface was
3. Table 2. Values obtained after oxidations.
Exposure time (h) 1000°C
1
ΔW: 0.1x10
-3
g
ΔW/A: 0.0031452 mg/cm
2
Area: 31.79364 cm
2
Oxide thickness: 2-3 µm
10
ΔW: 1x10
-3
g
ΔW/A: 0.0312940 mg/cm
2
Area: 31.954915 cm
2
Oxide thickness: 8 µm
50
ΔW: 1.7x10
-3
g
ΔW/A: 0.0531594 mg/cm
2
Area: 31.97982 cm
2
Oxide thickness: 12 µm
100
ΔW: 2.1x10
-3
g
ΔW/A: 0.0656060 mg/cm
2
Area: 32.00923 cm
2
Oxide thickness: 12-13 µm
ΔW: Weight change. A: oxidized area.
more homogeneous in appearance after 100 h.
Oxidation kinetics
After exposure, the weight change of all samples was
determined with 10
-5
sensitivity. The results obtained after
oxidation tests were shown in Table 2. The oxidation
graph (ΔW/A) of sample indicates that samples show a
sub-parabolic oxidation behavior (Figure 2a). It is a
diffusion-controlled oxidation in which weight increases
with increasing the oxidation time (Türker et al., 1995).
This mechanism is typical of non-steady-state diffusion-
controlled reactions.
The ionic diffusion flux is inversely proportional to the
thickness of diffusion barrier, and the change in scale
thickness or weight is likewise proportional to the ionic
diffusion flux (Fontana, 1986). The oxide formed is
assumed to be dense, adherent and non-porous. These
features are preferred for high temperature applications.
In order to evaluate the oxidation behavior of Ni based
ODS superalloy, parabolic rate law is applied to the data
given in Figure 2a. The parabolic rate equation is given
by;
(ΔW/A)
2
kp.t
Where kp denotes the parabolic rate constant, t is time
(h), and ΔW/A is the oxidation rate (mg/cm
2
). Diffusion-
controlled parabolic oxidation kinetics is determined by kp
Erdem and Turker 4125
which is defined as parabolic rate constant. Kp has
parabolic oxidation kinetics. Kp is gained by the ratio of
the square of the increase in weight per unit area of the
sample to the duration of oxidation. Kp indicates that
surface protective oxide layer avoids the reactive
gathering and oxidation rate decrease related with time.
In order to determine the parabolic rate constant, kp, the
graph of (ΔW/A)
2
against exposure time is drawn and the
slope in Figure 2b is obtained.
The working life’s of high temperature materials are
strongly dependent on the rate of oxidation. Hence, the
estimation of long term behavior, which is of great
importance in the practical application of the materials at
elevated temperatures, requires an accurate knowledge
of growth kinetics. The short term oxidation kinetics of
some ferritic superalloys was found to be essentially
parabolic (Ramanarayanan et al., 1988; Nickel and
Quadakkers, 1991; Hendrich, 1988) whereas the long
term oxidation behavior of these alloys is controversial
(Bennett and Houlton, 1990). However, most of the oxide
dispersion strengthened (ODS) alloys exhibit parabolic
oxidation behavior. Since these alloys are designed to be
used at elevated temperature for a long time, sub-
parabolic oxidation behavior is desired compared to
parabolic one.
Rapid oxidation rate accelerates the Cr or Al depletion
of the matrix. When the depletion of protective scale
forming elements such as Cr or Al reaches a critical
value, the materials behave essentially as a chromium
bearing ferritic alloys and subsequent exposure will
produce an external scale of less protective oxide layer or
a spinel (Mikkelsen, 2003; Obigodi-Ndjeng, 2011). This
behavior may then result in breakaway oxidation after a
short time.
In case of slow oxidation rate such as sub-parabolic
oxidation rate, breakaway oxidation or dropping the
oxidation elements to a critical level takes time which
results in longer service life. That is why sub-parabolic
oxidation kinetic is preferred for high temperature
applications (Türker, 1999). Gonzales et al. (1999)
exposed the Ni based ODS alloys between 900 to
1200°C for up to 100 h to determine the oxidation kinetics
and the weight change results has shown that sample
exposed at 900°C exhibited parabolic oxidation kinetics
while the other samples exposed at higher temperature
showed sub-parabolic oxidation behavior. Another work
has been carried out on Ni based superalloys 900 and
1000°C for 5, 10, 50 and 100 h and all samples exhibited
parabolic oxidation kinetic (Evin, 2003).
Other investigators (Suryanarayana et al., 2001) have
studied the effect of surface quality on the oxidation
behavior of MA 956 and found that sample with good
surface quality showed continuous weight gain and
consistent increase in oxide thickness together with
homogeneous oxide film. Furthermore, sample with good
surface quality had parabolic oxidation kinetic whereas
sample with rough surface had sub-parabolic oxidation
4. 4126 Sci. Res. Essays
(a) (b)
0
0.01
0.02
0.03
0.04
0.05
0.06
0.07
0 10 20 30 40 50 60 70 80 90 100 110
ΔW/A
(mg/cm
2
)
Oxidation time (h)
0
0.001
0.002
0.003
0.004
0.005
0 10 20 30 40 50 60 70 80 90 100 110
(ΔW/A)
2
(mg
2
/cm
4
)
Oxidation time (h)
(a) (b)
0
0.01
0.02
0.03
0.04
0.05
0.06
0.07
0 10 20 30 40 50 60 70 80 90 100 110
ΔW/A
(mg/cm
2
)
Oxidation time (h)
0
0.001
0.002
0.003
0.004
0.005
0 10 20 30 40 50 60 70 80 90 100 110
(ΔW/A)
2
(mg
2
/cm
4
)
Oxidation time (h)
a b
Figure 2. (a) Effect of exposure time at 1200o
C on weight change, (b) Weight gain squared against exposure time.
20 30 40 50 60 70 80 90
200
400
600
800
1000
1200
1400
1600
100
50
10
1
Cr
2
O
3
Cr
2
O
3
Cr
2
O
3
Cr
2
O
3
Ni
Ni
Ni
2 Tehetha-scale
E
x
p
o
s
u
r
e
t
i
m
e
s
(
h
)
Lin
(Count)
Figure 3. XRD results of the oxidized samples for various exposure
times.
behavior.
Another work has been carried out on extruded Ni
based IN 718 and exposed to oxidation at 1100°C for up
to 180 h and showed Nb rich Cr2O3 film on the surface.
Oxide thickness and weight gain were detected through
the oxidation process up to 160 h. An increase in micro
hardness has also been detected from surface to the
matrix (Geng et al., 2007). Ni based alloy oxidized at
950°C for 128 h and showed parabolic oxidation behavior
whereas it did not obey the parabolic rate when oxidized
at 1000°C for 140 h (Zhao et al., 2004). In order to
increase the isothermal and cyclic oxidation behavior of
IN 100, Wang et al. (2002) coated the alloy with 10 µm
thick NiCrAlY and heat treated at 950 to 1050°C in a
vacuum atmosphere for 2 h. Isothermal and cyclic
oxidation tests were applied to the coated samples at 900
to 1000°C. During oxidation, all samples exhibited
parabolic oxidation behavior (Wang et al., 2002).
X-ray diffraction (XRD) results
XRD results of the sample are given in Figure 3 after
various oxidation durations (1, 10, 50 and 100 h). As
shown in Figure 3, a small amount of protective oxide
layer of Cr2O3 is formed on the surface after 1 h
exposure. Cr2O3 generally grows on the surface of Ni
based super alloys. The intensity of the Cr2O3 peak
increased with increasing the oxidation duration (10 h).
Increasing the oxidation duration to 50 h resulted in
thicker oxide film causing a more intensive peak
formation. The intensity of the Cr2O3 XRD peaks
increased with increasing the oxidation duration (100 h),
indicating the gradual increasing of thickness of oxide
layer.
Evin (2003) has studied the oxidation behavior of Ni
based superalloy at 900 and 1000°C in pure oxygen for
5, 10, 50, 100 h and detected some NiCrO3 and NiCrO4
on the outer surface of the samples. Similar studies have
been carried out for Inconel 740 at 950°C for 128 h and
1000°C for 140 h and some oxide layers of Cr2O3, (NiCo)
Cr2O4 and TiO2 α-Al2O3 (Zhao et al., 2004) were found.
Wand et al. (2002) studied the oxidation behavior of
NiCrAlY coated Ni based IN100 at 900°C and found
some protective α-Al2O3 and Cr2O3 film on the surface.
5. Erdem and Turker 4127
(a) (b)
(c) (d)
Ni coating
Ni coating
Ni coating
Oxide
Matrix
Oxide
Oxide
Oxide
Matrix
Matrix
Matrix
Figure 4. SEM micrographs of oxidized and polished surfaces: (a) 1, (b) 10, (c) 50 and (d) 100 h.
SEM analysis
Polished surface
SEM images of the polished section are seen in Figure
4a to d. Sample exposed for 1 h shows an oxide layer
with the thickness of 3 µm although some 1 to 2 µm thick
areas are also visible. The results indicate that in the
early stage of oxidation, homogeneous oxide film does
not form on the sample which is also non-protective. SEM
investigation shows (Figure 1a) some local oxide
formation on the surface. Figure 4b shows SEM
micrographs of polished section of the sample with about
8 µm oxide layer covering almost the entire surface after
exposure for 10 h.
The results in the foregoing indicate that even though
the thickness of oxide layer is enough for the protection
of the materials, the density is not enough. Figure 4c
shows the SEM micrograph of the surface oxide layer
after exposure for 50 h. The thickness of oxide is about
12 µm which is compact and cover the surface uniformly.
It indicates that the density and thickness of oxide
increase with increasing the exposure time. Figure 4d
shows the SEM image of the oxide layer after exposure
for 100 h. These results indicate that the thickness of the
oxide layer of the samples exposed for 50 and 100 h is
almost the same. The thickness of the oxide layer is
about 12 to 13 µm after 100 h, but it is more compact and
adherent than 50 h exposed sample. The dense oxide
layer positively affects the weight gain. Furthermore, this
oxide layer was found to be bonded to the matrix via
longitudinal keys. It is suggested that numerous oxide
protrusions form mainly around the rare-earth containing
second phase particles in the alloy at the oxide scale
interface, and they are instrumental in pinning the oxide
scale to the underlying metal (Stott et al., 1979). This
results in the strengthening of the metal-oxide interface
and increasing of the life time of the materials.
In order to determine the oxidation kinetics of Ni based
superalloys, Evin (2003) exposed samples in pure
oxygen at 900 and 1000°C for up to 100 h and oxide
layer thickness (0.4 to 52.7 µm) was found to be
dependent on the oxidation durations and oxidation
temperature. Another study was carried out on Inconel
740 at 950 and 1000°C for 128 to 140 h and the
thickness of the upper and lower surface of the material
6. 4128 Sci. Res. Essays
(a) (b)
(c) (d)
Figure 5. SEM images of the fracture surface for various exposure times: (a) 1, (b) 10, (c) 50 and (d) 100 h.
was found to be different (Geng et al., 2007).
Fracture surface
SEM micrographs of the fractured surface are seen in
Figure 5a to d. Sample exposed for 1 h shows very fine
surface oxide layer, laying on the edge of the materials
(Figure 5a). On the contrary to matrix materials, which
contain some dimples, the oxide layer exhibits smooth,
sharp and brittle fracture. Increasing the exposure time to
10, 50 and 100 h, the thickness of surface oxide
increased. Fractured surface clearly indicates that longer
exposure time results in more dense, smoother surface
with sharp edges on the oxide film that indicates brittle
fracture mode (Figure 5b, c and d).
Conclusions
Ni based superalloy was produced by MA techniques and
oxidized at 1000°C for up to 100 h and the following
results were obtained:
1. The thickness of the oxide film formed on the surface
of metal increased with increasing the exposure time and
showed good homogeneity and adherence with the
underlying matrix material.
2. In this experimental work, all samples showed sub-
parabolic oxidation behavior. These types of oxides are
preferred for high temperature applications.
3. XRD results indicate that all samples showed Cr2O3
film on the surface after exposure for 1, 10, 50 and 100 h,
and the intensity of chromium peak increased with
increasing the exposure time.
ACKNOWLEDGEMENT
This research is financially supported by Turkish State
Planning Organization under contract 2003 K 120470-11.
7. REFERENCES
Barnard BR, Liaw PK, Buchanan RA, Klarstrom DL (2010). Affects of
applied stresses on the isothermal and cyclic high-temperature
oxidation behavior of superalloys. Mater. Sci. Eng. A. 527:3813-3821.
Bennett MJ, Houlton MR (1990). High Temperature Materials for Power
Engineering. Part 1:227.
Cama H (1994). The effect of high temperature exposure on the second
phase particle populations in MA’ed Ferritic ODS alloys. Ph.D Thesis.
The University of Leeds School of Materials, UK.
Dreshfield RH, Gray HR (1984). P/M Superalloys, A Troubled
Adolescent Proceedings Seminar on P/M Superalloys. Current and
Future. International Powder Metallurgy Conference Toronto,
Canada. pp. 1-20.
Evin E (2003). Production of a Ni based superalloy by MA techniques
and investigation of its microstructure and oxidation behavior. PhD
thesis. Fırat University, Institute of Science, Elazığ-Turkey. pp. 1-142.
(In Turkish).
Fontana MG (1986). Corrosion Engineering. Third Edition, Mc Graw-Hill
Int. Edition.
Geng L, Na YS, Park NK (2007). Oxidation behavior of alloys 718 at
high temperature. Mater. Des. 28:978-981.
Gonzales-Carrosso JL, Perez P, Adeva P, Chao J (1999). Oxidation
behaviour of an ODS NiAl-based intermetallic alloy. Intermetallics
7:69-78.
Hendrich HD (1988). Proceedings on Conference on New Materials by
MA Techniques. Ed. Artz E and Schultz L Calw-Hirasu. p. 217.
Immarigeon JP (1981). The superalloys, Materials for gas turbine hot
section components. Can. Aeronaut. Space J. 27(4):336-350.
Jedlinski J (1989). The influence active elements on the stress
relaxation in the scale and substrate of alumina forming alloys. Proc.
Conf. on the role of active elements in oxidation behavior of high
temperature metals and alloys, ed by E. Lang, Elsevier Appl. Sci. p.
131.
Mikkelsen L (2003). High Temperature Oxidation of Iron-Chromium
Alloys. PhD thesis. Risø National Laboratory Roskilde-Denmark. pp.
1-170.
Erdem and Turker 4129
Nickel H, Quadakkers WJ (Sept.1991). Proceedings on Conference on
Heat Resistance Materials. Fontana, Wisconsin, USA. 87:23-26.
Obigodi-Ndjeng G (2011). High temperature oxidation and
electrochemical investigations on nickel-base alloys. Nürnberg Univ.
pp.1-172.
Ramanarayanan TA, Ayer R, Petrovic-Luton R, Leta DP (1988). The
Influence of Yttrium on Oxide Scale Growth and Adherence. Oxid.
Met.29: 445-472.
Stott FH, Wood GC, Golightly FA (1979). Wood The influence of
thermal cycling on the oxidation behaviour of Fe-Cr-Al and Fe-Cr-Al-
Y alloys at 1200°C. 19(11):889–906.
Suryanarayana C, Ivanov E, Boldyrev VV (2001). The science and
technology of mechanical alloying. Mater. Sci. Eng. A. 304:151-158.
Türker M, Cama H, Hughes TA (1995). The Performance of Ferritic
ODS Alloys at High Temperature in Nitrogen Containing
Environments. Corr. Sci. 37(3):413-428.
Türker M (1999). The long-term oxidation behavior of ferritic ODS alloy
at 1100-1200 in air and nitrogen-2% oxygen. Corr. Sci. 41:1921-
1935.
Wang B, Gong J, Wang AY, Sun C, Huang RF, Wen LS (2002).
Oxidation behavior of NiCrAlY coatings on Ni-based superalloy. Surf.
Coat. Technol. 149:70-75.
Whitehouse AF, Winand HMA, Clyne TW, (1998). The effect of
processing route and reinforcement geometry on isothermal creep
behavior of particulate and short fiber. MMCs. 242(1–2):57–69.
Wright IG, Wilcox BA (1974). Observation on strengthened and
oxidation behavior of a dispersion hardened Fe-Cr based alloys
prepared by mechanical alloying. Met. Trans. 5:957.
Zhao S, Xie X, Smith G D (2004). The oxidation behavior of the new
nickel-based superalloy Inconel 740 with and without Na2SO4 deposit.
Surf. Coat. Technol. 185:178-183.