(Best) ENJOY Call Girls in Faridabad Ex | 8377087607
Keynote technicals daily report for 130112
1. Daily Technical Outlook
13th January 2012
Indices * Close % Chg.
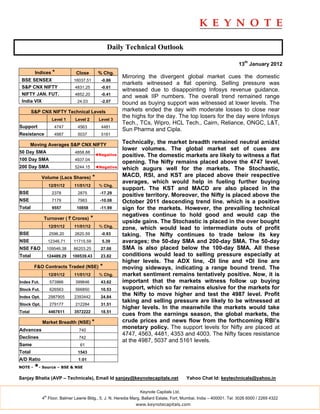
Mirroring the divergent global market cues the domestic
BSE SENSEX 16037.51 -0.86
markets witnessed a flat opening. Selling pressure was
S&P CNX NIFTY 4831.25 -0.61
witnessed due to disappointing Infosys revenue guidance.
NIFTY JAN. FUT. 4852.20 -0.41
and weak IIP numbers. The overall trend remained range
India VIX 24.03 -2.07 bound as buying support was witnessed at lower levels. The
S&P CNX NIFTY Technical Levels markets ended the day with moderate losses to close near
the highs for the day. The top losers for the day were Infosys
Level 1 Level 2 Level 3
Tech., TCs, Wipro, HCL Tech., Cairn, Reliance, ONGC, L&T,
Support 4747 4563 4481
Sun Pharma and Cipla.
Resistance 4987 5037 5161
Moving Averages S&P CNX NIFTY
Technically, the market breadth remained neutral amidst
lower volumes. The global market set of cues are
50 Day SMA 4858.88
◄Negative positive. The domestic markets are likely to witness a flat
100 Day SMA 4937.04
opening. The Nifty remains placed above the 4747 level,
200 Day SMA 5244.15 ◄Negative which augurs well for the markets. The Stochastic,
Volume (Lacs Shares) * MACD, RSI, and KST are placed above their respective
averages, which would help in fueling further buying
12/01/12 11/01/12 % Chg.
support. The KST and MACD are also placed in the
BSE 2378 2875 -17.29
positive territory. Moreover, the Nifty is placed above the
NSE 7179 7983 -10.08 October 2011 descending trend line. which is a positive
Total 9557 10858 -11.99 sign for the markets. However, the prevailing technical
negatives continue to hold good and would cap the
Turnover ( ` Crores) *
upside gains. The Stochastic is placed in the over bought
12/01/12 11/01/12 % Chg. zone, which would lead to intermediate outs of profit
BSE 2596.20 2620.59 -0.93 taking. The Nifty continues to trade below its key
NSE 12346.71 11715.59 5.39 averages; the 50-day SMA and 200-day SMA. The 50-day
NSE F&O 109546.38 86203.25 27.08 SMA is also placed below the 100-day SMA. All these
Total 124489.29 100539.43 23.82 conditions would lead to selling pressure especially at
higher levels. The ADX line, -DI line and +DI line are
F&O Contracts Traded (NSE) * moving sideways, indicating a range bound trend. The
12/01/12 11/01/12 % Chg. market sentiment remains tentatively positive. Now, it is
Index Fut. 573966 399646 43.62 important that the markets witness follow up buying
Stock Fut. 626563 566850 10.53 support, which so far remains elusive for the markets for
Index Opt. 2987905 2393442 24.84
the Nifty to move higher and test the 4987 level. Profit
taking and selling pressure are likely to be witnessed at
Stock Opt. 279177 212284 31.51
higher levels. In the meanwhile the markets would take
Total 4467611 3572222 18.51
cues from the earnings season, the global markets, the
Market Breadth (NSE) * crude prices and news flow from the forthcoming RBI’s
Advances 740
monetary policy. The support levels for Nifty are placed at
4747, 4563, 4481, 4353 and 4003. The Nifty faces resistance
Declines 742
at the 4987, 5037 and 5161 levels.
Same 61
Total 1543
A/D Ratio 1:01
NOTE - *- Source – BSE & NSE
Sanjay Bhatia (AVP – Technicals), Email Id sanjay@keynotecapitals.net Yahoo Chat Id: keytechnicals@yahoo.in
Keynote Capitals Ltd.
th
4 Floor, Balmer Lawrie Bldg., 5, J. N. Heredia Marg, Ballard Estate, Fort, Mumbai, India – 400001. Tel: 3026 6000 / 2269 4322
www.keynotecapitals.com
2. Short Term Trading Ideas Based On Technical Analysis (5 - 7 Days)
Stop
Initiation Stop Loss Target
Stock Close Action Price Loss * (%) Target (%) Remarks
TGT of 666
Achieved
given Buy @
620 on
ABB 682.50 Buy Above 686 670.50 2.26 720 4.96 11/01/12
TGT of 964
Achieved
given Buy @
898 on
Axis Bank 941.65 Buy Above 945 927.00 1.90 985 4.23 11/01/12
Sesa Goa 185.85 Buy Above 188 184.00 1.87 197 5.07
* Stop Losses are to be considered strictly on Closing basis.
Intra-day Resistance Intra-day Support
Indices Close Pivot Point R1 R2 R3 S1 S2 S3
BSE SENSEX 16038 16060 16157 16276 16492 15941 15844 15628
S&P CNX NIFTY 4831 4835 4866 4900 4965 4800 4769 4704
NIFTY JAN. FUT. 4852 4853 4887 4923 4992 4818 4783 4713
Keynote Capitals Ltd.
th
4 Floor, Balmer Lawrie Bldg., 5, J. N. Heredia Marg, Ballard Estate, Fort, Mumbai, India – 400001. Tel: 3026 6000 / 2269 4322
www.keynotecapitals.com
3. Disclaimer
This document is not for public distribution and has been furnished to you solely for your information and must not be
reproduced or redistributed to any other person. Persons into whose possession this document may come are
required to observe these restrictions.
This material is for the personal information of the authorized recipient, and we are not soliciting any action based
upon it. This report is not to be construed as an offer to sell or the solicitation of an offer to buy any security in any
jurisdiction where such an offer or solicitation would be illegal. It is for the general information of clients of Keynote
Capitals Ltd. It does not constitute a personal recommendation or take into account the particular investment
objectives, financial situations, or needs of individual clients.
We have reviewed the report, and in so far as it includes current or historical information, it is believed to be reliable
though its accuracy or completeness cannot be guaranteed. Neither Keynote Capitals Ltd., nor any person connected
with it, accepts any liability arising from the use of this document. The recipients of this material should rely on their
own investigations and take their own professional advice. Price and value of the investments referred to in this
material may go up or down. Past performance is not a guide for future performance. Certain transactions -including
those involving futures, options and other derivatives as well as non-investment grade securities - involve substantial
risk and are not suitable for all investors. Reports based on technical analysis centers on studying charts of a stock’s
price movement and trading volume, as opposed to focusing on a company’s fundamentals and as such, may not
match with a report on a company’s fundamentals.
Opinions expressed are our current opinions as of the date appearing on this material only. While we endeavor to
update on a reasonable basis the information discussed in this material, there may be regulatory, compliance, or
other reasons that prevent us from doing so. Prospective investors and others are cautioned that any forward-looking
statements are not predictions and may be subject to change without notice. Our proprietary trading and investment
businesses may make investment decisions that are inconsistent with the recommendations expressed herein.
We and our affiliates, officers, directors, and employees world wide may: (a) from time to time, have long or short
positions in, and buy or sell the securities thereof, of company (ies) mentioned herein or (b) be engaged in any other
transaction involving such securities and earn brokerage or other compensation or act as a market maker in the
financial instruments of the company (ies) discussed herein or act as advisor or lender / borrower to such company
(ies) or have other potential conflict of interest with respect to any recommendation and related information and
opinions.
The analyst for this report certifies that all of the views expressed in this report accurately reflect his or her personal
views about the subject company or companies and its or their securities, and no part of his or her compensation
was, is or will be, directly or indirectly related to specific recommendations or views expressed in this report.
No part of this material may be duplicated in any form and/or redistributed without Keynote Capitals Ltd’s., prior
written consent.
Keynote Capitals Ltd.
th
4 Floor, Balmer Lawrie Bldg., 5, J. N. Heredia Marg, Ballard Estate, Fort, Mumbai, India – 400001. Tel: 3026 6000 / 2269 4322
www.keynotecapitals.com