Process Capability shift over time
•
5 gefällt mir•3,612 views

1) The document discusses process capability and sigma metrics, which are used to measure process performance and defect rates. It provides examples of how defect rates decrease significantly as sigma levels increase from 1 to 6. 2) It explains key process capability ratios like Cp, Cpk, and how they are calculated. Cp measures how close the process is to the specification limits, while Cpk also considers whether the process is centered between the limits. 3) The document provides examples of how a process shift can decrease Cpk and increase defect rates, even if the process remains within specifications. Maintaining low variation and centering are important to minimize defects.

Empfohlen
Weitere ähnliche Inhalte
Was ist angesagt?
Was ist angesagt? (20)
Andere mochten auch
Andere mochten auch (18)
Ähnlich wie Process Capability shift over time
Ähnlich wie Process Capability shift over time (20)
Mehr von Julian Kalac P.Eng
Mehr von Julian Kalac P.Eng (20)
Kürzlich hochgeladen
Kürzlich hochgeladen (20)
Process Capability shift over time
- 1. Process Capability Julian Kalac, P.Eng Lean Six Sigma Master Black Belt
- 2. 2 Normal Distribution -6s -5s -4s -3s -2s -1s 0 1s 2s 3s 4s 5s 6s One Standard Deviation (s) This is a Normal distribution where: Mean = 0 Standard Deviation = 1
- 4. Process Capability & “Sigma” Cp Sigma* Defect Rate 0.67 ± 2σ 31% 1.0 ± 3σ 6.7% 1.33 ± 4σ 0.6% 1.66 ± 5σ 0.02% 2.0 ± 6σ 0.003%
- 5. Sigma vs. Defect Rate • 1 sigma – 690,000 DPMO – 31% • 2 sigma – 308,537 DPMO – 69.14% • 3 sigma – 66807 DPMO – 93.32% • 4 sigma – 6210 DPMO – 99.38% • 5 sigma – 233 DPMO – 99.97% • 6 sigma – 3.4 DPMO – 99.99% When is good is good enough? 6.7% rejects 69% rejects 31% rejects
- 6. 6 Cp USLLSL Voice of the Customer Voice of The Process Voice of the Customer Voice of the Process Capability Ratio - compares the capability of a process (voice of the process) to the specification limits (voice of the customer): = USL - LSL 6s = Cp Cp = 1: The process is barely capable (Just fits into the tolerance window). Cp = 2: The process is a six sigma process (The tolerance window is twice the process capability).
- 7. 7 C Min( X-LSL 3 USL-X 3 pk = s s , ) C X-LSL 3 pL = s USL-X 3s CpU = Cpk accounts for process centering and spread. Process Capability Ratios
- 8. 8 Cp & Cpk for an Off-Center Process Cp= 1.3 Cpk = 1.3 Cp= 1.3 Cpk = 0.8 Cp= 1.3 Cpk = 0.0
- 9. Process Capability & “Sigma” & Defect Per Mil Cp Sigma* Defect/Mil 0.67 ± 2σ 308,537 1.0 ± 3σ 66807 1.33 ± 4σ 6210 1.66 ± 5σ 233 2.0 ± 6σ 3.4
- 10. 10 Cpk 4.5 3.0 2.0 1.67 1.33 1.0 0.9 0.8 0.67 0.5 TARGET USL UCLLCL LSL Z (Sigma) Value 6.0 5.0 4.0 3.0 2.0 PPM <<1 PPBillion .0018 < 1 230 2,700 6,210 16,400 66,800 308,000 3.4 PPM Yield ST 99.99966 % 99.977% 99. 379% ≈ 99% ≈ 95 % Process Variation Shifts over time What are some of the ways that we can easily indicate the dispersion (spread) characteristic of the population? Three measures that have historically been used: range, variance and standard deviation
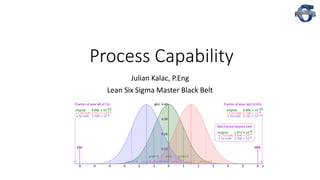
- 11. -6s -5s -4s -3s -2s -1s 0 1s 2s 3s 4s 5s 6s Process Capability Cpk=2 Process Shift Cpk= 1.33 after 1.5s Process shift USLLSL LCL UCLCpk = 2 before 1.5Ϭ shift Cpk = 1.33 after 1.5Ϭ shift, within spec
- 12. -6s -5s -4s -3s -2s -1s 0 1s 2s 3s 4s 5s 6s Process Capability Cpk =1 6.7% Out of Spec Process Shift 1.5 Out of spec= 52% Control LimitsCpk= 1 -> 3s Process LSL USL LCL UCL
- 13. -6s -5s -4s -3s -2s -1s 0 1s 2s 3s 4s 5s 6s Process Capability Cpk =2—38% Out of Spec Control LimitsCpk= 0.67 -> 2s Process LSL USL LCL UCL
- 14. 14 Accuracy and Precision Accurate but not precise - On average, the shots are in the center of the target but there is a lot of variability Precise but not accurate - The average is not on the center, but the variability is small Source: iSixSigma
- 15. Variation and Mean Shift LSL USL LSL USL LSL USL Off-Target, Low Variation High Potential Defects Good Cp but Bad Cpk On Target High Variation High Potential Defects No so good Cp and Cpk On-Target, Low Variation Low Potential Defects Good Cp and Cpk Variation reduction and process centering create processes with less potential for defects. The concept of defect reduction applies to ALL processes (not just manufacturing)