1. GETTING STARTED USING MARKETING METRICS
White Paper
by
Dr. Roger J. Best
The cockpit of the 757 Boeing jet is a maze of instruments (analytic tools) that produce flight
performance data (metrics) that are critical to the safe and efficient flight of a 757. It would be
impossible to fly a 757 without theses analytic instruments and performance metrics. Yet,
companies invest millions or billions in marketing and sales strategies with no clear measure of
their performance impact or efficiency.
Most companies recognize the need for marketing metrics and the potential benefit they provide, but
they struggle where to get started. A 2010 survey of 400 companies found that 75 percent recognized the
need for marketing metrics, but only 25 percent had implemented a marketing metrics program (1). We
will address the barriers companies and managers must overcome in order to successfully apply
marketing metrics across their organizations. Before we address these barriers to getting started, let’s
first understand the need for marketing metrics and how they can be used to measure and manage
marketing performance.
THE NEED AND IMPORTANCE OF MARKETING METRICS
Marketing has a responsibility to account for
investments in marketing and sales strategies.
We have found approximately 75 percent of a
company’s Sales, General & Administration (SGA)
expense is invested in marketing and sales. For
many companies this can be 15 to 25 percent of
sales. Yet, marketing generally lacks the
performance metrics to demonstrate the results
produced.
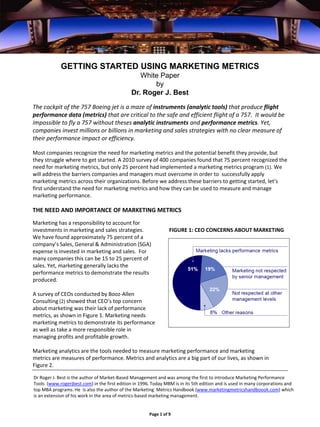
A survey of CEOs conducted by Booz‐Allen
Consulting (2) showed that CEO’s top concern
about marketing was their lack of performance
metrics, as shown in Figure 1. Marketing needs
marketing metrics to demonstrate its performance
as well as take a more responsible role in
managing profits and profitable growth.
Marketing analytics are the tools needed to measure marketing performance and marketing
metrics are measures of performance. Metrics and analytics are a big part of our lives, as shown in
Figure 2.
FIGURE 1: CEO CONCERNS ABOUT MARKETING
Page 1 of 9
Dr Roger J. Best is the author of Market‐Based Management and was among the first to introduce Marketing Performance
Tools (www.rogerjbest.com) in the first edition in 1996. Today MBM is in its 5th edition and is used in many corporations and
top MBA programs. He is also the author of the Marketing Metrics Handbook (www.marketingmetricshandboook.com) which
is an extension of his work in the area of metrics‐based marketing management.
6. FIGURE 7: APPLE NET MARKETING CONTRIBUTION VS. OPERATING INCOME
Marketing & Sales expenses should include all
marketing, advertising, sales, service and
support, as well as product management
expenses associated with the marketing and
sales of company products.
It should not include general administration
expenses, R&D expenses or other expenses
unrelated to the marketing & sales of company
products.
Company SGA (% Sales) M&SE (% Sales) M&SE (% SGA)
Adobe Systems 39.9% 31.1% 78%
Campbell's Soup 22.1% 14.5% 66%
Cisco Systems 27.3% 21.2% 78%
Microsoft 29.5% 22.5% 76%
Oracle 23.0% 19.0% 83%
Average 28.4% 21.7% 76.0%
FIGURE 8: MARKETING & SALES EXPENSES
Page 6 of 9
Apple 1999‐2009
Apple’s net marketing contribution had a high correlation (.94) with operating income from 1999 to 2009.
Apple’s net profit was also influenced by its net marketing contribution:
Net = Net Marketing ‐ General ‐ Other ‐ Interest
Profit Contribution Expenses Expenses & Taxes
= $10 billion ‐ $1.0 billion ‐ $1.2 billion ‐ $2.0 billion
= $5.7 billion
Marketing & Sales Expenses
Marketing and sales expenses are an investment in product‐market strategies and include many non‐
marketing expenses such as product management, customer service, sales and sales management. If a
business exits a product‐market, these expenses will disappear since they are expenses incurred given the
collective efforts to serve a particular product‐market.
One challenge you will likely encounter is in determining the actual marketing and sales expenses. Most
companies do not report marketing and sales expenses separately, as they are wrapped into Sales, General
& Administration (SGA) expenses. If you do not have this data, 75 percent of SGA is a good place to start.
This estimate is based on a sample of companies that report marketing and sales and general
administration expenses separately. One of the most compelling benefits of this marketing profitability
metric is that it affords additional visibility to the return on marketing investments to those in non‐
marketing roles.