Granville County myFutureNC county profile
•
0 gefällt mir•619 views

myFutureNC county data profile.

Empfohlen
Empfohlen
Weitere ähnliche Inhalte
Was ist angesagt?
Ähnlich wie Granville County myFutureNC county profile
Ähnlich wie Granville County myFutureNC county profile (20)
Kürzlich hochgeladen
Kürzlich hochgeladen (20)
Granville County myFutureNC county profile
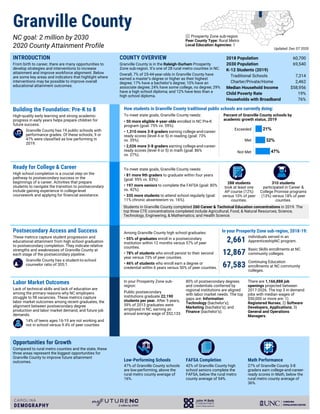
- 1. Granville County NC goal: 2 million by 2030 2020 County Attainment Profile INTRODUCTION From birth to career, there are many opportunities to develop strategies and interventions to increase attainment and improve workforce alignment. Below are some key areas and indicators that highlight where interventions may be possible to improve overall educational attainment outcomes. COUNTY OVERVIEW Granville County is in the Raleigh-Durham Prosperity Zone sub-region. It’s one of 28 rural metro counties in NC. Overall, 7% of 25-44-year-olds in Granville County have earned a master’s degree or higher as their highest degree; 17% have a bachelor’s degree; 10% have an associate degree; 24% have some college, no degree; 29% have a high school diploma; and 12% have less than a high school diploma. 2018 Population 2030 Population K-12 Students (2019) Traditional Schools Charter/Private/Home Median Household Income Child Poverty Rate Households with Broadband 60,700 69,540 7,314 2,462 $58,956 19% 76% Building the Foundation: Pre-K to 8 High-quality early learning and strong academic progress in early years helps prepare children for future success. Granville County has 19 public schools with performance grades. Of these schools, 9 or 47% were classified as low performing in 2019. How students in Granville County traditional public schools are currently doing: To meet state goals, Granville County needs: • 50 more eligible 4-year-olds enrolled in NC Pre-K program (goal: 75% vs. 59%). • 1,310 more 3-8 graders earning college-and-career- ready scores (level 4 or 5) in reading (goal: 73% vs. 35%). • 2,026 more 3-8 graders earning college-and-career- ready scores (level 4 or 5) in math (goal: 86% vs. 27%). Exceeded Met Not Met Percent of Granville County schools by academic growth status, 2019 Ready for College & Career High school completion is a crucial step on the pathway to postsecondary success or the beginnings of a career. Activities that prepare students to navigate the transition to postsecondary include gaining experience in college-level coursework and applying for financial assistance. To meet state goals, Granville County needs: • 81 more 9th graders to graduate within four years (goal: 95% vs. 83%). • 197 more seniors to complete the FAFSA (goal: 80% vs. 42%). • 335 more students to attend school regularly (goal: 11% chronic absenteeism vs. 16%). 288 students took at least one AP course (12%) versus 10% of peer counties. 310 students participated in Career & College Promise programs (13%) versus 18% of peer counties. Students in Granville County completed 260 Career & Technical Education concentrations in 2019. The top three CTE concentrations completed include Agricultural, Food, & Natural Resources; Science, Technology, Engineering, & Mathematics; and Health Science. Postsecondary Access and Success These metrics capture student progression and educational attainment from high school graduation to postsecondary completion. They indicate relative strengths and weaknesses of Granville County at each stage of the postsecondary pipeline. Granville County has a student-to-school counselor ratio of 305:1. Among Granville County high school graduates: • 55% of graduates enroll in a postsecondary institution within 12 months versus 57% of peer counties. • 78% of students who enroll persist to their second year versus 73% of peer counties. • 46% of students who enroll earn a degree or credential within 6 years versus 50% of peer counties. 2,661 individuals served in an ApprenticeshipNC program. 12,867 Basic Skills enrollments at NC community colleges. 67,583 Continuing Education enrollments at NC community colleges. In your Prosperity Zone sub-region, 2018-19: Labor Market Outcomes Lack of technical skills and lack of education are among the primary reasons why NC employers struggle to fill vacancies. These metrics capture labor market outcomes among recent graduates, the alignment between postsecondary degree production and labor market demand, and future job demands. 14% of teens ages 16-19 are not working and not in school versus 9.4% of peer counties. In your Prosperity Zone sub- region: Public postsecondary institutions graduate 22,190 students per year. After 5 years, 59% of 2013 graduates were employed in NC, earning an annual average wage of $52,133. 80% of postsecondary degrees and credentials conferred by regional institutions are aligned with labor market needs. The top gaps are: Information Technology (bachelor’s); Marketing (bachelor’s); and Finance (bachelor’s). There are 1,166,888 job openings projected between 2017-2026. The top 3 in demand jobs with median wages of $50,000 or more are: 1) Registered Nurses; 2) Software Developers, Applications; 3) General and Operations Managers. Opportunities for Growth Compared to rural metro counties and the state, these three areas represent the biggest opportunities for Granville County to improve future attainment outcomes. Low-Performing Schools 47% of Granville County schools are low-performing, above the rural metro county average of 16%. FAFSA Completion 42% of Granville County high school seniors complete the FAFSA, below the rural metro county average of 54%. Math Performance 27% of Granville County 3-8 graders earn college-and-career- ready scores in Math, below the rural metro county average of 36%. Updated: Dec 07 2020 Prosperity Zone sub-region Peer County Type: Rural Metro Local Education Agencies: 1
- 2. Updated: Dec 07 2020 Institution Name Undergraduate Enrollments 2017-18 Graduate or Transfer in 8 Years Total Enrollments 139,487 73% Located within the Carolina Population Center at UNC-Chapel Hill, we use data and other available research to help you put a face or a story on the population-level changes facing your community. Our analysts provide a full array of demographic data and research services to inform decision making, evaluation, and policy across North Carolina, where we serve organizations and people in all 100 counties. ncdemography.org demography@unc.edu @ncdemography ABOUT CAROLINA DEMOGRAPHY MyFutureNC is a statewide nonprofit organization focused on educational attainment and is the result of cross-sector collaboration between North Carolina leaders in education, business, and government. Our mission is to prepare North Carolina for the future by empowering individuals, strengthening communities, and ensuring our economic viability in a global economy. myfuturenc.org facebook.com/myfuturenc @myFutureNC ABOUT MYFUTURENC Granville County 2020 Attainment Profile Largest postsecondary institutions in your Prosperity Zone sub-region Wake Technical Community College 29,480 56% North Carolina State University at Raleigh 27,424 93% University of North Carolina at Chapel Hill 19,773 96% Durham Technical Community College 8,049 58% Duke University 7,504 95% North Carolina Central University 7,165 80% Strayer University-North Carolina 6,998 53% Central Carolina Community College 6,811 58% Johnston Community College 5,343 55% Campbell University 5,183 89% Vance-Granville Community College 4,014 60% Meredith College 1,900 92% Notes: Enrollments reflect degree- or credential-seeking undergraduate enrollments. The graduate or transfer rate is drawn from IPEDS and represents the share of students who either graduate with a degree or credential from the institution or transfer to another institution within 8 years. The 8- year outcome is the only measure that includes information on transfer out. Detailed data guidance is provided at http://go.unc.edu/countydata Local Cross-Sector Promising Practice: Vance-Granville CC Career Coach Vance-Granville Community College recently introduced a new web-based service that will help students explore careers and make plans for their future. Students can about various VGCC education and training programs that lead to the careers they want. We identified this example of an emerging cross-sector promising practice in partnership with local leaders. If you have additional examples you’d like to share with myFutureNC, please respond to this short survey. For more information about each indicator, including data sources and methodology, visit: dashboard.myfuturenc.org/county-data-and-resources/