1. GEOPHYSICAL ANALYSIS OF MIO-PLIOCENE MANGAA FORMATION FOR BETTER
EXPLORATION WITHIN THE PARAHAKI 3D SURVEY; TARANAKI BASIN, OFFSHORE
NEW ZEALAND
Jade Bujardand Rui Zhang
University of Louisiana at Lafayette
Query
The Taranaki Basin is the only
known producing basin within and
around New Zealand with
numerous oil and gas fields. Since
the drilling of the first well in 1865,
the Taranaki basin has remain
relatively underexplored. The
Arawa-1 well was drilled in 1992
used 2D seismic lines. Since the
initial drilling, New Zealand has
started an exploration initiative by
publicly releasing all geological and
geophysical information gathered
on and offshore New Zealand. This
includes the Parihaka 3D survey
which directly overlies the Arawa-1
well and original 2D lines. This
poses the question, with the newly
acquired 3D survey and with
geological information gathered
from the Arawa-1 well, can a set of
geophysical tools now be used to
better locate signatures of
hydrocarbon bearing reservoirs
within the Parihaka 3D survey.
Methods
A 3D seismic volume was
investigated using geophysical tools
in order to locate an area of interest
for hydrocarbon exploration.
Interpreter found high amplitude
teardrop events conforming to
structure. An extrapolation from a
near by well was used to identify a
stratigraphic level of interest. A
coherency volume was created to
investigate stratigraphic features in
an interval zone. A teardrop
stratigraphic feature was found in
time slice (Figure 2) and further
investigated. Average energy
volume was created to differentiate
this high amplitude event from the
background amplitudes (Figure 5).
Afterwards an amplitude extraction
was made off of the mapped horizon
(Figure 3). This was overlaid with
structural contours for an idea of
structural conformance. A model
well was created for a fluid
substitution modeling (Figure 6).
After creating a model with 100%
gas , an amplitude versus offset
model was made off of this model
well. Both the modeled gas
synthetic and the original water
saturation synthetic was compared
to each other. Additionally these
offsets were then compared with the
potential reservoir inside and
outside of the amplitude anomaly
(Figure 8;9).
Conclusion
With the use of the coherence volume,
geomorphological features of interest can easily be
pinpoint. These features can be compared with
depositional environments from available well
logging data. Within the Mangaa formation these
features resemble those of potential reservoirs.
Potential reservoirs can be compared to paleo-
depositional maps for further evidence of potential
reservoirs. AVO analysis within the reservoir
resembles that of a class 4 anomaly. The model of the
modeled gas well resemble the same class 4 AVO
anomaly as that of the inside of the potential
reservoir. The anomaly outside of the reservoir
resembles closely to the original 100% water
saturation synthetic. In conclusion, geophysical tools
from the workflow described can be used to pinpoint
potential areas of interest with a high probability of
hydrocarbon signatures.
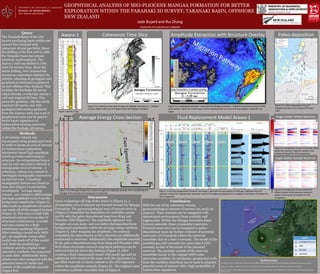
Discussion
Upon evaluating well logs of the Arawa-1 (Figure 1), a
stratigraphic area of interest was focused around the Mangaa
Formation. The geomorphological area of interest circle in
(Figure 2) resembled the deposition of a turbidite system
and fit with the paleo-depositional map from King and
Thrasher 1996 (Figure 4). The amplitude signature was
brought out even more, and was better distinguished from
background amplitudes within the average energy attribute
(Figure 5). After mapping the amplitude, the anomaly
resembled the same feature as the coherence an additionally
conformed to structure. Additionally this amplitude anomaly
fit the paleo-depositional map from King and Thrasher 1996.
With these structural contours migration pathways can be
inferred from the down-dip faulting (Figure 3). After
creating a fluid replacement model with purely gas and an
additional AVO model of the same well, the signature of a
gas filled reservoir is closely related to the AVO signature
within the amplitude anomaly (Figure 8). The original water
saturation synthetic resembles that of Figure 9.
References
Arco Petroleum NZ Inc., 1992; Arawa-1 Final well report PPL38436, Ministry of Economic Development New Zealand, Unpublished Petroleum Report PR1824.
Higgs, K.E., D. Strogen, A. Griffin, B. Ilg, M. Arnot, 2012, Reservoirs of the Taranaki Basin, New Zealnd. GNS Science Data Series No. 2012/13a
King, P.R., and G.P. Thrasher, 1996, Cretaceous-Cenozoic geology and petroleum systems of the Taranaki Basin, New Zealand, Institute of Geological and Nuclear
Sciences, vol. 13.
Angle Gather Within Reservoir
Angle Gather Outside Reservoir
Figure 1 Awara-1 Logs
Figure 2 is a coherence time slice through the Mangaa Formation at ~ 1.605sec.
Circle in yellow is the area of interest within the Mangaa Formation.
Figure 3 Is an amplitude extraction map within the Mangaa Formation. Overlaid is structural contours of the
same horizon. Notice the conformance of the amplitude with structure and how brighter amplitudes are
higher.
Figure 4 is a Paleo-depositional map of
Mangaa Formation from King and Thrasher
1996
Figure 5 is an Average Energy cross-section through the amplitude anomaly. This is to delineate the
strength of the anomaly from background amplitudes.
Figure 7 is the fluid replacement model for the Arawa-1 well with the assumption of 100% gas. Additional the AVO
synthetic of both the original water saturation and for the model accompanies this. In yellow is the horizon of interest for
AVO comparison.
Figure 8 is compilation of near mid and far offsets
within the reservoir. Dashed in yellow is the
horizon of interest for AVO comparison.
Figure 9 is compilation of near mid and far
offsets outside of the reservoir. Dashed in
yellow is the horizon of interest for AVO
comparison.
Coherence Time Slice Amplitude Extraction with Structure Overlay Paleo-deposition
Average Energy Cross-Section
Awara-1
Fluid Replacement Model Arawa-1 P
T
B
B’
C
C’
A
A’
B B’
C C’