Empfohlen

Empfohlen
Weitere ähnliche Inhalte
Ähnlich wie Physiological pathway diagrams at rgd
Ähnlich wie Physiological pathway diagrams at rgd (20)
Mehr von Jennifer Smith
Mehr von Jennifer Smith (17)
Kürzlich hochgeladen
Kürzlich hochgeladen (20)
Physiological pathway diagrams at rgd
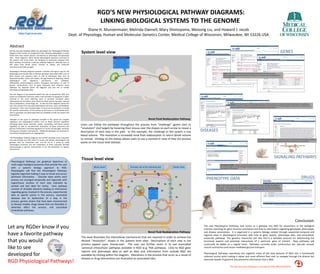
- 1. RGD’s new physiological pathway diagrams: linking biological systems to the genome Diane H. Munzenmaier,MelindaDwinell, Mary Shimoyama, Weisong Liu, and Howard J. Jacob Dept. of Physiology,Human and Molecular Genetics Center, Medical College of Wisconsin, Milwaukee, WI 53226 USA Abstract GENES System level view The Rat Genome Database (RGD) has developed new Physiological Pathway Diagrams that function as navigational hubs, allowing physiologists to easily follow links from known process mechanisms to phenotype and genotype data. These diagrams, which denote physiological processes occurring on the systems and tissue levels, are designed to seamlessly integrate with RGD’s existing intracellular molecular pathway diagrams, allowing users to drill down from whole animal function to cellular and molecular mechanisms and back up again. Physiological Pathway Diagrams provide a familiar and logical map for the physiologist and include links to relevant genotype data within RGD, such as gene reports and sequence data, as well as phenotype data, such as experimental data, strains and models, through flowcharts depicting related physiological and regulatory mechanisms and pathways. Additionally, pharmacological actions, drug-gene interactions, as well as genetic manipulations such as gene knockouts that influence these pathways are depicted within the diagrams and also link to related phenotype and genotype data. The first diagram to be released depicts the role of vasopressin (AVP, also known as antidiuretic hormone, ADH) in the activation of aquaporin-2 water channels in the renal collecting ducts to promote increased water reabsorption by the kidney when blood and fluid volume has been reduced due to dehydration, hemorrhage, etc. As with all of the diagrams within this tool, this consists of an overview depicting the stimulus, result, and feedback mechanism. Then, each involved organ or tissue can be zoomed in to reveal the specific mechanisms of the process at the tissue or multicellular level. Links to genotype and phenotype data are available at both the system and tissue levels. Examples of the types of pathways included in this portal are complex regulatory and physiological systems such as blood pressure regulation (including blood vessel reactivity, cardiac contractility, and blood volume regulation as well as neurohumoral modulation of these processes) and glucose homeostasis (including regulation of insulin and glucagon secretion and glucose transport mechanisms). Additional pathways are planned for and will be incorporated on an ongoing basis. The Physiological Pathway Diagrams tool at RGD promises to be a dynamic and user-friendly tool with which to access and retrieve physiological and genomic data for researchers who use the rat as a model to study physiological processes and the modulation of these processes through pharmacologic or genetic interventions or for the elucidation of disease mechanisms. Genes. Gene symbols will link to their specific gene reports where the user can access extensive genotype data and annotations on the gene in rat as well as species comparisons in mouse and human. Diseases. The disease tab of each physiological pathway contains useful links to diseases information associated with the pathway. When each disease is selected, the appropriate alterations will be depicted on the pathway diagram and described. Clicking into this disease will direct the user to the appropriate RGD disease ontology reports. Renal Fluid Reabsorption Pathway Users can follow the pathways throughout the process from “challenge” (green star) to “resolution” (red target) by hovering their mouse over the shapes on each arrow to reveal a description of each step in the path. In this example, the challenge to the system is low blood volume. The resolution is increased renal fluid reabsorption to return blood volume to normal. Clicking on the kidney allows users to see a zoomed in view of how the process works on the tissue level (below). DISEASES Intracellular signaling pathways. Steps that consist of canonical second messenger intracellular signaling pathways link to RGD’s existing Pathways tool to give the user a closer look. SIGNALING PATHWAYS Tissue level view Physiological Pathways are graphical depictions of multi-organ biological processes that provide the user with a systems biology approach to RGD. Physiologists will find the Physiological Pathways logically organized making it easy to locate and access pertinent information. Discrete steps within each process are arranged temporally and regionally with organ/tissue location of each step indicated by symbol and text label for clarity. Each pathway consists of clickable elements leading to information regarding genes involved in the process, experimental data at specific points in the process, associated diseases due to dysfunction of a step in the process, genetic strains that have been characterized as disease models, drugs classes that can favorably or adversely affect the process, and associated intracellular pathways. Phenotypes & Models. Clicking on discrete functional steps in the process takes the user to the associated page of the new Phenotypes & Models tool where specific values for related phenotypes can be accessed. DRUGS PHENOTYPEDATA Drugs. Another associated tab lists classes of pharmaceuticals that are used to modulate the pathway in some manner. When a class is selected, the diagram is altered in order to depict the effect of the drug on the pathway. The drug class names link to the PharmGKB (www.pharmgkb.org) website where information on specific drugs in each class can be found. Conclusion Let any RGDer know if you have a favorite pathway that you would like to see developed for RGD Physiological Pathways! The new Physiological Pathways toolserves as a gateway into RGD for researchers in the biological sciences searching for gene function annotation and links to information regarding genotypes, phenotypes and disease associations. It is organized in a systems biology context through sequential temporal and regional steps in physiological processes with links to gene reports, phenotype data, and intracellular molecular pathways. The genetics researcher will also find it a valuable resource for determining the functional aspects and potential interactions of a particular gene of interest. New pathways will continually be added on a regular basis. Pathways currently under construction are: vascular smooth muscle contraction and insulin-mediated glucose transport. Physiological Pathways seamlessly ties together many of the best features of RGD into a functionally coherent access point making it easier and more efficient than ever to navigate through the diverse but extensive wealth of genomic and phenomic information that is RGD. Renal Fluid Reabsorption Pathway This level illustrates the intercellular mechanisms that are required in order to achieve the desired “resolution”, shown in the systems level view. Descriptions of each step in the process appear upon mouse-over. The user can further zoom in to see associated canonical intracellular pathways available in RGD (e.g. PKA pathway). Links to RGD gene reports and phenotype data as well as data and information from outside RGD are available by clicking within the diagram. Alterations in the process that occur as a result of disease or drug intervention are illustrated on associated tabs. The Rat Genome Database is funded by NIH 5R01HL064541