

Empfohlen
Empfohlen
Weitere ähnliche Inhalte
Was ist angesagt?
Was ist angesagt? (20)
Andere mochten auch
Andere mochten auch (20)
Ähnlich wie R130301114118
Ähnlich wie R130301114118 (20)
Mehr von IOSR Journals
Kürzlich hochgeladen
Kürzlich hochgeladen (20)
R130301114118
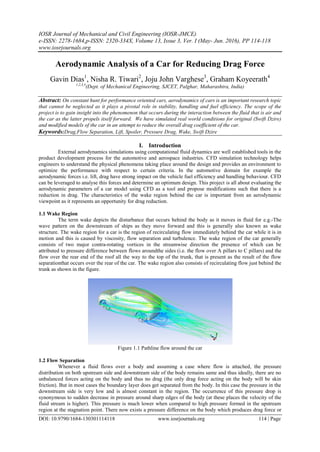
- 1. IOSR Journal of Mechanical and Civil Engineering (IOSR-JMCE) e-ISSN: 2278-1684,p-ISSN: 2320-334X, Volume 13, Issue 3, Ver. I (May- Jun. 2016), PP 114-118 www.iosrjournals.org DOI: 10.9790/1684-130301114118 www.iosrjournals.org 114 | Page Aerodynamic Analysis of a Car for Reducing Drag Force Gavin Dias1 , Nisha R. Tiwari2 , Joju John Varghese3 , Graham Koyeerath4 1,2,3,4 (Dept. of Mechanical Engineering, SJCET, Palghar, Maharashtra, India) Abstract: On constant hunt for performance oriented cars, aerodynamics of cars is an important research topic that cannot be neglected as it plays a pivotal role in stability, handling and fuel efficiency. The scope of the project is to gain insight into the phenomenon that occurs during the interaction between the fluid that is air and the car as the latter propels itself forward. We have simulated real world conditions for original (Swift Dzire) and modified models of the car in an attempt to reduce the overall drag coefficient of the car. Keywords:Drag,Flow Separation, Lift, Spoiler, Pressure Drag, Wake, Swift Dzire I. Introduction External aerodynamics simulations using computational fluid dynamics are well established tools in the product development process for the automotive and aerospace industries. CFD simulation technology helps engineers to understand the physical phenomena taking place around the design and provides an environment to optimize the performance with respect to certain criteria. In the automotive domain for example the aerodynamic forces i.e. lift, drag have strong impact on the vehicle fuel efficiency and handling behaviour. CFD can be leveraged to analyse this forces and determine an optimum design. This project is all about evaluating the aerodynamic parameters of a car model using CFD as a tool and propose modifications such that there is a reduction in drag. The characteristics of the wake region behind the car is important from an aerodynamic viewpoint as it represents an opportunity for drag reduction. 1.1 Wake Region The term wake depicts the disturbance that occurs behind the body as it moves in fluid for e.g.-The wave pattern on the downstream of ships as they move forward and this is generally also known as wake structure. The wake region for a car is the region of recirculating flow immediately behind the car while it is in motion and this is caused by viscosity, flow separation and turbulence. The wake region of the car generally consists of two major contra-rotating vortices in the streamwise direction the presence of which can be attributed to pressure difference between flows aroundthe sides (i.e. the flow over A pillars to C pillars) and the flow over the rear end of the roof all the way to the top of the trunk, that is present as the result of the flow separationthat occurs over the rear of the car. The wake region also consists of recirculating flow just behind the trunk as shown in the figure. Figure 1.1 Pathline flow around the car 1.2 Flow Separation Whenever a fluid flows over a body and assuming a case where flow is attached, the pressure distribution on both upstream side and downstream side of the body remains same and thus ideally, there are no unbalanced forces acting on the body and thus no drag (the only drag force acting on the body will be skin friction). But in most cases the boundary layer does get separated from the body. In this case the pressure in the downstream side is very low and is almost constant in the region. The occurrence of this pressure drop is synonymous to sudden decrease in pressure around sharp edges of the body (at these places the velocity of the fluid stream is higher). This pressure is much lower when compared to high pressure formed in the upstream region at the stagnation point. There now exists a pressure difference on the body which produces drag force or
- 2. Aerodynamic Analysis Of A Car For Reducing Drag Force DOI: 10.9790/1684-130301114118 www.iosrjournals.org 115 | Page pressure drag on the body. As seen from the figure below, recirculating flow is caused by the flow separation, the thickness of the boundary layer increases before the velocity reverses indicating a boundary layer separation. Figure 1.2 Flow separation II. Methodology 2.1 Cad Model For analysis purpose we wanted to conduct various tests on a practical car which is used by the masses. We came to a conclusion to select Swift Dzire as our test model. CAD software that was used to model the car is Solidworks. While modelling in order to reduce complexity, we neglected various intricate features of the car keeping in mind that such simplifications must not affect the results in an appreciable way.This simplifiesthe meshing process, since lesser numberof surfaces and curvesare used to make a simplified topology. Figure 2.1 Original Car Model The model was made by using a combination of solid and surface modelling methods. First the block of dimensions1695*1555*3995 (external dimensions of the car) was made which was later cut according to the outer profiles of thefront, top and side of the car. Thus we obtained an approximate model over which we projected curves so as to complete the surfaces which defines the outer topology of the car. 2.2 Modification We have made two modifications. In the first case we the two surfaces which were trunk and rear windscreen were deleted and using the middle section a spline was drawn till the end of the trunk. The resulting shape was closer to that of a fastback.In the second modification we attached a spoiler to the car. The dimensions of the attached spoiler are spoiler height 20mm having a slant angle of 20 degree with the vertical. Figure 2.2 Fastback type modification Figure 2.3 Lip type spoiler 2.3 Control Volume And Meshing The control volume that was generated had dimensions of approximately 10L*2L*1.5L where L= 3.995 metre using the enclosure command. The body was placed in the control volume with a spacing of 6.6L downstream and 2.4L upstream to make sure that all relevant turbulent length-scales in the flow is captured. Boolean operator was used to subtract the volume of the body from the control volume to avoid meshing this
- 3. Aerodynamic Analysis Of A Car For Reducing Drag Force DOI: 10.9790/1684-130301114118 www.iosrjournals.org 116 | Page Figure 2.4 Mesh of original car volume. This reduces the mesh size without affecting the solution as the software considers the outer surfaces of the volume removed as walls for which fluent by default applies the no slip conditions. The meshing of the resulting volume was accomplished by tetrahedral meshing. The resulting view of the mesh thus formed is shown aside. 2.4 Simulation The model was further imported to a simulation software ANSYS FLUENT which specializes in solving CFD problems. In a view to simulate real life conditions we decided to simulate the forces acting on the car when it moves at a speed of 40 m/s (approx. 144 km/hr) the choice for speed is for the purpose of magnifying the effects of drag force so that it is easily measurable. For simulation a control volume was made on similar linesofAhmed body control volume, in order to make sure that all the relevant characteristics of turbulence in the flow is captured. No slip conditions were given to both road and the body of the car. On the output pressure gradient was given as 0 gauge pressure. We decided to go ahead with a comparatively coarse mesh considering our hardware and time limitations. On first solving with steady state conditions we encountered ripples in residual output and in both Cd and Cl values and then we changed to transient solver. We kept a timestep value of 0.001 which was enough to ensure convergence within 10-15 iterations per time step. This parameter is very important in order to ensure fidelity of the solution. III. Results And Discussions On analysis of the actual car model drag coefficient was found to be 0.375. Both the velocity and pressure contours are shown below. Figure 3.1 Pressure contour Figure 3.2 Velocity contour The pressure contour diagram clearly shows the stagnation point in front of the car as air is almost stagnant in those regions. Similarly by Bernoulli’s principle a high pressure region inversely corresponds to a low velocity region as seen in velocity contour. Though a high magnitude of pressure does exist in the upstream side, the contour plot shown above is a bit exaggerated as the presence of engine vents, grilles and other open spaces have been neglected during modelling phase for simplification. Figure 3.3 Pressure contour of fastback Figure 3.4 Velocity contour of fastback
- 4. Aerodynamic Analysis Of A Car For Reducing Drag Force DOI: 10.9790/1684-130301114118 www.iosrjournals.org 117 | Page Figure3.5 pressure contour of car with spoiler Figure 3.6 3 velocity contour of car with spoiler On applying the same boundary conditions and on solving the problem we get drag coefficient of 0.335and 0.35 respectively. Though both pressure and velocity contours can be read similarly as explained above, a closer observation to the contours explains the reasons why there is a reduction in drag.In the first modification the sedan’s three box design was changed into a fastback design.When we compare the velocity profiles of the original and fastback model we see that as air remains attached to the rear glass of the modified car the flow separation is delayed. The wake region thus formed is much smaller than what it is for the original model thereby causing a decrease in drag. The second modification is an addition of attached spoiler .The wing spoiler is an inverted aerofoil. Aerofoils are generally used to produce lift which is an upward force but when these devices are placed in an inverted position they produce force in the downward direction. This force is called downforce which increases the traction of the vehicle and thereby makes high speed cornering possible, but it reduces the top speed of the car. The attached spoiler obstructs thelocalized air flow and hence prevents the air being pulled downward which would otherwise generate turbulence and low pressure air pockets behind the vehicle contributing to pressure drag. The spoiler creates relatively stagnant pocket of air between rear window and spoiler. The fast moving air does not enter this air pocket and hence will not hit the spoiler. Due to this, the flow velocity will be slower in this region and correspondingly the pressure will be higher, thereby decreasing the overall pressure difference and hence the pressure drag. The significance of the result can be illustrated from the calculations below: Fd =(0.5)ρCDAfU2 Where, ρ= density of air = 1.225 kg/m3 CD= coefficient of drag depending on the model Af= frontal area =2.1347 m2 U= velocity of flow =40 m/s Thus Fd = 784.5N (original car) = 700.8N (fastback model) = 732.2N (attached spoiler model) Power = Fd*U = 42.06 PS (original car) = 37.58 PS (fastback model) = 39.26 PS (attached spoiler model) IV. Conclusion The results obtained showed that by changing the design to a fastbackCd can reduced by a value of .04 and by adding the attached spoiler the value of Cd reduces by 0.025. Though this number may appear to be substantially low, this reduction in drag coefficient is considerable from aerodynamic point of view as it amounts to reduction of power consumption by 4.48PS and 2.8PS respectively for fastback and attached spoiler models at 40m/s. Acknowlegements We would like to express our deep gratitude to our project guide Mr.AmbeprasadKushwaha Assistant Professor Mechanical Department, SJCET, Palghar for his suggestions, timely intimation without which the project would have not been completed.
- 5. Aerodynamic Analysis Of A Car For Reducing Drag Force DOI: 10.9790/1684-130301114118 www.iosrjournals.org 118 | Page References [1] Wolf-Heinrich Hucho, Aerodynamics of Road Vehicles, 4th Revised Edition, Society of Automotive Engineers, U.S., 1998, ISBN: 978-0768000290 [2] ChanchanRajsinhB. And ThundilKarippa Raj R; Numerical Investigation of External Flow around the Ahmed Reference Body using computational Fluid Dynamic; Research Journal of Recent Science; Vol.1(9),1-5, September 2012. [3] Ambeprasad.S.Kushwaha; Comaparative Study of Rectangular, Trapezoidal and Parabolic Shaped Finned Heat sink; e- ISSN: 2278-1684 Volume 5; Issue 6;(Mar. – Apr. 2013) [4] Vittorio Celli; Univ. of Verginia; Boundary layer separation and pressure drag; EDT 1997; http://galileo.phys.virginia.edu/classes/311/notes/fluids2/node11.html [5] Wake;Wikipedia;14 April 2016;https://en.wikipedia.org/wiki/Wake [6] Frank Werner, Steffen Frik, Adam Opel AG, Josepf Schulze; Aerodynamics Optimization of the Opel Calibra ITC Racing car using exrperiments and computational fluid dynamics.homepage.ntlworld.com/hoglabs/docs/calibre_aerodynamics/aerodynamics.htm [7] K.V.S Pavan (May 2012- July2012); CFD Modelling of flow around Ahmed Body. es/www.cd_adapco.com/sitdefault/files/technical_document/pdf/PavanIITHyderbad.pdf [8] Oxford Brookes University school of technology (September 2012);Aerodynamic analysis and optimization of the rear wing of WRC car.www.cd_adapco.com/sites/default/files/technical_document/pdf/zpch%202011%200148_0.pdf [9] C. Hinterberger, M. Garica-Villalba and W. Rodi; large eddy simulation of flow around the Ahmed body. user.engineering.uiowa.edu/῀me_160/lab/LESahmedcurrod.pdf