Mapping the risk of Rift Valley fever in Uganda
•
2 gefällt mir•296 views

Poster by Dan Tumusiime, Simon Kihu, Edna Mutua and Bernard Bett presented at a Biological Threat Reduction Program science program review meeting, Warsaw, Poland, 17–20 September 2019.
Empfohlen

Empfohlen
Weitere ähnliche Inhalte
Was ist angesagt?
Was ist angesagt? (20)
Ähnlich wie Mapping the risk of Rift Valley fever in Uganda
Ähnlich wie Mapping the risk of Rift Valley fever in Uganda (20)
Mehr von ILRI
Mehr von ILRI (20)
Kürzlich hochgeladen
Kürzlich hochgeladen (20)
Mapping the risk of Rift Valley fever in Uganda
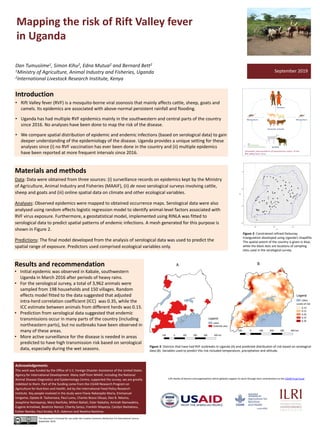
- 1. Mapping the risk of Rift Valley fever in Uganda Dan Tumusiime1, Simon Kihu2, Edna Mutua2 and Bernard Bett2 1Ministry of Agriculture, Animal Industry and Fisheries, Uganda 2International Livestock Research Institute, Kenya Introduction • Rift Valley fever (RVF) is a mosquito-borne viral zoonosis that mainly affects cattle, sheep, goats and camels. Its epidemics are associated with above-normal persistent rainfall and flooding. • Uganda has had multiple RVF epidemics mainly in the southwestern and central parts of the country since 2016. No analyses have been done to map the risk of the disease. • We compare spatial distribution of epidemic and endemic infections (based on serological data) to gain deeper understanding of the epidemiology of the disease. Uganda provides a unique setting for these analyses since (i) no RVF vaccination has ever been done in the country and (ii) multiple epidemics have been reported at more frequent intervals since 2016. Pictures Results and recommendation • Initial epidemic was observed in Kabale, southwestern Uganda in March 2016 after periods of heavy rains. • For the serological survey, a total of 3,962 animals were sampled from 198 households and 150 villages. Random effects model fitted to the data suggested that adjusted intra-herd correlation coefficient (ICC) was 0.35, while the ICC estimate between animals from different herds was 0.15. • Prediction from serological data suggested that endemic transmissions occur in many parts of the country (including northeastern parts), but no outbreaks have been observed in many of these areas. • More active surveillance for the disease is needed in areas predicted to have high transmission risk based on serological data, especially during the wet seasons. Acknowledgements This work was funded by the Office of U.S. Foreign Disaster Assistance of the United States Agency for International Development. Many staff from MAAIF, including the National Animal Disease Diagnostics and Epidemiology Centre, supported the survey; we are greatly indebted to them. Part of the funding came from the CGIAR Research Program on Agriculture for Nutrition and Health, led by the International Food Policy Research Institute. Key people involved in the study were Flavia Nakanjako Maria, Emmanuel Isingoma, Optato B. Tashoroora, Paul Lumu, Charles Bosco Okuyo, Deo B. Ndumu, Josephine Namayanja, Mary Nanfuka, Milton Bahati, Ester Nabatta, Aminah Namwabira, Eugene Arinaitwe, Beatrice Nanozi, Charity Sanyu, Franklin Mayanja, Carolyn Namatovu, Esther Nambo, Paul Kirabo, R.O. Ademun and Noelina Nantima. This document is licensed for use under the Creative Commons Attribution 4.0 International Licence. September 2019. September 2019 Materials and methods Data: Data were obtained from three sources: (i) surveillance records on epidemics kept by the Ministry of Agriculture, Animal Industry and Fisheries (MAAIF), (ii) de novo serological surveys involving cattle, sheep and goats and (iii) online spatial data on climate and other ecological variables. Analyses: Observed epidemics were mapped to obtained occurrence maps. Serological data were also analysed using random effects logistic regression model to identify animal-level factors associated with RVF virus exposure. Furthermore, a geostatistical model, implemented using RINLA was fitted to serological data to predict spatial patterns of endemic infections. A mesh generated for this purpose is shown in Figure 2. Predictions: The final model developed from the analysis of serological data was used to predict the spatial range of exposure. Predictors used comprised ecological variables only. ILRI thanks all donors and organizations which globally support its work through their contributions to the CGIAR Trust Fund. Figure 2: Constrained refined Delaunay triangulation developed using Uganda’s shapefile. The spatial extent of the country is given in blue, while the black dots are locations of sampling sites used in the serological survey. Figure 3: Districts that have had RVF outbreaks in Uganda (A) and predicted distribution of risk based on serological data (B). Variables used to predict this risk included temperature, precipitation and altitude. A B