Prediction of Atmospheric Pressure is one important and challenging task that needs lot of attention and study for analyzing atmospheric conditions. Advent of digital computers and development of data driven artificial intelligence approaches like Artificial Neural Networks (ANN) have helped in numerical prediction of pressure. However, very few works have been done till now in this area. The present study developed an ANN model based on the past observations of several meteorological parameters like temperature, humidity, air pressure and vapour pressure as an input for training the model. The novel architecture of the proposed model contains several multilayer perceptron network (MLP) to realize better performance. The model is enriched by analysis of alternative hybrid model of k-means clustering and MLP. The improvement of the performance in the prediction accuracy has been demonstrated by the automatic selection of the appropriate cluster.
From Physical to Virtual Wireless Sensor Networks using Cloud Computing
Prediction of Atmospheric Pressure at Ground Level using Artificial Neural Network
1. International Journal of Research in Computer Science
eISSN 2249-8265 Volume 3 Issue 1 (2013) pp. 11-18
www.ijorcs.org, A Unit of White Globe Publications
doi: 10.7815/ijorcs. 31.2013.056
PREDICTION OF ATMOSPHERIC PRESSURE AT GROUND
LEVEL USING ARTIFICIAL NEURAL NETWORK
Angshuman Ray1, Sourav Mukhopadhyay2, Bimal Datta3, Srimanta Pal4
12
Institute of Engineering and Management,Salt Lake Electronics Complex, INDIA
Email: 1angshuman.ray@iemcal.com, 2saurabh.mukherji@gmail.com
3
Regent Education and Research Foundation Group of Institutions, Barrackpore, Kolkata, INDIA
Email: bkd_hetc@yahoo.co.in
4
Indian Statistical Institute, Kolkata, INDIA
Email: srimanta@isical.ac.in
Abstract: Prediction of Atmospheric Pressure is one also important to note that the atmospheric pressure is
important and challenging task that needs lot of just one of many factors that affect fish feeding habits.
attention and study for analyzing atmospheric
Presently, weather predictions are made by
conditions. Advent of digital computers and
collecting quantitative data about the current state of
development of data driven artificial intelligence
the atmosphere and using scientific understanding of
approaches like Artificial Neural Networks (ANN)
the atmospheric processes to project how the
have helped in numerical prediction of pressure.
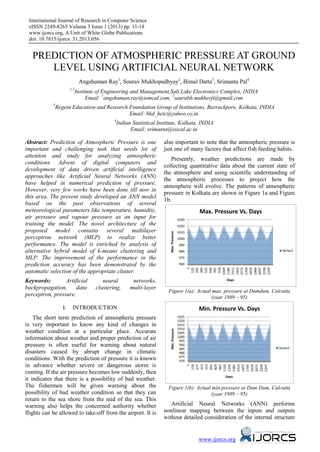
atmosphere will evolve. The patterns of atmospheric
However, very few works have been done till now in
pressure in Kolkata are shown in Figure 1a and Figure
this area. The present study developed an ANN model
1b.
based on the past observations of several
meteorological parameters like temperature, humidity,
air pressure and vapour pressure as an input for 1030
training the model. The novel architecture of the 1020
proposed model contains several multilayer 1010
Max. Pressure
perceptron network (MLP) to realize better 1000
performance. The model is enriched by analysis of 990
alternative hybrid model of k-means clustering and 980 Series1
MLP. The improvement of the performance in the 970
prediction accuracy has been demonstrated by the 960
1049
1180
1311
1442
1573
1704
1835
1966
2097
2228
2359
132
263
394
525
656
787
918
1
automatic selection of the appropriate cluster.
Keywords: Artificial neural networks, Days
backpropagation, data clustering, multi-layer
Figure 1(a): Actual max. pressure at Dumdum, Calcutta
perceptron, pressure. (year 1989 – 95)
I. INTRODUCTION
The short term prediction of atmospheric pressure 1025
1020
is very important to know any kind of changes in 1015
1010
Min. Pressure
weather condition at a particular place. Accurate 1005
1000
information about weather and proper prediction of air 995
pressure is often useful for warning about natural 990
985 Series1
disasters caused by abrupt change in climatic 980
975
conditions. With the prediction of pressure it is known 970
in advance whether severe or dangerous storm is
1105
1243
1381
1519
1657
1795
1933
2071
2209
2347
139
277
415
553
691
829
967
1
coming. If the air pressure becomes low suddenly, then
Days
it indicates that there is a possibility of bad weather.
The fishermen will be given warning about the Figure 1(b): Actual min pressure at Dum Dum, Calcutta
possibility of bad weather condition so that they can (year 1989 – 95)
return to the sea shore from the mid of the sea. This
warning also helps the concerned authority whether Artificial Neural Networks (ANN) performs
flights can be allowed to take-off from the airport. It is nonlinear mapping between the inputs and outputs
without detailed consideration of the internal structure
www.ijorcs.org
2. 12 Angshuman Ray, Sourav Mukhopadhyay, Bimal Datta, Srimanta Pal
of the physical processes associated with pressure. The main objective of MLP learning is to set the
This approach is essentially a data driven approach. connection weights in such a way the error between
ANN emulates the parallel distributed processing of the network output and the target output is minimized.
the human nervous system and are parallel A typical MLP network is shown in Figure 2.
computational models, comprising closely According to [2] under a fairly general assumption a
interconnected adaptive processing units. The adaptive single hidden layer is sufficient for multilayer
nature of neural networks adopts artificial intelligence perceptron to compute an uniform approximation of a
(AI) learning techniques like supervised and given training set of input and output. So, the present
unsupervised learning. ANN model has already proved study is restricted to three-layer network i.e. one
to be very powerful in dealing with complex problems hidden layer.
like function approximation, pattern recognition and
has been applied for weather prediction, stock market
prediction etc.
A number of studies have been reported that have
used ANN to model complex nonlinear relation of
input and output for weather forecasting [6][7].
However, very few works have used ANN-based
connectionist methods to forecast air pressure. Again,
all of these works are restricted to feed forward ANN
models with back propagation and that uses either
linear or nonlinear time series data only.
This paper is an outcome of an ANN based air
pressure prediction model developed, trained and
tested with continuous (daily) ground level air pressure Figure 2: A typical MLP for air pressure prediction
data as input over a period of 7 years [1]. Here two
distinct alternative models, namely MLP and Hybrid B. Clustering
Kmeans-MLP have been studied and analyzed.
However, these 2 models, MLP and Hybrid Kmeans- Cluster analysis or clustering is the assignment of a
MLP were designed and tested separately with set of observations into subsets (called clusters) so that
different number of hidden nodes. The results observations in the same cluster are similar in some
produced by each of the models were compared and sense. It is used to operate on a large data-set to
the suitability of the models were justified. The model discover hidden pattern and relationship helps to make
has been applied to justify that ANN is an appropriate decision quickly and efficiently. Clustering is a
predictor for air pressure forecasting. The prediction is method of unsupervised learning, and a common
based on the past observations of several technique for statistical data analysis used in many
meteorological parameters like temperature, humidity, fields, including machine learning, data mining,
air pressure and vapor pressure. The data was collected pattern recognition, image analysis and bioinformatics.
daily by the meteorological department of Dumdum
Airport. 1. Implementation of K-Means Clustering Algorithm:
K-Means is one of the simplest unsupervised
II. ANN APPROACH learning algorithms used for clustering. K-means
In this section the basics of the 2 models as referred partitions n observations into k clusters in which each
in Section 1 are discussed. This theoretical basis of the observation belongs to one of the clusters whose centre
models has been applied during the design and is nearest.This algorithm aims at minimizing an
implementation of the same. objective function, in this case a squared error
function.
A. Multilayer Perceptron (MLP)
Initially we have only the raw data. So, it is
MLP is one of the most widely used neural network clustered around a single point. If the cluster number K
architectures. It consists of several layers of neurons of is fixed then we need to cluster around that point. If
which the first layer is known as the input layer, last the cluster is not fixed then it is continued until the
layer is known as the output layer and the remaining centered is not changed. Initially the whole data is in a
layers are called as hidden layer. Every node in the same group. But when K-means clustering is applied
hidden layers and the output layer computes the on it then it clusters the whole data into four major
weighted sum of its inputs and apply a sigmoidal categories.
activation function to compute its output, which is then
transmitted to the nodes of the next layer as input [3]. The following is the algorithm:
www.ijorcs.org
3. Prediction of Atmospheric Pressure at Ground Level using Artificial Neural Network 13
Step 1. The algorithm arbitrarily selects k points as the years were chosen as the training data sets. The data is
initial cluster centers (“means”). pre-processed before training. The detail of the pre-
Step 2. Each point in the dataset is assigned to the processing is discussed in the next section.
closed cluster, based upon the Euclidean Our model has the following functional relations.
𝑓�𝑀𝑖𝑛. 𝑇𝑒𝑚𝑝(𝑡 − 1), 𝑀𝑎𝑥. 𝑇𝑒𝑚𝑝(𝑡 − 1), 𝑀𝑖𝑛. 𝑅𝐻(𝑡
distance between each point and each cluster
Max. Pressure (t) =
− 1), 𝑀𝑎𝑥. 𝑅𝐻(𝑡 − 1), 𝑀𝑖𝑛. 𝑃𝑟𝑒𝑠𝑠(𝑡
center.
− 1), 𝑀𝑎𝑥. 𝑃𝑟𝑒𝑠𝑠(𝑡 − 1), 𝑀𝑖𝑛 𝑉𝑃(𝑡
Step 3. Each cluster center is recomputed as the
− 1), 𝑀𝑎𝑥. 𝑉𝑃(𝑡 − 1), 𝑅𝑎𝑖𝑛(𝑡 − 1)�
average of the points in that cluster.
Step 4. Repeat Step 2 and Step 3 until the centroids no
𝑓�𝑀𝑖𝑛. 𝑇𝑒𝑚𝑝(𝑡 − 1), 𝑀𝑎𝑥. 𝑇𝑒𝑚𝑝(𝑡 − 1), 𝑀𝑖𝑛. 𝑅𝐻(𝑡
longer move. This produces a separation of the Max. Pressure (t) =
− 1), 𝑀𝑎𝑥. 𝑅𝐻(𝑡 − 1), 𝑀𝑖𝑛. 𝑃𝑟𝑒𝑠𝑠(𝑡
objects into different clusters.
− 1), 𝑀𝑎𝑥. 𝑃𝑟𝑒𝑠𝑠(𝑡 − 1), 𝑀𝑖𝑛 𝑉𝑃(𝑡
− 1), 𝑀𝑎𝑥. 𝑉𝑃(𝑡 − 1), 𝑅𝑎𝑖𝑛(𝑡 − 1)�
III. DATA SETS AND EXPERIMENTS
The present study developed an ANN model based
on the past observations of several meteorological This model is non-deterministic model and
parameters like temperature, humidity, air pressure and therefore Artificial Neural Network approach is used
vapor pressure as an input for training the model. The to predict maximum and minimum pressure at a
developed model overcomes the difficulties in training particular day on the basis of past observations.
ANN models with continuous data. The architecture of
the proposed model contains several multilayer The functional relation between the max. pressure
perceptron network (MLP). The model is enriched by and other parameters is non-linear. The ANN model is
analysis of alternative hybrid model of k-means a non-linear model. That is why we are implementing
clustering and MLP for better prediction. The the prediction of max. pressure and min. pressure by
improvement of the performance in the prediction using ANN approach.
accuracy has been demonstrated by the online
1
The relation between output (O) and input (x) is
�𝑂 = 𝐹(𝑥) = �
selection of the appropriate cluster. given by
1 + 𝑒 −𝑤.𝑥
The experiments were carried out in the following
sequence. First, the effectiveness of multilayer
𝑀𝑖𝑛. 𝑇𝑒𝑚𝑝(𝑡 − 1), 𝑀𝑎𝑥. 𝑇𝑒𝑚𝑝(𝑡 − 1), 𝑀𝑖𝑛. 𝑅𝐻(𝑡
Where x =
− 1), 𝑀𝑎𝑥. 𝑅𝐻(𝑡 − 1), 𝑀𝑖𝑛. 𝑃𝑟𝑒𝑠𝑠(𝑡
perceptron networks was studied for prediction of air
− 1), 𝑀𝑎𝑥. 𝑃𝑟𝑒𝑠𝑠(𝑡 − 1), 𝑀𝑖𝑛 𝑉𝑃(𝑡
pressure. Next, in Hybrid model cluster is selected
− 1), 𝑀𝑎𝑥. 𝑉𝑃(𝑡 − 1), 𝑅𝑎𝑖𝑛(𝑡 − 1)
online while producing good prediction.
A. Data Acquisition
The meteorological data were captured by the B. Data Preprocessing
Dumdum meteorological center of Kolkata. The
parameters of the data acquisition are: Neural network training can be made more efficient
if certain preprocessing steps are performed on the
i. Minimum Temperature (Min. Temp(t)) network inputs and targets. Before training, it is often
ii. Maximum Temperature (Max. Temp(t)) useful to scale the inputs and targets so that they
iii. Minimum Relative Humidity (Min. RH(t)) always fall within a specified range. The input metrics
iv. Maximum Relative Humidity (Max. RH(t)) were normalized using min-max normalization. Min-
v. Minimum Air Pressure (Min. Press.(t)) max normalization performs a linear transformation on
vi. Maximum Air Pressure (Max. Press.(t)) the original data. Suppose that minA and maxA are the
vii. Minimum Vapour Pressure (Min. VP(t)) minimum and maximum values of an attribute A. It
viii. Maximum Vapour Pressure (Max. VP(t)) maps value v of A to v’ in the range -1 to 1 using the
𝑣 − 𝑚𝑖𝑛 𝐴
formula below:
𝑦′ =
ix. Rainfall (Rain(t))
𝑚𝑎𝑥 𝐴 − 𝑚𝑎𝑥 𝐴
This information is stored in an input file. The file
contains data of seven years. So, there is an The trained network is simulated with the
observation of 9 variables on a particular day, say t. In normalized input, and then the network output is
the MLP model the air pressure for the next (tth) day is converted back into the original units.
determined by the atmospheric parameters for the
C. Methodologies
current day i.e. day (t-1). To enable the selection of the
best model, the training data set should cover air The data was organized for training and testing.
pressure at different seasons. So the data for entire The records of the input file were partitioned into two
www.ijorcs.org
4. 14 Angshuman Ray, Sourav Mukhopadhyay, Bimal Datta, Srimanta Pal
separate files. One input file containing 60% of the different number of hidden nodes in the hidden layer.
total records was used for training the ANN. This is The number of nodes in hidden layer was taken as 3, 4,
considered as ‘training data set’. The other input file 5, 6 and 7.
containing rest 40% records was considered as ‘test
In case of hybrid Kmeans-MLP model, the model
data set’. This was used for testing the network. The
itself partitions the training data into homogenous
resulting output predictions yj (t) are compared with a
subgroups. It trains all the clusters (subgroups) as
corresponding desired or actual output, dj (t). The mean
different networks. While testing, the model read a set
squared error at any time t, E(t), is calculated using the
1
of test data first and it selects the proper network for
𝑀𝑆𝐸(𝑡) = �(𝑦 𝑗 (𝑡)𝑑 𝑗 (𝑡))2 𝑓𝑜𝑟 𝑗 = 1 𝑡𝑜 𝑛
formula.
this data set by clustering method and then it triggers
2
that network for the computation of the output.
The following is the diagrammatical representation
For the MLP model, the transfer function is the for the use of hybrid K means-MLP network.
well-known sigmoid function. There was a single
hidden layer and several runs of MLP were made with
Figure 3: Hybrid Neural Network for Pressure prediction.
Table 1: Cumulative percentage frequency for MLP Networks
Range in % Frequency of pressure for test data
mb nh 3 nh 4 nh 5 nh 6 nh 7
max min max min max min max min max min
±0.5 7.8 12.0 7.8 12.7 9.3 13.8 7.2 13.0 7.3 13.0
±1.0 16.0 25.5 15.5 26.2 19.0 28.0 16.0 29.8 16.7 26.8
±1.5 24.0 40.8 23.8 41.7 29.5 39.8 26.7 43.5 24.3 40.7
±2.0 33.3 51.5 32.8 51.7 39.5 52.0 36.0 56.0 33.8 52.5
±2.5 41.7 62.2 41.2 62.7 48.2 62.5 46.8 67.3 43.3 63.7
±3.0 51.7 72.0 50.7 73.7 59.0 72.2 55.7 76.2 52.2 74.0
±3.5 61.8 80.7 62.3 81.2 68.5 80.5 67.3 82.8 63.2 81.8
±4.0 72.8 85.8 73.5 86.2 77.0 86.2 77.0 87.8 74.5 87.0
Max Dev 11.1 9.0 12.9 9.1 11.7 9.1 14.0 9.2 13.7 9.0
Avg Dev 2.9 2.2 2.9 2.2 2.7 2.2 2.8 2.1 2.9 2.2
www.ijorcs.org
5. Prediction of Atmospheric Pressure at Ground Level using Artificial Neural Network 15
IV. RESULTS AND OBSERVATIONS
After the input file is prepared, the training is done
𝑀𝑖𝑛 𝑇𝑒𝑚𝑝(𝑡 − 1), 𝑀𝑎𝑥 𝑇𝑒𝑚𝑝(𝑡 − 1), 𝑀𝑖𝑛 𝑉𝑝𝑟 𝑃𝑟𝑠(𝑡 −
taking into consideration all the parameters such as:
1), 𝑀𝑎𝑥 𝑉𝑝𝑟 𝑃𝑟𝑠(𝑡 − 1), 𝑀𝑎𝑥 𝑃𝑟𝑠(𝑡 − 1), 𝑀𝑖𝑛 𝑃𝑟𝑠(𝑡 −
1), 𝑀𝑖𝑛 𝑅𝑒𝑙 𝐻𝑢𝑚𝑖𝑑𝑖𝑡𝑦(𝑡 − 1), 𝑀𝑎𝑥 𝑅𝑒𝑙 𝐻𝑢𝑚𝑖𝑑𝑖𝑡𝑦(𝑡 −
1), 𝑟𝑎𝑖𝑛𝑓𝑎𝑙𝑙(𝑡 − 1)
After the training the testing is done. The result is
shown in the previous table (Table 1). The graphical
representation of the target and computed air pressure
is shown in the following Figure 4a and Figure 4b.
Figure 4(b): Graphical representation of target and
computed min pressure for MLP Network.
The results obtained from MLP are satisfactory. But
these results are not so good. One possible reason for
this can be the presence of seasonality. This can be
improved further. So we now propose a hybrid
network of Kmeans-MLP which can account for
seasonality of data. Our basic philosophy would be as
follows.
The hybrid Kmeans-MLP model will group the
data, X, into a set of homogeneous subgroups. Then
for each subgroup it trains a separate feed forward
network. In this prediction, the model will choose the
appropriate trained MLP and then apply the test input
Figure 4(a): Graphical representation of target and to that net to get the prediction. The partitioning of the
computed max pressure for MLP Network. training data will be done using a K-means clustering.
Figure 4a implies that the square of the measure of The following tables (Table 2 and Table 3) and
goodness of fit R2 is 0.853 on the basis of the MLP. Figure (Figure 5) shows that the hybrid model gives
Similarly from Figure 4b it is found that the square of the better result.
the measure of goodness of fit R2 is 0.880.
Table 2: Cumulative percentage frequency for hybrid Kmeans-MLP Networks
% Frequency of pressure for test data
Range in
nh 3 nh 4 nh 5 nh 6 nh 7
mb
max min max min max min max min max min
±0.5 12.3 16.0 12.5 17.3 14.0 16.7 15.3 18.7 15.3 17.8
±1.0 25.0 33.0 26.3 33.5 27.0 34.2 28.5 33.8 28.2 33.7
±1.5 37.3 47.7 37.0 49.3 39.3 49.3 41.7 48.7 40.7 48.8
±2.0 47.7 60.3 49.3 61.8 49.8 62.8 52.2 63.3 52.0 64.5
±2.5 55.7 69.5 58.3 71.8 59.0 71.2 63.7 72.0 62.8 72.3
±3.0 64.5 79.7 67.2 78.7 68.3 80.5 74.0 79.2 74.5 79.3
±3.5 74.8 86.0 76.8 86.8 77.0 87.7 82.5 87.5 82.3 87.7
±4.0 84.0 90.8 84.0 91.0 84.8 92.2 87.3 91.3 87.5 92.2
Max Dev 21.6 8.2 12.6 8.5 11.4 8.2 10.6 8.3 24.5 8.2
Avg Dev 2.5 1.9 2.3 1.9 2.3 1.8 2.1 1.8 2.2 1.8
www.ijorcs.org
7. Prediction of Atmospheric Pressure at Ground Level using Artificial Neural Network 17
After clustering technique the test result improves. Kmeans-MLP is shown in the following Figure 6a and
The result is quite good. The graphical representation Figure 6b.
of the comparative study of the MLP and hybrid
1025
1020 y = 1.165x - 165.3
1015 R² = 0.871
Target Output
1010
1005
1000 y = 1.265x - 265.6
995 R² = 0.853
990
985
990 995 1000 1005 1010 1015 1020 1025
Computed Output
Figure 6(a): Graphical representation of target and computed max. pressure.
1020
1015 y = 1.087x - 86.43
R² = 0.894
Target Output
1010
1005
1000
995 y = 1.242x - 242.9
990 R² = 0.880
985
990 995 1000 1005 1010 1015 1020
Computed Output
Figure 6(b): Graphical representation of target and computed min. pressure.
Figure 6(a) implies that the square of the measure in case of minimum pressure and 2.1 in case of
of goodness of fit R2 is 0.871 on the basis of the hybrid maximum pressure.
Kmeans-MLP. Similarly from Figure 6(b) it is found
So clustering can be used to improve the predicted
that the square of the measure of goodness of fit R2 is
result of a neural network based prediction system.
0. 894.
The accuracy level becomes high after incorporating
By comparative study, the predicted result of clustering technique.
maximum pressure and minimum pressure using
hybrid Kmeans-MLP is better than MLP, as the V. CONCLUSIONS
goodness of fit R2 in case of hybrid Kmeans-MLP is Artificial neural network model discussed here has
greater than the measure of goodness of fit R2 in case been developed to predict air pressure for a particular
of MLP. day based on the data of previous day. The
meteorological data of the year 1989-1995 were
A. Observation collected from Kolkata Meteorological center and used
If a comparative study is done between Table 1 and for study of the proposed model. Two alternative ANN
Table 2, then it is clearly visible that in Table 1, the models were tested to compute the output and this
efficiency level of the neural network system was low. computed output was compared with the target output
The average error from the Table 1 for nh =6 is found i.e. pressure. After testing these models, the following
to be 2.1 in case of minimum pressure and 2.8 in case conclusions are made.
of maximum pressure. Again using clustering, the i. Hybrid model of K-means and MLP turns out to be
predicted result becomes quite good as shown in Table an excellent tool that can predict the air pressure
2. The average error from the Table 2 for nh =6 is 1.8 accurately by overcoming the seasonality effect on
air pressure.
www.ijorcs.org
8. 18 Angshuman Ray, Sourav Mukhopadhyay, Bimal Datta, Srimanta Pal
ii. The neural network models proposed here can be [4] Pal N. R., Chintalapudi K., “A connectionist system for
feature selection”. Neural, Parallel and Scientific
good alternatives for traditional meteorological
Computations, vol.5, pp. 359-381, 2007.
approaches for weather forecasting.
[5] Pal N. R., Pal S., Das J., Majumdar, K., “SOFM-MLP:
In the future works, the combined use of Feature A hybrid neural network for atmospheric temperature
selection and hybrid Kmeans-MLP may result in an prediction”. IEEE Transactions on Geoscience and
excellent paradigm for prediction of air pressure. Remote Sening,. vol. 41, pp. 2783-2791. doi: doi:
Moreover, hybrid Kmeans-MLP set may be used for 10.1109/TGRS.2003.817225
prediction of other atmospheric parameters. [6] Paras, Sanjay Mathur, Avinash Kumar, and Mahesh
Chandra, “A Feature Based Neural Network Model for
VI. REFERENCES Weather Forecasting”. World Academy of Science,
Engineering and Technology, vol. 34, pp. 66-73, 2007.
[1] Dutta, B., Ray, A., Pal, S., Patranabis, D.C. 2009. “A
connectionist model for rainfall prediction”. Neural, [7] Raodknight C.M., Balls G.R., Mills G.E., Palmer-
Parallel and Scientific Computations, vol. 17, pp. 47-58. Brown D., “Modeling Complex Environmental Data”,
IEEE Transactions on Neural Networks, vol. 8, no. 4,
[2] Haykin S.,. “Neural Networks : A Comprehensive
pp. 852-861. 1997. doi: 10.1109/72.595883
Foundation, Second Edition” , Pearson Education,
2001. [8] Sarma D.K., Konwar M., Das J., Pal S. Sharma S., “A
soft computing approach for rainfall retrieval from the
[3] Kohonen, T., “The self-organizing map”. Proceedings
TRMM microwave imager”. IEEE Transactions on
of the IEEE, vol.78, no.9, pp. 1464-1480. doi: doi:
Geoscience and Remote Sensing, vol. 43, pp. 2879-
10.1109/5.58325
2885, December 2005. doi: 10.1109/TGRS.
2005.857910
How to cite
Angshuman Ray, Sourav Mukhopadhyay, Bimal Datta, Srimanta Pal, "Prediction of Atmospheric Pressure at Ground Level
using Artificial Neural Network". International Journal of Research in Computer Science, 3 (1): pp. 11-18, January 2013.
doi: 10.7815/ijorcs. 31.2013.056
www.ijorcs.org
![12 Angshuman Ray, Sourav Mukhopadhyay, Bimal Datta, Srimanta Pal
of the physical processes associated with pressure. The main objective of MLP learning is to set the
This approach is essentially a data driven approach. connection weights in such a way the error between
ANN emulates the parallel distributed processing of the network output and the target output is minimized.
the human nervous system and are parallel A typical MLP network is shown in Figure 2.
computational models, comprising closely According to [2] under a fairly general assumption a
interconnected adaptive processing units. The adaptive single hidden layer is sufficient for multilayer
nature of neural networks adopts artificial intelligence perceptron to compute an uniform approximation of a
(AI) learning techniques like supervised and given training set of input and output. So, the present
unsupervised learning. ANN model has already proved study is restricted to three-layer network i.e. one
to be very powerful in dealing with complex problems hidden layer.
like function approximation, pattern recognition and
has been applied for weather prediction, stock market
prediction etc.
A number of studies have been reported that have
used ANN to model complex nonlinear relation of
input and output for weather forecasting [6][7].
However, very few works have used ANN-based
connectionist methods to forecast air pressure. Again,
all of these works are restricted to feed forward ANN
models with back propagation and that uses either
linear or nonlinear time series data only.
This paper is an outcome of an ANN based air
pressure prediction model developed, trained and
tested with continuous (daily) ground level air pressure Figure 2: A typical MLP for air pressure prediction
data as input over a period of 7 years [1]. Here two
distinct alternative models, namely MLP and Hybrid B. Clustering
Kmeans-MLP have been studied and analyzed.
However, these 2 models, MLP and Hybrid Kmeans- Cluster analysis or clustering is the assignment of a
MLP were designed and tested separately with set of observations into subsets (called clusters) so that
different number of hidden nodes. The results observations in the same cluster are similar in some
produced by each of the models were compared and sense. It is used to operate on a large data-set to
the suitability of the models were justified. The model discover hidden pattern and relationship helps to make
has been applied to justify that ANN is an appropriate decision quickly and efficiently. Clustering is a
predictor for air pressure forecasting. The prediction is method of unsupervised learning, and a common
based on the past observations of several technique for statistical data analysis used in many
meteorological parameters like temperature, humidity, fields, including machine learning, data mining,
air pressure and vapor pressure. The data was collected pattern recognition, image analysis and bioinformatics.
daily by the meteorological department of Dumdum
Airport. 1. Implementation of K-Means Clustering Algorithm:
K-Means is one of the simplest unsupervised
II. ANN APPROACH learning algorithms used for clustering. K-means
In this section the basics of the 2 models as referred partitions n observations into k clusters in which each
in Section 1 are discussed. This theoretical basis of the observation belongs to one of the clusters whose centre
models has been applied during the design and is nearest.This algorithm aims at minimizing an
implementation of the same. objective function, in this case a squared error
function.
A. Multilayer Perceptron (MLP)
Initially we have only the raw data. So, it is
MLP is one of the most widely used neural network clustered around a single point. If the cluster number K
architectures. It consists of several layers of neurons of is fixed then we need to cluster around that point. If
which the first layer is known as the input layer, last the cluster is not fixed then it is continued until the
layer is known as the output layer and the remaining centered is not changed. Initially the whole data is in a
layers are called as hidden layer. Every node in the same group. But when K-means clustering is applied
hidden layers and the output layer computes the on it then it clusters the whole data into four major
weighted sum of its inputs and apply a sigmoidal categories.
activation function to compute its output, which is then
transmitted to the nodes of the next layer as input [3]. The following is the algorithm:
www.ijorcs.org](data:image/gif;base64,R0lGODlhAQABAIAAAAAAAP///yH5BAEAAAAALAAAAAABAAEAAAIBRAA7)