Extensive cash flow & credit experience going back to Yr concurrent w Undergrad then MBA
•
0 gefällt mir•69 views
Melden
Teilen
Melden
Teilen
Downloaden Sie, um offline zu lesen

Empfohlen
Empfohlen
Weitere ähnliche Inhalte
Ähnlich wie Extensive cash flow & credit experience going back to Yr concurrent w Undergrad then MBA
Ähnlich wie Extensive cash flow & credit experience going back to Yr concurrent w Undergrad then MBA (20)
Solutions Manual for Fundamentals Of Corporate Finance 2nd Edition by Berk
Solutions Manual for Fundamentals Of Corporate Finance 2nd Edition by Berk
CT 1 NOTES FOR ACTUARIAL SCIENCE BY SOURAV SIR'S CLASSES 9836793076
CT 1 NOTES FOR ACTUARIAL SCIENCE BY SOURAV SIR'S CLASSES 9836793076
The Time Value of Money Future Value and Present Value .docx
The Time Value of Money Future Value and Present Value .docx
Trend Analysis - Statement of Assets & Liabilities
Trend Analysis - Statement of Assets & Liabilities
Quiz #2This Quiz counts for 15 of the course grade. Make s.docx
Quiz #2This Quiz counts for 15 of the course grade. Make s.docx
7.12Chapter 7 Problem 12a). Complete the spreadsheet below by esti.docx
7.12Chapter 7 Problem 12a). Complete the spreadsheet below by esti.docx
CS225 Fundamentals of Computer ScienceCourse SyllabusFall 2013Dr.docx
CS225 Fundamentals of Computer ScienceCourse SyllabusFall 2013Dr.docx
Extensive cash flow & credit experience going back to Yr concurrent w Undergrad then MBA
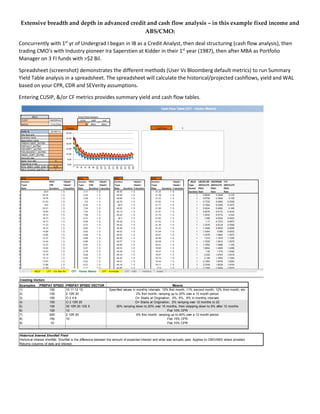
- 1. Extensive breadth and depth in advanced credit and cash flow analysis – in this example fixed income and ABS/CMO: Concurrently with 1st yr of Undergrad I began in IB as a Credit Analyst, then deal structuring (cash flow analysis), then trading CMO’s with Industry pioneer Ira Saperstien at Kidder in their 1st year (1987), then after MBA as Portfolio Manager on 3 FI funds with >$2 Bil. Spreadsheet (screenshot) demonstrates the different methods (User Vs Bloomberg default metrics) to run Summary Yield Table analysis in a spreadsheet. The spreadsheet will calculate the historical/projected cashflows, yield and WAL based on your CPR, CDR and SEVerity assumptions. Entering CUSIP, &/or CF metrics provides summary yield and cash flow tables. Creating Vectors Examples: PREPAY SPEED PREPAY SPEED VECTOR 1) 100 10 11 12 13 2) 100 2 12R 20 3) 100 O 2 4 6 4) 100 O 2 12R 20 5) 100 30 15R 20 12S 5 6) 100 10 7) 200 2 12R 20 8) 150 10 9) 10 Historical Interest Shortfall Field Historical interest shortfall. Shortfall is the difference between the amount of expected interest and what was actually paid. Applies to CMO/ABS where provided. Returns columns of date and interest. Flat 10% CPR 4% first month, ramping up to 40% over a 12 month period Flat 15% CPR Flat 10% CPR Means Specified values in monthly intervals: 10% first month, 11% second month, 12% third month, etc 2% first month, ramping up to 20% over a 12 month period O= Starts at Origination, 2%, 4%, 6% in monthly intervals O= Starts at Origination, 2% ramping over 12 months to 20 30% ramping down to 20% over 15 months, then stepping down to 5% after 12 months
- 2. …plus three more tabs in cash flow engine excel model.