SPATIOTEMPORAL VARIABILITY IN TREE GROWTH IN THE CENTRAL PYRENEES: CLIMATIC AND SITE INFLUENCES
1. Ecological Monographs, 73(2), 2003, pp. 241–257
2003 by the Ecological Society of America
SPATIOTEMPORAL VARIABILITY IN TREE GROWTH IN THE CENTRAL
PYRENEES: CLIMATIC AND SITE INFLUENCES
JACQUES TARDIF,1 JESUS JULIO CAMARERO, MONTSE RIBAS,
´ AND EMILIA GUTIERREZ
´
Universitat de Barcelona, Department d’Ecologia, Facultat Biologia, Diagonal 645, 08028 Barcelona, Catalunya, Spain
Abstract. To understand how tree growth has responded to recent climate warming,
an understanding of the tree–climate–site complex is necessary. To achieve this, radial
growth variability among 204 trees established before 1850 was studied in relation to both
climatic and site factors. Seventeen forest stands were sampled in the Spanish Central
Pyrenees. Three species were studied: Pinus uncinata, Abies alba, and Pinus sylvestris. For
each tree, a ring-width residual chronology was built. All trees cross-dated well, indicating
a common influence of the regional climate. For the 1952–1993 period, the radial growth
of all species, especially P. uncinata, was positively correlated with warm Novembers
during the year before ring formation and warm Mays of the year the annual ring formed.
Differences in species-stand elevation modulated the growth–climate associations. Radial
growth in P. uncinata at high elevation sites was reduced when May temperatures were
colder and May precipitation more abundant. In the 20th century, two contrasting periods
in radial growth were observed: one (1900–1949) with low frequency of narrow and wide
rings, low mean annual sensitivity, and low common growth variation; and another (1950–
1994) with the reverse characteristics. The increased variability in radial growth since the
1950s was observed for all species and sites, which suggests a climatic cause. The low
shared variance among tree chronologies during the first half of the 20th century may result
from a ‘‘relaxation’’ of the elevation gradient, allowing local site conditions to dominate
macroclimatic influence. These temporal trends may be related to the recently reported
increase of climatic variability and warmer conditions. This study emphasizes the need to
carefully assess the relationships between radial growth and site conditions along ecological
gradients to improve dendroclimatic reconstructions.
Key words: Abies alba; climate change; dendroecology; mean sensitivity; Pinus sylvestris; Pinus
uncinata; Principal Component Analysis (PCA); radial growth; Redundancy Analysis (RDA); response
function; site factors.
INTRODUCTION thermal amplitude. A mean warming of 1 C in the
Recent studies of worldwide meteorological data 1980s has been described in the Alps with a clear in-
from high elevation stations have shown that air tem- crease in the mean monthly minimum temperatures
(Beniston et al. 1997, Rolland et al. 1998).
perature has increased during this century for most ar-
A precise understanding of the climatic character-
eas (Diaz and Bradley 1997). This is consistent with
istics for mountain regions with complex topography
worldwide trends in surface temperature data (Folland
is, however, complicated by the lack of observational
et al. 1990, Jones 1994, Houghton et al. 1996). Diaz
data at a spatial and temporal resolution adequate for
and Bradley (1997) reported a strong warming trend climate research (Beniston et al. 1997). In mountain
for Western Europe starting in the 1940s and resulting regions, General Circulation Models have poor appli-
in the most recent decades being warmer than any other cability and resolution (Guisan et al. 1995). Climatic
period in the instrumental record. Temperature records studies in these remote areas must rely on proxy records
from the Pic du Midi in the Central Pyrenees registered of past climates because instrumental records are gen-
a mean annual temperature increase of 0.83 C between erally short (Beniston et al. 1997). In high elevation
1882 and 1970 (Bucher and Dessens 1991). The great-
¨ forests, climate constitutes the main limiting factor for
est warming was observed in the mean monthly min- tree growth (Tranquillini 1979, Hansen-Bristow 1986,
imum temperatures, whereas the mean monthly max- Grace and Norton 1990). High elevation forests are
imum temperatures decreased slightly during the same exceptional for the potential they offer for climate re-
period producing an overall decrease in the monthly construction and the assessment of the impact of cli-
mate change on ecosystems. Annual tree ring series
Manuscript received 27 June 2001; revised 14 March 2002; can provide high resolution proxy records to assess
accepted 1 April 2002; final version received 24 April 2002. Cor- environmental changes that have occurred over recent
responding Editor: S. T. Jackson.
1 Present address: Centre for Forest Interdisciplinary Re-
centuries (Luckman 1990, Villalba et al. 1994, 1997,
search (C-FIR), University of Winnipeg, 515 Avenue Portage, Tessier et al. 1997).
Winnipeg, Manitoba, Canada R3B 29E. In mountain environments, climatic conditions and
E-mail: j.tardif@uwinnipeg.ca growth characteristics are strongly influenced by ele-
241
2. 242 JACQUES TARDIF ET AL. Ecological Monographs
Vol. 73, No. 2
vation (Hansen-Bristow 1986, Kienast et al. 1987, Rol- Abies alba intermingles with P. uncinata in subalpine
land et al. 1999). However, local climate can be mod- forests (1600–2000 m). The understory of this com-
ified by site factors such as slope, aspect, and degree munity may contain montane (e.g., Sanguisorba minor
of exposure to wind even at the same elevation (Barry Scop. subsp minor) and typical subalpine species (Rho-
1992). A better understanding of the interactions be- dodendron ferrugineum L., Vaccinium myrtillus L.).
tween site conditions and climate is necessary to dis- Pinus sylvestris is dominant in the upper montane belt,
entangle the tree–climate–site complex (Hughes et al. above lower submediterranean oak forests. These for-
1978, Villalba et al. 1994, Tessier et al. 1997). The ests are in contact with the lower subalpine forests,
main objective of this study was to assess the influence mainly in S aspects (1200–1900 m). These xeric com-
of climate and site conditions on ring-width chronol- munities are developed on poor and unstable soils,
ogies from individual trees. To do so, a network of tree where pioneer species are usually found (e.g., Juni-
ring chronologies was developed for the National Park perus communis L.).
of Aiguestortes and Estany de Sant Maurici and its
¨
Pinus uncinata is a shade-intolerant tree species
buffer zone, the Spanish Central Pyrenees.
whose distribution in Spain is limited to the subalpine
Our first objective was to identify the principal cli-
forests of the Pyrenees (1600–2500 m) and to two iso-
matic factors influencing the radial growth of three
lated populations in the Iberian System (Ceballos and
dominant conifer species in the Central Pyrenees ( Pi-
Ruiz de la Torre 1979). This species constitutes the
nus uncinata Ram., Pinus sylvestris L., Abies alba
Mill.). Our second objective was to assess how the main component of the upper forest limits and tree lines
climate–growth associations of individual trees were in the Pyrenees (Cantegrel 1983, Gil Pelegrı n and Villar
´
influenced by variations in site factors. This would per- Perez 1988, Carreras et al. 1996). On acidic soils, this
´
mit a better understanding of the impact of future cli- forest type is characterized by shrubs and several sec-
matic change in spatially heterogeneous environments ondary tree species (Salix caprea L., Sorbus aucuparia
such as mountains. In the absence of long-term me- L., Betula spp.). On southern aspects and on acidic
teorological data for the region, our third objective was soils, xerophilous (J. communis subsp. alpina (Suter)
to document climatic stability at different time periods Celak) or acidophilous species (Festuca eskia Ram. ex
by quantifying the temporal stability of similarity in DC. in Lam. & DC.) are frequently observed in the
ring-width variation among tree chronologies. We hy- understory (Vigo and Bonada 1976, Vigo and Ninot
pothesized that similarity among chronologies should 1987, Carrillo and Ninot 1992). Previous studies re-
decrease under less limiting climatic conditions, where- vealed the presence of P. uncinata 600 years old at
as it should increase under less favorable climatic con- 2300–2400 m a.s.l. in this region (Creus 1991–1992,
ditions. Our final objective was to take advantage of Creus et al. 1992). Pinus uncinata intermingles with
the Pic du Midi meteorological data to assess how P. sylvestris at 1200–1900 m in areas of the Pyrenees
changes in monthly mean temperatures may have af- with continental climates, and intermingles with A.
fected radial growth of P. uncinata since the end of alba at 1000–2000 m in mesic sites (Ceballos and Ruiz
the 19th century. de la Torre 1979, Gomez Manzaneque 1997).
´
The macroclimate of the Pyrenees is strongly influ-
METHODS enced by its east-west alignment between the Medi-
Study area terranean Sea and the Atlantic Ocean (Del Barrio et al.
1990). The extreme western part of the region falls
The Aiguestortes and Estany de Sant Maurici Na-
¨
under the influence of the Atlantic and is characterized
tional Park (42 35 N, 00 57 E) is located in the Span-
by cyclonic precipitation and relatively small differ-
ish Central Pyrenees, western Catalan Pyrenees, Prov-
ences between summer and winter temperature. This
ince of Lleida (Fig. 1). The park, created in 1955, cov-
oceanic influence decreases eastward until the typical
ers an area of 14 119 ha. Most of the National Park
Mediterranean conditions prevail (e.g., warm and dry
is located on granites or granodiorites (Ventura 1992),
which form the main geological substrate in the Axial summer). The Central Pyrenees, distant from both bod-
Pyrenees. These bedrocks generate mainly acidic soils. ies of water, experience more continental conditions
The Spanish Pyrenees form a biogeographic strip in (Del Barrio et al. 1990). The climate of our study area
which eurosiberian species are dominant, in contrast is continental with some oceanic influence. Local me-
to the nearby Ebro Basin, where most species show teorological stations (Bonaigua, 10 km, 2263 m,
Mediterranean affinities. The altitudinal zonation of 42 40 N, 01 00 E; Estany Gento, 11 km, 2174 m,
vegetation in the Spanish Pyrenees is well established 42 30 N, 01 01 E) have recorded a mean annual tem-
(Vigo and Bonada 1976, Vigo and Ninot 1987, Carrillo perature of 3.0 C and a total annual precipitation of
and Ninot 1992). In the montane altitudinal belt, A. 1200 mm (Plana 1985, Allue 1990). At Bonaigua,
´
alba forms mesic forests accompanied by Fagus syl- the warmest and the coldest months were July (mean
vatica L. These are especially well developed on slopes of 11 C) and January (mean of 3.3 C), respectively.
with an N–NW aspect (1000–1600 m above sea level). The prevailing wind direction is from the W–NW.
3. May 2003 SPATIOTEMPORAL VARIABILITY IN GROWTH 243
FIG. 1. Topographic map of the Aiguestortes i Estany de Sant Maurici National Park (larger map: area delineated by the
¨
thick line) and its approximate location in the Spanish Pyrenees (smaller figure: black areas correspond to the distribution
of Pinus uncinata on the Iberian Peninsula) showing the location of sampled stands. Chronology codes are as in Table 1.
The elevation interval between contour lines is 200 m. The Sant Maurici lake is shown with gray fill near SM site.
Data collection evation, P. uncinata was usually characterized by
Seventeen forest stands were sampled at different smaller stature and a loss of apical dominance. In con-
elevations and locations within the National Park. trast, trees of P. uncinata, P. sylvestris, and A. alba at
Three species were studied: P. sylvestris (1 site), A. lower elevation possessed a conical form and grew in
alba (4 sites), and P. uncinata (12 sites). The sampling denser forests. Abies alba occupied some of the lowest
was conducted to find old forest stands lacking evi- elevations and more mesic sites (North aspect). These
dence of disturbance such as logging, insect outbreaks, trees were amongst the tallest and the fastest growing.
or large-scale blowdown. For each stand, 1 to 3 cores
Data analysis
were taken from 10 or more dominant trees (except for
Serrader site, P. uncinata, code A1 in Table 1) at 1.3 For each site, the cores were prepared following the
m using an increment borer. For some trees, only one standard dendrochronological techniques (Stokes and
core was taken due to heart rot. For each tree, size Smiley 1968). All samples were dated and visually
(height and diameter at 1.3 m), vital status, topographic cross-dated to detect the presence of either false or
position, edaphic characteristics, and nearby floristic incomplete rings, which were only rarely encountered.
composition were recorded. After cross-dating, all cores were measured to a pre-
The geographical and ecological characteristics of cision of 0.01 mm using the Aniol–CATRAS measuring
the 17 stands are presented in Table 1. All stands were system (Aniol 1983). Cross-dating was further vali-
located between 1600 and 2370 m a.s.l. Those of P. dated using the program COFECHA, which calculates
uncinata grew on high elevation sites that were char- cross correlations between individual series and a ref-
acterized by well-drained, sparse soil. At a higher el- erence chronology (Holmes 1983). Series showing por-
4. 244 JACQUES TARDIF ET AL. Ecological Monographs
Vol. 73, No. 2
TABLE 1. Ecological characteristics for each of the sampled sites.
Age at
coring
Site N Code Species† Latitude Longitude Aspect Elevation (m) Slope ( ) height (yr)
Serrader 11 A1 Ps 42 33 N 0 54 E S–SE 1874 66 27 12 233 34
Conangles 14 CO Aa 42 38 N 0 45 E N–NW 1707 79 26 5 259 40
Mulleres 12 MU Aa 42 38 N 0 44 E N–NE 1763 88 34 13 256 67
Mata Valencia
` 9 MV2 Aa 42 38 N 1 04 E N–NE 1766 10 12 5 220 21
Mata Valencia
` 4 MV1 Aa 42 38 N 1 04 E N–NE 2008 48 20 5 208 32
Sant Maurici 19 SM Pu 42 35 N 1 00 E S–SE 1933 5 16 15 173 11
Serrader 1 A1 Pu 42 33 N 0 54 E E–SE 1970 0 30 0 188 0
Mata Valencia
` 5 MV1 Pu 42 38 N 1 04 E N–NW 2019 7 19 10 221 70
Emb. Lladres 10 LA Pu 42 33 N 1 04 E N–NW 2076 17 36 21 392 129
Conangles 17 CO Pu 42 38 N 0 45 E S–SW 2106 180 43 15 324 96
Barranc de Llacs 35 LL Pu 42 43 N 0 55 E N–NW 2120 65 44 30 466 192
El Mirador 6 A5 Pu 42 35 N 0 59 E N–NE 2187 45 43 38 414 128
Delluı-Cortiselles
´ 19 A2 Pu 42 34 N 0 57 E W–NW 2208 82 24 18 451 82
Tesso de Son
´ 15 TE Pu 42 36 N 1 03 E N–NE 2239 115 42 14 225 43
Ratera 5 RA Pu 42 35 N 1 00 E N 2300 0 40 0 290 93
Amitges 12 A3 Pu 42 36 N 0 59 E S–SE 2333 23 32 18 255 61
Estany Negre 10 EN Pu 42 32 N 1 03 E N–NE 2360 9 31 39 261 60
Notes: The data in columns 7–14 represent the means 1 SD from trees sampled at each site. The code for each site is
the same as in Fig. 1.
† Tree species abbreviations are as follows: Ps Pinus sylvestris; Aa Abies alba; Pu Pinus uncinata.
‡ The annual sensitivity constitutes the relative difference from one ring-width index to the next and is calculated by
dividing the absolute value of the differences between each pair of ring-width indices by the mean of the paired index (Fritts
1976).
tions of abnormal growth or low correlation with the tree chronologies were autoregressively modeled using
reference chronology were either truncated or discard- the FMT program from the Dendrochronology Program
ed to minimize the effect of atypical tree ring series Library (Holmes 1992). A total of 204 tree residual
on the final chronology. For instance, all series showing chronologies was developed following this procedure.
strong growth–release effects were split and separately
detrended (Blasing et al. 1983). Statistical analyses
A chronology was produced for each selected tree Radial growth–climate association.—In dendroe-
since our main objective was to analyze the spatiotem- cology, the relationships between tree ring indices and
poral variability of radial growth among trees. Only climate variables are usually calculated in the form of
trees established before 1850 were used to maximize a correlation or a response function (Fritts 1976, Cook
the longest time period and the greatest number of trees and Kairiukstis 1990). The relationships among indi-
in the sample. This gave 204 trees (154 P. uncinata, vidual tree ring chronologies and climate factors were
39 A. alba, and 11 P. sylvestris). Each ring-width series assessed using redundancy analysis (RDA), which is
was standardized using a spline function with a 50% the direct extension of multiple regression applied to
frequency response of 32 years (Cook and Peters 1981). multivariate data. RDA, the canonical form of principal
Standardization involved transforming the ring-width component analysis (PCA), is a multivariate ‘‘direct’’
value into a dimensionless index by dividing the ob- gradient analysis intended to display the main trends
served ring-width values by the expected values given in variation of a multidimensional data set in a reduced
by the spline function (Fritts 1976), which retained high space of few and linearly independent dimensions (Le-
frequency growth variation and filtered out medium to gendre and Legendre 1998). In RDA, the ordination
low frequency trends. axes are constrained to be linear combinations of sup-
We used program ARSTAN (Cook 1985) to stan- plied environmental variables (ter Braak and Prentice
dardize all tree ring series. The tree summaries (chro- 1988, ter Braak 1994, ter Braak and Smilauer 1998).
nologies) option was selected in ARSTAN. The pro- Redundancy analysis is effective in quantifying the
gram uses an arithmetic mean to average the standard- relationship between tree ring indices and climatic fac-
ized series from the same tree and produces a tree chro- tors (Beeckman 1992). The decision to use RDA over
nology. Most tree chronologies were constructed from other canonical methods like canonical correspondence
two measured radii and, in very few cases, from only analysis (CCA) was justified because CCA is inappro-
one or more than two measured series. Autoregressive priate for extremely short gradients (Legendre and Le-
modeling was performed on each tree chronology to gendre 1998, ter Braak and Smilauer 1998). The good
remove temporal autocorrelation and make each ob- cross-dating among trees, sites, and species indicated
servation independent, a condition necessary for most that the common macroclimatic signal was coherent
statistical analyses (Legendre and Legendre 1998). All for all chronologies over the study area.
5. May 2003 SPATIOTEMPORAL VARIABILITY IN GROWTH 245
TABLE 1. Extended In these analyses, years were considered as samples
(sites) and each tree as a descriptor (species) (Mode
Diameter
at breast Mean radial Mean Q; see Legendre and Legendre 1998). In RDAs, sig-
Height (m) height (cm) growth (mm) sensitivity‡ nificant climatic variables (P 0.05) were selected
10.6 4.4 65.8 22.4 1.01 0.56 0.26 0.03 after a forward selection using a Monte Carlo per-
21.7 5.0 91.2 29.5 1.11 0.40 0.15 0.02 mutation test based on 999 random permutations (Man-
17.4 2.1 76.1 23.6 1.26 0.52 0.16 0.02 ly 1998). All ordination analyses were computed using
21.1 2.6 60.0 7.5 1.04 0.21 0.14 0.02 the program CANOCO (Version 4.0) and scaling of
20.5 1.9 63.7 5.9 1.00 0.35 0.16 0.02
13.6 1.7 38.1 5.7 0.76 0.20 0.21 0.04 ordination scores was done using a correlation biplot
12.0 0 73.0 0 1.17 0 0.23 0 (ter Braak 1987, 1994). Both Pearson’s correlation and
11.7 3.2 43.8 2.2 0.89 0.25 0.22 0.03 bootstrap response functions were calculated with the
9.5 3.0 54.3 8.7 0.53 0.22 0.16 0.03
7.8 3.4 62.3 13.5 0.75 0.32 0.18 0.03 program PRECON (Version 5.16) (Fritts et al. 1991).
10.4 2.3 75.0 20.1 0.73 0.34 0.17 0.02 Radial growth–climate association–site factors.—
11.0 2.2 73.3 31.3 0.57 0.29 0.18 0.04 We again used RDA to study the relationships between
10.8 3.7 86.3 27.6 0.59 0.20 0.16 0.03
11.0 2.5 67.7 18.6 1.00 0.44 0.16 0.03 the growth–climate association for each tree and site
9.0 2.0 47.1 11.5 0.70 0.24 0.17 0.02 factors. First, Pearson’s correlations that were calcu-
11.8 4.08 85.1 22.9 0.97 0.42 0.17 0.03 lated between the 204 tree residual chronology and the
8.9 2.3 66.1 13.6 0.94 0.43 0.17 0.02 climatic variables (see Methods: Statistical Analyses)
were screened and all significant coefficients ( P 0.1)
were retained and transformed to absolute values.
Two RDAs were calculated using the following com- When inverse correlation signs were observed for the
bination of chronologies: (a) three species (204 trees) same variable (e.g., June precipitation), the variable
and (b) P. uncinata (154 trees). All RDAs were com- was duplicated (e.g., June precipitation negative effect
puted for the reference period 1952–1993, which cor- and June precipitation positive effect). Only correla-
responded to the period of meteorological data. Due to tions with monthly variables having an occurrence of
the absence of nearby stations with complete long-term at least 6 out of the potential 204 were kept in the RDA
records, data from four nearby meteorological stations to limit the influence of rare events. Second, an envi-
were combined for the period 1952–1993 (Table 2). ronmental matrix was constructed using both abiotic
These stations are located between 940 m and 1880 m and biotic site factors that were assumed to influence
a.s.l., elevations lower than our sampling sites, but they the radial growth–climate association of each tree. In
represent the best data available for this portion of the this matrix, all classes of the qualitative environmental
Spanish Central Pyrenees. We used the program MET variables were transformed into dummy binary vari-
from the Dendrochronology Program Library (Holmes ables as recommended by ter Braak (1987). The site
1992) to estimate the missing data for each station (Ta- factors were the following: aspect (4 qualitative vari-
ble 2) and to combine them. Monthly variables for each ables), elevation (m), slope ( ), site (17 qualitative var-
station were transformed into normalized standard de- iables), open-closed canopy forest (1 qualitative class),
viations to give each station the same weight in cal- tree height (m), tree diameter at breast height (cm), and
culating the mean values for each month and year. For tree age (yr). A hierarchical classification analysis was
all analyses, mean monthly temperature and total calculated with program TWINSPAN (Hill 1979) using
monthly precipitation from May of the year before ring a presence–absence matrix of the dominant tree and
formation (t 1) to October of the year the annual understory species to characterize the vegetation type.
ring formed (t) were used. This period was determined Seven community types (7 qualitative variables) were
following observations made by Camarero et al. (1998) defined: Type 1 (n 12): P. sylvestris, Quercus faginea
on the seasonal development of xylem cells in P. un- L., and J. communis; Type 2 (n 13): A. alba, Betula
cinata and P. sylvestris. spp., F. sylvatica, S. aucuparia, and S. aria (L.) Crantz;
Pearson’s correlation and bootstrap response func- Type 3 (n 19): A. alba, Betula spp., P. uncinata, and
tions were calculated using the same climatic data and mosses; Type 4 (n 28): P. uncinata, R. ferrugineum,
the PCA scores calculated for the two subsets of chro- V. myrtillus, J. communis, F. eskia, and Erica tetralix
nologies (204 and 154 trees) to compare the RDA re- L.; Type 5 (n 46): P. uncinata, R. ferrugineum, A.
sults with standard methods in dendroecology. Com- alba, V. myrtillus, Betula spp., S. minor, S. aucuparia,
pared to a correlation function, a response function and S. aria; Type 6 (n 41): P. uncinata, R. ferru-
constitutes a form of multiple regression in which the gineum, and V. myrtillus; Type 7 (n 45): P. uncinata,
predictor variables are principal components of the and R. ferrugineum.
monthly climatic variables. All RDAs and PCAs were Two RDAs were again calculated using a covariance
calculated from a covariance matrix since our descrip- matrix and the same subset of trees: (a) 204 trees and
tors (tree ring chronologies) were of the same kind, (b) 154 P. uncinata. Significant environmental vari-
shared the same order of magnitude, and were mea- ables (P 0.05) were selected after a forward selection
sured in the same units (Legendre and Legendre 1998). using a Monte Carlo permutation test based on 999
6. 246 JACQUES TARDIF ET AL. Ecological Monographs
Vol. 73, No. 2
TABLE 2. Characteristics of the meteorological stations used to compute regional climate for the National Park of Aiguestortes
¨
i Estany de Sant Maurici.
Years for Mean annual Missing
Elevation Distance precipitation precipitation values
Station Longitude Latitude (m a.s.l.) (km)† data (mm) (%)‡
Vielha 00 48 E 42 42 N 940 18 1907–1935 ··· 6.0
1945–1993 987 2.2
Arties 00 52 E 42 42 N 1185 15 1952–1991 929 10.0
Capdella 00 59 E 42 28 N 1270 13 1954–1994 1202 0.6
Tredos
´ 00 57 E 42 41 N 1880 11 1968–1987 862 23.3
Pic du Midi 00 09 E 43 04 N 2862 85 1882–1922 ··· 0.0
1923–1936 ··· 0.0
1937–1984 990 9.9
Note: Both mean annual temperature and total precipitation for the reference period 1981–1990 are presented.
† Distance from the meteorological station to the sampling sites.
‡ For an explanation of the handling of missing values see Methods: Statistical analyses.
random permutations. In this analysis, trees were re- were reported to be homogeneous for the period 1882–
garded as samples (sites) and each monthly correlation 1970, but the station was moved to a new building after
coefficient as a descriptor (species) (Mode R; see Le- 1970 (Bucher and Dessens 1991). The monthly mean
¨
gendre and Legendre 1998). We displayed the equilib- temperature data from Pic du Midi were found to be
rium circle of descriptors in the RDA biplot. Those highly correlated with those of the four meteorological
descriptors located outside the circle account for more stations previously used (Arties: mean r 0.88, min-
of the explained variation than those located inside the imum r 0.75 and maximum r 0.96, n 12; Cap-
circle (Legendre and Legendre 1998). della: mean r 0.85, minimum r 0.73 and maximum
Temporal similarity in radial growth.—To evaluate r 0.93, n 12; Tredos: mean r
` 0.87, minimum r
the temporal stability of the shared variance among tree 0.74 and maximum r 0.92, n 12; Vielha: mean
ring chronologies, we have calculated PCAs for dif- r 0.85, minimum r 0.59 and maximum r 0.90,
ferent periods. We chose 50-yr intervals starting in the n 12). The precipitation data from the Pic du Midi
year 1850 and onward lagged them by 10 yr (i.e., 1850– station were also found to be homogenous for the pe-
1899, 1860–1909, . . . 1940–1989, and 1945–1994). riods 1882–1922, 1923–1936, and 1937–1984 (Dessens
The variance explained by the first principal component and Bucher 1997). However, they correlated weakly
¨
(PC 1) was used as an indicator of the similarity among with those of the Spanish stations and were not used.
the chronologies. As in previous ordination analyses, The low correlation might be explained by the high
the data matrix consisted of each tree chronology in a elevation of this station and the great spatial variability
Mode Q analysis (Legendre and Legendre 1998). of rainfall in mountainous areas (Barry 1992).
For the period 1850–1994 and for each of the 204 We have calculated new regional mean monthly tem-
tree residual chronologies, years with extreme values perature series to benefit from the potential offered by
( 1.5 SD) were identified and the annual sensitivity the Pic du Midi data. We used data from the four me-
was also calculated. The annual sensitivity constitutes teorological stations displayed in Table 2, and Pic du
the relative difference from one ring-width index to the Midi, which were divided in two homogeneous periods
next and is calculated by dividing the absolute value (e.g., both pre-1970 and post-1970 temperature data).
of the differences between each pair of ring-width in- We calculated Pearson’s correlations using the first two
dices by the mean of the paired index (Fritts 1976). principal components from the eight PCAs previously
The frequency of trees showing extremely low ( 1.5 calculated starting with the period 1880–1929 to assess
SD ) or high ( 1.5 SD ) indices and the temporal evo- the stability of the radial growth–climate association.
lution of annual sensitivity will reveal periods of lower Only P. uncinata chronologies were used in this anal-
or higher climatic influence through the last 150 ysis.
years. A similar methodology has been employed for
extreme climatic values (temperature, precipitation) re- RESULTS
constructed using tree ring widths (Manrique and Fer-
Radial growth–climate association: three species
nandez-Cancio 2000).
´
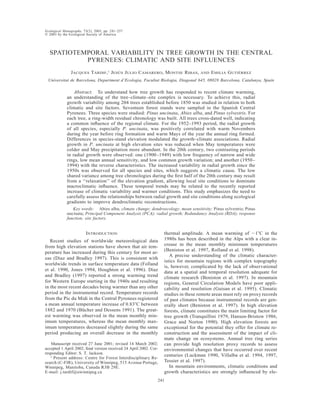
Temporal stability of the radial growth–climate as- The first three axes of the RDA for the period 1952–
sociation.—We used the data from the Pic du Midi 1993 expressed 25.06%, 4.32%, and 2.56% of the total
meteorological station (Table 2) to analyze the temporal variance, respectively. Unless mentioned, only the re-
stability of the radial growth–climate association. This sults from the first two axes are presented. All 204 trees
station has operated since 1882 and data recording was had a positive loading on Axis 1 (Fig. 2A) indicating
only interrupted during the Second World War and from that all trees were affected in a similar way by the
1985 to 1993. The temperature data at Pic du Midi regional climate. In general, chronologies of P. uncin-
7. May 2003 SPATIOTEMPORAL VARIABILITY IN GROWTH 247
TABLE 2. Extended.
Years for Mean annual Missing
temperature temperature values
data ( C) (%)
··· ··· ···
1951–1993 9.5 5.6
1960–1991 8.4 11.2
1954–1992 8.8 0.2
1968–1987 5.0 23.8
1882–1970 ··· 0.0
1971–1984 3.7 0.6
··· ··· ···
ata had a higher loading on Axis 1 than that of the
other species. November temperature of the year before
ring formation (t 1), December precipitation (t 1),
and May temperature of the year the annual ring formed
(t) were all positively and strongly correlated with Axis
1 (Fig. 2B). Temperatures in September (t 1) and
precipitation in September (t) were negatively corre-
lated with Axis 1. Together these variables were re-
sponsible for the wider ring-width indices observed in
1953, 1964, 1969, 1982, 1985, and 1990 and the nar-
rower ones observed in 1957, 1963, 1965, 1975, 1984, FIG. 2. Redundancy analysis (RDA) calculated from 204
1986, and 1991 (data not presented, but narrow and residual chronologies for the period 1952–1993. (A) Species
wide ring-width indices can be observed in Fig. 8). (tree chronology) scores and (B) significant environmental
variable (climatic factor) scores. T Temperature; P Pre-
The contrasting radial growth–climate association of cipitation; month is represented by a number (e.g., 6 June);
the three species was emphasized by the lower scores p year before ring formation (year t 1). Note: in RDA
of A. alba and P. sylvestris on RDA Axis 1. Their biplots, the correlation between biotic and abiotic variables
position on the second RDA axis provided further in- is given by the cosine of the angle between two vectors (ar-
rows). Vectors pointing in roughly the same direction indicate
formation on the growth variations among these species a high positive correlation, vectors crossing at right angles
(Fig. 2A). This axis mainly separated P. sylvestris. The correspond to a near zero correlation, and vectors pointing
main climatic variables correlated to Axis 2 were Sep- in opposite directions show a high negative correlation (ter
tember (t 1) and June (t) precipitation, both with Braak and Prentice 1988). Environmental variables with long
negative correlation to the axis (Fig. 2B). vectors are the most important in the analysis. The vectors
(arrows) were not drawn in Fig. 2A for visual clarity. The
As a comparison, the climate influence on radial use of the vector’s apices is thus only recommended for visual
growth was also investigated using Pearson’s correla- comparison (ter Braak and Verdonschot 1995, Legendre and
tion and bootstrap response functions calculated be- Legendre 1998).
tween PCA scores and the regional climatic data (Fig.
3). Overall, the results obtained were consistent with
those from the RDA (Fig. 3A, B). On PCA Axis 1, tree showed a common pattern for all chronologies (Fig.
scores were positively correlated with November (t 4A). The correlations with climatic variables were sim-
1) and May (t) temperature, and negatively with Sep- ilar to those of the previous RDA except that September
tember (t 1) temperature (Fig. 3A). On Axis 2, May (t 1) temperature was no longer significant (Fig. 4B).
(t 1) precipitation showed a positive association, The variables that were highly correlated with Axis 1
whereas an inverted one was observed for June (t) pre- were December (t 1) precipitation, November (t
cipitation (Fig. 3B). In addition, the bootstrap response 1) temperature, May (t) temperature, and September (t)
function revealed a positive association with July (t) precipitation. On Axis 2, trees of P. uncinata growing
temperature and a negative one with April (t) precip- at lower elevation (site Sant Maurici) were separated.
itation. The main variable positively correlated with this axis
was June (t) temperature, whereas June ( t) precipitation
Radial growth–climate association: P. uncinata only had the inverse sign (Fig. 4B). Comparison of these
A second RDA was calculated after eliminating both results with those from both the correlation and the
A. alba and P. sylvestris to discern the growth pattern bootstrap response functions again revealed similar
of P. uncinata (Fig. 4). The first three axes accounted trends (Fig. 3C, D). A positive relationship with both
for 30.08%, 2.85%, and 2.12% of the total variance. November (t 1) and May (t) temperature was ob-
Again, the scores on Axis 1 were all positive and served with tree scores on PCA Axis 1 (Fig. 3C). On
8. 248 JACQUES TARDIF ET AL. Ecological Monographs
Vol. 73, No. 2
FIG. 3. Correlation and bootstrapped response functions calculated between the sample (year) scores on Axis 1 and Axis
2 derived from PCA and the regional climatic variables. The left graphs (A and B) refer to the calculation using the 204
tree residual chronologies and Axis 1 and Axis 2, respectively. The right graphs (C and D) refer to the PCA using the 154
Pinus uncinata and Axis 1 and Axis 2, respectively. The significance level of the correlations (P 0.05) is indicated by the
dotted lines, and significant bootstrapped factors (P 0.05) are indicated by filled bars.
Axis 2, a negative correlation with June precipitation elevation was the higher importance of warmer October
(t) and a positive one of July ( t) were observed (Fig. (t 1), May (t), and August (t), and dryer May (t) for
3D). the latter (Fig. 5).
The first RDA computed using the correlations pre-
Influence of site factors sented in Fig. 5 (see Methods: Statistical Analyses)
The Pearson’s correlation calculated between the 204 showed that the three species occupied different areas
tree chronologies and the climatic data are summarized in the species–environment biplot and that elevation
in Fig. 5. This figure highlights the dominant influence was the dominant factor correlated with Axis 1 (data
of temperature on radial growth. The main factors pos- not presented). Because of the particular radial growth–
itively associated with radial growth were November climate association presented by P. sylvestris and A.
(t 1) temperature and May ( t) temperature (Fig. 5A). alba (Fig. 5), a second RDA using only the 154 P.
The strongest negative association with tree ring in- uncinata was calculated (Fig. 6). Again, the RDA spe-
dices were observed with both August and September cies–environment biplot illustrates how the radial
(t 1) temperature (Fig. 5A). Among the three species, growth–climate association in P. uncinata is influenced
P. sylvestris was more frequently and positively as- by elevation. Warm and dry Mays (t) were more strong-
sociated with warm April (t) temperature (Fig. 5A) and ly associated with high elevation trees (Fig. 6). For
abundant June–July (t) precipitation (Fig. 5B). Novem- trees showing a significant correlation with May (t)
ber (t 1) temperature was the only variable positively temperature, the strength of the coefficient also in-
correlated to 50% of the A. alba. More variability creased significantly with elevation (r 0.47, P
among trees was observed for A. alba as indicated by 0.05, n 93). In contrast, high temperature in August
numerous climatic variables having a low frequency of and September (t 1) were more detrimental to low
significant correlation (Fig. 5). For P. uncinata, the elevation trees. This analysis also shows that a portion
main difference between trees growing at low or high of the variance was attributed to site specific conditions
9. May 2003 SPATIOTEMPORAL VARIABILITY IN GROWTH 249
1900 to 1950 showed less extreme tree rings indices
in all chronologies. Both A. alba and high elevation P.
uncinata showed a sharp decrease in the frequency of
narrow and wide tree rings during this period (Fig. 8B,
D). This phenomenon was confirmed by annual sen-
sitivity values, which showed a sustained rise starting
in the 1950s for all species (Fig. 9). Year-to-year
change in radial growth indices in P. uncinata has in-
creased since the 1950s and reached the maximum for
the last 150 years (Fig. 9C, D).
In relation to the pattern encountered in the second
half of the 20th century (higher shared variance, higher
occurrence of extreme years, and higher sensitivity),
our results indicated that the radial growth–climate as-
sociation of P. uncinata varied across time (Fig. 10).
From the period 1880–1929 to 1910–1959, few climate
variables were correlated with PCA Axis 1 (Fig. 10).
These periods coincided with low shared variation
among trees (Figs. 7–9). A negative correlation with
warm August–September (t 1) started in the 1920s,
whereas the positive effect of warm October–Novem-
ber (t 1) started in the 1930s. The positive correlation
with May (t) temperature was initiated in the 1940s.
The correlations between the tree scores on Axis 1 and
FIG. 4. Redundancy analysis (RDA) calculated from 154
residual chronologies of Pinus uncinata for the period 1952– the environmental variables revealed that elevation was
1993. (A) Species (tree chronology) scores and (B) significant
environmental variable (climatic factor) scores. T Tem-
perature; P Precipitation; month is represented by a number
(e.g., 6 June), p year before ring formation (year t
1). See caption for Fig. 2.
as indicated by the positions of the site labels in the
biplot (Fig. 6B).
Temporal stability of the radial
growth–climate association
The results from the PCAs calculated on 50-yr pe-
riods lagged by 10 yr indicated that the percentage of
variance extracted by the first principal component was
not constant through time (Fig. 7A, B). The variance
held in common was high during the period 1850–
1899, it dropped to a minimum during the period cen-
tered around 1890–1939, and then rose to its maximum
value during the 1945–1994 period. The low percent-
age of variance expressed by PC 1 during the period
1900–1950 indicated less shared variation in tree ring
indices (i.e., each tree followed a more distinctive
growth pattern). This decrease was more pronounced
for P. uncinata (Fig. 7B). The sum of squares for each
PCA also showed the same trend as PC 1 SS on Fig.
7). It reached a maximum in the last 50 yr indicating
that ring-width indices are deviating more from the
mean.
Since the 1950s, both narrow and wide tree rings FIG. 5. Relative frequency of trees presenting significant
(P 0.1) Pearson’s correlation coefficients with mean month-
were more frequently registered by the three tree spe- ly climatic variables: (A) temperature; (B) precipitation. Rel-
cies (Fig. 8A–D) and especially by high elevation P. ative frequencies of both positive and negative correlation
uncinata (Fig. 8D). In comparison, the period from coefficients are indicated.
10. 250 JACQUES TARDIF ET AL. Ecological Monographs
Vol. 73, No. 2
1880–1929 to 1900–1949 was positively correlated
with growth differences between low and high eleva-
tion trees (Fig. 10). The negative correlation with Oc-
tober (t 1) was observed in all periods but showed
a decrease in the later decades. This decrease, however,
coincided with increasing correlations with Axis 1 (Fig.
10). Since the beginning of the 20th century, the cor-
relation of July (t) temperature with tree scores on Axis
2 has increased.
DISCUSSION
Radial growth–climate association
Our analyses showed that radial growth of Abies
alba, Pinus sylvestris (one site sampled), and Pinus
uncinata from the Central Pyrenees was influenced by
the regional climate. For the period 1952–1993, all
species growth was negatively associated with warm
September (t 1) and positively associated with both
warm November (t 1) and May (t) temperatures. For
both P. uncinata (Gutierrez 1991, Rolland et al. 1995,
´
Petitcolas and Rolland 1998, Rolland and Schueller
1998) and A. alba (Rolland 1993, Rolland et al. 1999),
it has been reported that the weather conditions during
the growing season before ring formation (t 1) had
a stronger influence on radial growth than during the
year the annual ring formed (t). Pinus sylvestris was
FIG. 6. Redundancy analysis (RDA) calculated using the the exception to this pattern (Richter 1988).
Pearson’s correlation coefficients matrix (154 Pinus uncinata) Radial growth in P. sylvestris was positively corre-
and the environmental data. (A) Species scores (significant lated with April (t) temperature, which could indicate
correlation with climatic variables). The equilibrium circle of a benefit of having an earlier onset of growing season
the descriptors is displayed. T Temperature; P Precip-
itation; month is represented by a number (e.g., 6 June); (Richter 1988, Richter and Eckstein 1990). Compared
p year before ring formation (year t 1); and or to the other species, P. sylvestris may also be more
indicate the sign of the correlation coefficient. (B) Environ- susceptible to deficits in the water balance during the
mental factor scores. The significant factors after 999 Monte year the annual ring formed (t). This was suggested by
Carlo iterations were the RA, SM, A2, A5, EN, TE, and CO the positive relationship with June–July precipitation
sites (see Table 1) and the following variables: ELE ele-
vation, CLO closed canopy, and DBH tree diameter at and the negative one with July temperature. In our
breast height. The scores of vegetation clusters (v1, v3, v5, study, the lowest sites were occupied by A. alba. Radial
v6, and v7) and aspect (north, east, south, and west) were not growth in this species was better when cool and humid
significant and were made passive in the RDA. The vectors conditions characterized the summer before ring for-
are thus not shown for these variables. Interpretation of this
figure follows Fig. 2. For example, the vectors for species mation (Rolland 1993, Rolland et al. 1999). Abies alba
T8 and environmental factor CO are pointing in the same growth was also negatively associated with warm Oc-
direction and the cosine of the angle between the two vectors tober temperature in the year before ring formation.
indicates a positive correlation between the variables. In other The importance for this species of the water balance
words, trees growing at site CO present a higher correlation in the prior growing season has been observed in both
coefficient with August temperature (positive effect).
short-term ecophysiological (Guelh and Aussenac
1987) and long-term dendroclimatological studies
not significantly related to tree scores during the 1910– (Rolland 1993).
1959 to 1930–1979 periods (data not presented). In P. uncinata, temperature was the main factor re-
In contrast, tree scores on Axis 2 were clearly related lated to radial growth. Warm Novembers in the year
to elevation. For all periods, elevation was significantly before ring formation and warm Mays during the year
correlated with tree scores at a P value of 0.0001. The of ring formation dominated the growth–climate as-
correlation with elevation also slightly increased with sociation. Rolland and Schueller (1994) attributed the
time (1850: r 0.46, 1860: r 0.45, 1870: r 0.48, positive impact of May temperature to maximum tem-
1880: r 0.60, 1890: r 0.61, 1900: 0.57, 1910: r perature. Our data showed, however, that both mini-
0.60, 1920: r 0.57, 1930: r 0.55, 1940: r mum and maximum May temperatures from Pic du
0.50 and 1945: r 0.51). The correlation with Axis Midi were correlated with radial growth of P. uncinata
2 indicated that February (t) temperature in the periods (data not presented). An earlier growth resumption
11. May 2003 SPATIOTEMPORAL VARIABILITY IN GROWTH 251
FIG. 7. Principal component analysis (PCA) calculated for periods of 50 yr starting in year 1850 and onward, lagged by
10 yr. (A) Three species (204 trees) and (B) Pinus uncinata. SS total sum of the squares of the species data.
could be associated with warmer Mays. In the Central tivation of evergreen conifers is triggered by a rise in
Pyrenees, both P. uncinata and P. sylvestris may begin temperature (Tranquillini 1979, Oribe and Kubo 1997).
radial growth near the end of May (Camarero et al. It is also well established that the ability of trees to
1998). grow in high elevation sites is related to the length of
In the Pyrenees, the dominant effect of temperature the growing season (Tranquillini 1979). Hansen-Bris-
over precipitation has also been reported in many stud- tow (1986) demonstrated that both air and soil tem-
ies (Creus and Puigdefabregas 1976, Genova 1986,
´ ´ peratures were important factors triggering bud flush
Ruiz-Flano 1988, Rolland and Schueller 1994, 1998).
˜ in conifer species growing at the timberline. It has also
This contrasts with results from the French Alps, where been suggested that soil temperature could be the main
August–September precipitation in the year before ring factor controlling the altitudinal limit of the arborescent
formation was positively related to radial growth (Rol- growth form (Korner 1998). A prolongation of the
¨
land and Schueller 1996). Our results suggested that growing season caused by climatic warming would thus
thermal stress in late summer and cold temperature be more beneficial to high elevation P. uncinata stands.
during fall could limit the formation of metabolic re- Our results also showed that low elevation trees ( P.
serve and consequently affect radial growth in the fol- sylvestris, A. alba, low elevation P. uncinata) were
lowing year (Rolland and Schueller 1994). more susceptible to hydric stress. Lower elevation trees
showed strong negative correlations with both August
Influence of site factors and September temperature of the year before ring for-
In mountain environments, climatic parameters mation. Similar conclusions were also reached along
strongly depend on elevation (Barry 1992), whereas an altitudinal gradient in the French Alps (Schueller
other factors like slope, aspect, or protection from in- and Rolland 1995, Rolland and Schueller 1996).
tense wind can also influence tree growth at a local
Temporal variability of radial growth
scale. In this study, elevation was the main factor re-
lated to variation in the growth–climate association of Our results indicate that the shared variance held by
P. uncinata. Radial growth of higher elevation P. un- the tree chronologies was not stable through time. The
cinata was favored by warmer temperatures at the end same was observed with the growth–climate associa-
of the previous growing season and at the beginning tion of P. uncinata. Of particular interest was the period
of the growing season compared to lower elevation P. 1900–1949, which showed few years with either ex-
uncinata. The positive influence of late spring–early tremely low or high ring-width indices. In contrast,
summer temperature on trees growing near the upper indices with extreme values were most frequent during
treelike was also observed by Villalba et al. (1997). the period 1950–1994. This also coincided with an in-
This is consistent with the fact that the cambial reac- crease in the annual sensitivity. Comparison with other
12. 252 JACQUES TARDIF ET AL. Ecological Monographs
Vol. 73, No. 2
FIG. 8. Temporal distribution of narrow ( 1.5 SD) and wide ( 1.5 SD) ring-width indices for each species during the
period 1850–1994: (A) Pinus sylvestris, (B) Abies alba, (C) low-elevation Pinus uncinata, and (D) high-elevation P. uncinata.
chronologies in the region indicated that they also pre- cessional changes. Since temperature and precipitation
sented fewer extreme values during the period from vary with elevation, climate change may modify the
1890 to 1950 (for P. uncinata, see Genova 1987; for
´ growth–climate association (i.e., if climatic conditions
P. sylvestris, see Richter 1988). are becoming either more or less favorable to growth).
In a study of the temporal stability of the growth– The described growth–temperature relationships may
climate association in P. sylvestris, Tessier (1989) ob- thus be indicative of recent growth changes of subal-
served great temporal differences among populations, pine conifers in the Central Pyrenees (Gutie rrez et al.
´
and attributed these changes to site disturbances and 1998).
successional changes. It was generalized that spatial Our results emphasized the presence of temporal var-
and temporal variability in the growth–climate asso- iation in the radial growth–climate association. Neither
ciation over a given period within the same climatic the shared variation among tree radial growth indices,
region merely reflect similarities or differences in the the frequency of characteristics rings, nor tree sensi-
structure of the forest stands (Tessier 1989, Tessier et tivity has been constant through time. This may be
al. 1997). We suggest that this phenomenon is also a critical and should be considered for more realistic re-
consequence of climatic variability imposed over suc- construction of past climatic conditions using tree
13. May 2003 SPATIOTEMPORAL VARIABILITY IN GROWTH 253
FIG. 9. Temporal changes in mean annual sensitivity for each species during the period 1850–1994 (see Methods: Temporal
similarity in radial growth). The thin line represents yearly change in sensitivity, and the bold line represents a low-pass
filter as described by Fritts (1976). The horizontal lines represent the average mean annual sensitivity. (A) Pinus sylvestris,
(B) Abies alba, (C) low-elevation Pinus uncinata, and (D) high-elevation P. uncinata.
rings. The temporal analysis of the shared variance on tree growth by providing complementary informa-
among tree chronologies along an ecological gradient tion that otherwise may not be picked up.
has allowed us to identify periods where climate was Our results showed that the period corresponding to
likely most influential. In absence of long-term climatic the end of the Little Ice Age and the last 50 years were
data, coupling of these analyses with standard dendro- both characterized by greater affinity among chronol-
climatic reconstruction may help to strengthen our un- ogies. We speculate that three distinct periods char-
derstanding of the influence that changing climate has acterized by important changes in the regional climate
14. 254 JACQUES TARDIF ET AL. Ecological Monographs
Vol. 73, No. 2
FIG. 10. Temporal changes in the correlation between the yearly scores on the first two principal components and the
monthly temperature for eight 50-yr periods starting in 1880. The strength of the correlation is indicated by the size of the
circle (from the smallest to the largest: P 0.1, P 0.05, P 0.01, and P 0.001). Open circles indicate a positive
correlation, and solid circles indicate a negative correlation.
have occurred since the 1850s. First, a climate system droughts) in the last 50 years. Other authors have found
characterized by a shorter growing season than today an increase in climatic anomalies in Spain since 1940
dominated the late 19th century. This is suggested by (Manrique and Fernandez-Cancio 2000). This is con-
´
the strong shared variance among trees from all sites. sistent with our dendroecological results.
Our results suggest that the turn of the 20th century Climate conditions acting at both lower and higher
constituted a transitional climate phase between the end elevation may be at the origin of this trend. Overall, it
of the Little Ice Age period and the current period. appears that temperatures in late summer and fall dur-
Font Tullot (1988) described the period 1881–1895 as ing the year before ring formation and spring (May)
very cold in Spain, marking the start of a warming temperatures during the year of ring formation have
trend in the beginning of the 20th century (see also become more limiting to growth today. This may reflect
Fontana Tarrats 1975–1978, 1976). changes in the timing or length of the growing season
Since the beginning of the 20th century, increasing (Hansen-Bristow 1986). In the Central Pyrenees and
dissimilarity was observed among chronologies, indi- during the second half of the 20th century, the growth
cating that climate was less limiting to growth. This season of P. uncinata may have increased as well as
coincided with a generalized decrease in the frequency the water stress during the growth period. This ‘‘steep-
of extremely low or high indices for the period 1900– ening’’ of the gradient could also cause the elevation
1950. Few climate variables were also correlated to of the tree line and other changes (Camarero 1999).
growth during this period. Results showed that site el- The interpretation of the evolution of the climatic
evation was not a major factor influencing growth of response determined and calculated using the Pic du
P. uncinata during that period. Warmer, more humid Midi data must, however, be viewed critically.
conditions with low year-to-year variability may have Throughout the 1882–1993 period, the spatial coverage
brought a ‘‘disruption’’ or ‘‘relaxation’’ of the elevation of the meteorological stations was irregular. In addi-
gradient, allowing local growth conditions to dominate. tion, no detailed analyses of extreme climatic events
From the mid 20th century, climate conditions have were realized. In the long term, factors that may have
again become more limiting to growth, as suggested changed are both the continentality (change in air mass
by increasing similarity among the tree chronologies. penetration in the region) and the effect of elevation
Year-to-year variation in climatic conditions has also in relation to the ecological amplitude of P. uncinata.
increased as illustrated by the higher sensitivity and The absence of long-term precipitation data for the re-
extreme growth indices recorded by the trees. Font Tul- gion makes it difficult to discuss climate change in
lot (1988) reported an increase in the frequency of ex- terms of air mass penetration. However, the rainfall
treme climatic events (high temperatures, frosts, pattern in the Iberian Peninsula is influenced by both
15. May 2003 SPATIOTEMPORAL VARIABILITY IN GROWTH 255
the North Atlantic Oscillation (NAO) and the El Nin o ˜ and should be considered for more realistic reconstruc-
Southern Oscillation (ENSO) (Rodo et al. 1997, Rod-
´ tion of past climatic conditions.
rıguez-Puebla et al. 2001). Though most of the Iberian
´
ACKNOWLEDGMENTS
Peninsula is under NAO influence during winter, the
We thank the personnel of the Park for their help during
correlation between ENSO and rainfall increased to- sampling. We are also grateful to J. A. Romero, M. A. Rod-
ward the end of the 20th century (Rodo et al. 1997).
´ rıguez, X. Lluch, O. Bosch, P. Sheppard, E. Schwartz, and F.
´
The percentage of springtime variability due to ENSO Conciatori, and many other people for their help during field
has similarly increased. In the 1980s and 1990s, the sampling or laboratory tasks, and to Dr. Dessens for providing
Iberian Peninsula was also under the influence of ex- the Pic du Midi meteorological data. We thank Dr. S. Forbes
and Dr. R. Staniforth for reviewing the manuscript for its
tended periods of drought and mild winter. These drier prose. The constructive and critical comments made by Dr.
conditions in southwestern Europe were associated F. Biondi, Dr. S. Jackson (Associate editor), and one anon-
with a persistent positive phase of the NAO during ymous reviewer greatly improved the clarity and scope of the
winter (Hurrell 1995). Longer growing seasons were manuscript. This research was financed by the Spanish CICyT
(AMB95–0160) and through the EU FORMAT project
also reported to occur during positive phases of the (ENV4-CT97–0641). During this study, J. Tardif benefited
NAO in Europe (Post and Stenseth 1999). from a postdoctoral fellowship from the Fonds FCAR and the
Whether the climatic interpretation of our results is programme de cooperation Quebec—Catalogne, and J. J. Ca-
´ ´
indicative of a general climatic instability is still a mat- marero benefited from a FPI grant (Ministerio de Educacion ´
y Ciencia, Spain). We thank all institutions for their support.
ter for debate. Temperature data from the Pic du Midi
station are probably representative of the Central Pyr- LITERATURE CITED
enees region as suggested by the strong correlation Allue, J. L. 1990. Atlas fitoclimatico de Espana. Ministerio
´ ´ ˜
among all stations for the common period. These data de Agricultura Pesca y Alimentation, Instituto Nacional de
show a drastic increase of minimum temperatures, a Investigationes Agrarias, Madrid, Spain.
Aniol, R. W. 1983. Tree-ring analysis using CATRAS. Den-
decrease of diurnal temperature ranges, and an increase
drochronologia 1:45–53.
of temperature variability since 1940 (Bucher and¨ Barry, R. G. 1992. Mountain climatology and past and po-
Desssens 1991, Dessens and Bucher 1995, 1997).
¨ tential future climatic changes in mountain regions: a re-
view. Mountain Research and Development 12:71–86.
Conclusion Beeckman, H. 1992. Redundancy analysis of tree rings and
meteorological data in a Nelder design poplar plantation.
The results presented here demonstrated that radial Pages 22–26 in T. S. Bartholin, B. E. Berglund, D. Eckstein,
and F. H. Schweingruber, editors. Tree rings and environ-
growth of P. sylvestris, A. alba, and P. uncinata was
ment, Lundqua Report, Volume 34, Sweden.
affected in similar ways by macroclimatic conditions. Beniston, M., H. F. Diaz, and R. S. Bradley. 1997. Climatic
Although all species responded negatively to warm change at high elevation sites: an overview. Climatic
September (t 1) and positively to both warm No- Change 36:233–251.
vember (t 1) and May (t) temperatures, each species Blasing, T. J., D. N. Duvick, and E. R. Cook. 1983. Filtering
the effects of competition from ring-width series. Tree-Ring
also showed a specific radial growth–climate associa- Bulletin 43:19–30.
tion. Pinus sylvestris may be more susceptible to hydric Bucher, A., and J. Dessens. 1991. Secular trend of surface
¨
stress during the year the annual ring forms, whereas temperature at an elevated observatory in the Pyrenees.
A. alba appears to be more sensitive to hydric stress Journal of Climate 4:859–868.
Camarero, J. J. 1999. Growth and regeneration patterns and
during the year before ring formation. Pinus uncinata processes in Pinus uncinata Ram.: treeline ecotones in the
radial growth was, in contrast, primarily associated Pyrenees and in an isolated population in the Western dis-
with monthly temperature variables. Moreover, local tribution limit in Spain. Dissertation. University of Bar-
ecological factors like elevation modulated the strength celona, Barcelona, Spain.
Camarero, J. J., J. Guerrero-Campo, and E. Gutierrez. 1998.
´
of the response of trees to climate. This study showed Tree-ring growth and structure of Pinus uncinata and Pinus
the usefulness of multivariate analyses like RDA for sylvestris in the Central Spanish Pyrenees. Arctic and Al-
decomposing the tree–climate–site complex. Our re- pine Research 30:1–10.
sults indicated the presence of temporal variation in Cantegrel, R. 1983. Le Pin a crochets pyreneen: biologie,
` ´ ´
the radial growth–climate association. Neither the biochimie, sylviculture. Acta Biologica Montana 2–3:87–
330.
shared variation among tree radial growth indices, the Carreras, J., E. Carrillo, R. M. Masalles, J. M. Ninot, I. So-
frequency of characteristics rings, nor tree sensitivity riano, and J. Vigo. 1996. Delimitation of the supra-forest
have been constant through time. Of particular impor- zone in the Catalan Pyrenees. Bulletin de la Societe Lin-
´
tance was the early 20th century period that was char- neenne de Provence 47:27–36.
´
Carrillo, A., and J. M. Ninot. 1992. Flora i vegetacio de les
´
acterized by low shared variation in contrast to the late valls d’Espot i de Boı. Institut d’Estudis Catalans. Archivo
´
20th century period. We speculate that climate change Seccion Ciencies XCIX/2:1–351.
´
may underlie this trend and that trees have adjusted to Ceballos y Fernandez de Cordoba, L., and J. Ruiz de la Torre.
´ ´
´
1979. Arboles y arbustos de la Espana Peninsular. Escuela
˜
new climatic conditions. In absence of long-term cli-
Tecnica Superior de Ingenieros de Montes, Madrid, Spain.
´
matic data, analysis of the temporal evolution of the Cook, E. R. 1985. A time series analysis approach to tree-
shared variance among chronologies (estimators) as ring standardization. Dissertation. Department of Geosci-
well as of other tree ring characteristics may be critical ences, University of Arizona, Tucson, Arizona, USA.
16. 256 JACQUES TARDIF ET AL. Ecological Monographs
Vol. 73, No. 2
Cook, E. R., and L. A. Kairiukstis, editors. 1990. Methods response to vapour pressure difference. Plant Physiology
of dendrochronology. Kluwer, Boston, Massachusetts, 83:316–322.
USA. Guisan, A., L. Tessier, J. I. Holten, W. Haeberli, and M. Baum-
Cook, E. R., and K. Peters. 1981. The smoothing spline: a gartner. 1995. Understanding the impact of climate change
new approach to standardizing forest interior tree-ring on mountain ecosystems: an overview. Pages 15–37 in A.
width series for dendroclimatic studies. Tree-Ring Bulletin Guisan, J. I. Holten, R. Spichiger, and L. Tessier, editors.
41:45–53. Potential ecological impacts of climatic change in the Alps
Creus, J. 1991–1992. Tendencia secular de la temperatura de and Fennoscandian mountains. Conservacıon Jardin Bo-
´
Mayo en el Pirineo Oriental. Notes de Geografia Fısica 21–
´ tanıco, Geneve, Switzerland.
´ `
22:41–49. Gutierrez, E. 1991. Climate tree-growth relationships of Pi-
´
Creus, J., M. Genova, A. F. Cancio, and A. P. Antelo. 1992.
´ nus uncinata Ram. in the Spanish pre-Pyrenees. Acta Oec-
New dendrochronologies for Spanish Mediterranean Zone. ologica 12:213–225.
Pages 76–78 in T. S. Bartholin, B. E. Berglund, D. Eckstein, Gutierrez, E., J. J. Camarero, J. Tardif, O. Bosch, M. Ribas,
´
and F. H. Schweingruber, editors. Tree rings and environ- E. Schwartz, P. R. Sheppard, and F. Conciatori. 1998. Xarxa
ment, Lundqua Report, Volume 34, Sweden. de dendrocronologies establertes al P.N. d’Aiguestortes i
Creus, J., and J. Puigdefabregas. 1976. Climatologıa historica
´ ´ ´ Estany de Sant Maurici: avaluacio per a estudis dendroe-
´
y dendrocronologıa del Pinus uncinata Ramond. Cuadernos
´ cologics i climatics a llarg termini. Pages 39–74 in IV
` `
de Investigacion, Logrono (Spain) 2:17–30.
´ ˜ Jornades sobre Recerca al Parc Nacional d’Aiguestortes i
Del Barrio, G., J. Creus, and J. Puigdefabregas. 1990. Ther-
´ Estany de Sant Maurici. Espot 22–24 October 1997.
mal seasonality of the high mountain belts of the Pyrenees. Hansen-Bristow, K. 1986. Influence of increasing elevation
Mountain Research and Development 10:227–233. on growth characteristics at timberline. Canadian Journal
Dessens, J., and A. Bucher. 1995. Changes in minimum and
¨ of Botany 64:2517–2523.
maximum temperatures at Pic du Midi in relation with hu- Hill, M. O. 1979. TWINSPAN, a Fortran program for ar-
midity and cloudiness, 1882–1984. Atmospheric Research ranging multivariate data in a ordered two-way table by
37:147–162. classification of the individuals and attributes. Department
Dessens, J., and A. Bucher. 1997. A critical examination of
¨ of Ecology and Systematics, Cornell University, Ithaca,
precipitation records at the Pic du Midi observatory, Pyr- New York, USA.
enees, France. Climatic Change 36:345–353. Holmes, R. L. 1983. Computer-assisted quality control in
Diaz, H. F., and R. S. Bradley. 1997. Temperature variations tree-ring dating and measurement. Tree-Ring Bulletin 43:
during the last century at high elevation. Climatic Change 68–78.
36:254–279. Holmes, R. L. 1992. Dendrochronology program library. Ver-
Folland, C. K., T. R. Karl, and K. Y. Vinnikov. 1990. Ob- sion 1992-1. Laboratory of Tree-Ring Research, University
served climate variations and change. Pages 195–238 in J. of Arizona, Tucson, Arizona, USA.
T. Houghton, G. J. Jenkins, and J. J. Ephraums, editors. Houghton, J. T., L. G. Meira Filho, B. A. Callander, N. Harris,
Climate changes, the IPCC scientific assessment. Cam- A. Kattenberg, and K. Maskell, editors. 1996. Climate
bridge University Press, Cambridge, UK. change 1995: the science of climate change. Cambridge
Font Tullot, I. 1988. Historia del clima de Espana. Cambios
˜ University Press, Cambridge, UK.
climaticos y sus causas. Instituto National de Meteorologia,
´ Hughes, M. K., B. Gray, J. R. Pilcher, and V. C. Lamarche,
Jr. 1978. Climatic signal in British Isles tree ring chro-
Madrid, Spain.
nologies. Nature 272:605–606.
Fontana Tarrats, J. M. 1975–1978. ‘‘Entre el cardo y la rosa.’’
Hurrell, J. W. 1995. Decadal trends in the North Atlantic
Historia del clima de la Meseta. (Ineditas).
´
Oscillation: regional temperatures and precipitation. Sci-
Fontana Tarrats, J. M. 1976. Historia del clima en Cataluna. ˜
ence 269:676–679.
Noticias antiguas y medievales, y en especial de los siglos
Jones, P. D. 1994. Hemispheric surface air temperature var-
XV, XVI y XVII. (Ineditas).´ iations: a reanalysis and an update to 1993. Journal of Cli-
Fritts, H. C. 1976. Tree rings and climate. Academic Press, mate 7:1794–1802.
New York, New York, USA. Kienast, F., F. H. Schweingruber, O. U. Braker, and E. Schar.
Fritts, H. C., E. A. Vaganov, I. V. Sviderskaya, and A. V. 1987. Tree-ring studies on conifers along ecological gra-
Shashkin. 1991. Climatic variation and tree-ring structure dients and potential of single-year analyses. Canadian Jour-
in conifers: empirical and mechanistic models of tree-ring nal of Forest Research 17:683–696.
width, number of cells, cell-size, cell-wall thickness and Korner, C. 1998. A re-assessment of high elevation treeline
¨
wood density. Climate Research 1:97–116. positions and their explanation. Oecologia 115:445–459.
Genova, R. 1986. Dendroclimatology of mountain pine (Pi-
´ Legendre, P., and L. Legendre. 1998. Numerical ecology.
nus uncinata Ram.) in the Central plain of Spain. Tree-Ring Elsevier, New York, New York, USA.
Bulletin 46:3–12. Luckman, B. H. 1990. Mountain areas and global change: a
Genova, R. 1987. Analisis y significado de los anillos de
´ ´ view from the Canadian Rockies. Mountain Research and
crecimiento de dos especies forestales: Pinus uncinata y Development 10:183–195.
Pinus sylvestris, en la Penınsula Iberica. Dissertation. Uni-
´ ´ Manly, B. F. J. 1998. Randomization, bootstrap and Monte
versity of Barcelona, Barcelona, Spain. Carlo methods in biology. Second edition. Chapman and
Gil Pelegrın, E., and L. Villar Perez. 1988. Structure of moun-
´ ´ Hall, London, UK.
tain pine (Pinus uncinata) populations at its upper limit in Manrique, E., and A. Fernandez-Cancio. 2000. Extreme cli-
´
Central Pyrenees. Pirineos 131:25–42. matic events in dendroclimatic reconstructions from Spain.
Gomez Manzaneque, F., editor. 1997. Los bosques ibericos:
´ ´ Climatic Change 44:123–138.
una interpretacion geobotanica. Planeta, Barcelona, Spain.
´ ´ Oribe, Y., and T. Kubo. 1997. Effect of heat on cambial
Grace, J., and D. A. Norton. 1990. Climate and growth of reactivation during winter dormancy in evergreen and de-
Pinus sylvestris at its upper altitudinal limit in Scotland: ciduous conifers. Tree Physiology 17:81–87.
evidence from tree growth-rings. Journal of Ecology 78: Petitcolas, V., and C. Rolland. 1998. Comparaison dendroe- ´
601–610. cologique de Larix decidua Mill., Pinus cembra L. et Pinus
Guelh, J. H., and G. Aussenac. 1987. Photosynthesis de- uncinata Mill. Ex Mirb., dans l’etage subalpin du Brian-
´
creases and stomatal conductance in Abies alba Mill. in ´
connais (Hautes-Alpes, France). Ecologie 29:305–310.
¸