Article 'Response of moths (Lepidoptera: Heterocera) to livestock grazing in Mongolian rangelands' by Khishigdelger Enkhtura, Martin Pfeiffera, Ariuntsetseg Lkhagvaa, Bazartseren Boldgiva
2. 668 K. Enkhtur et al. / Ecological Indicators 72 (2017) 667–674
management and objective evaluation of pasture conditions (Pöyry
et al., 2005).
Species diversity and productivity of biological communities are
important indicators of environmental health (Rapport et al., 1998;
Gerlach et al., 2013) that can be used to assess the state of pas-
ture (Lawton and Gaston, 2001). For example, epiphytic lichens
have been successfully used as indicators of overgrazing in Mon-
golian forest steppes (Hauck and Lkhagvadorj, 2013). Dayflying
Lepidoptera (butterflies and moths) are indicators of the state of
semi-natural grasslands for conservation in Europe (Lawton and
Gaston, 2001; Rákosy and Schmitt, 2011), while ants (Hoffmann,
2010; Williams et al., 2012), dung beetles (Verdú et al., 2007), cara-
bid beetles (Kaltsas et al., 2013) and plants (Best and Bork, 2003)
have been successfully used as indicators of grazing pressure in
Mediteranean and arid ecosystems. Compared to lichens (Walser
et al., 2005), arthropod life span and generation times are short. As
demonstrated by Niemelä et al. (1993), species with shorter gener-
ation times will respond to disturbance events faster than those
with longer generation times and are therefore better indicator
species. The higher mobility of invertebrates compared to plants
and lichens allows for rapid adaptation to habitat changes, even at
the community level. However, this goes hand in hand with a high
variability in abundance due to weather conditions, a clear draw-
back of animal-bioindicators compared with stationary taxa like
plants and lichens.
How grazing pressure affects plant diversity, cover and produc-
tion has been widely studied in Mongolian steppes (e.g., Lkhagva
et al., 2013), northern China (Wang and Wesche, 2016) and else-
where (e.g. Manier and Hobbs, 2006), but there is not enough
information about how pasture degradation affects herbivores
other than pasture livestock (Pöyry et al., 2005) and what kind of
organisms can be used as indicators for it. In the vast true steppes
of central Mongolia trees are extremely rare so epiphytic lichens
can not serve as indicators for overgrazing as they have further
northern distribution and thus other bioindicators are needed.
To study the effects of pasture degradation on herbivores and
to assess different pasture patterns, we chose to use moth species
occurrence and diversity. As moths are abundant, mobile, and
widespread in many different habitats and sensitive to environ-
mental changes, they are particularly useful as indicator species
(Maleque et al., 2009). Monitoring their numbers and ranges can
give us vital clues to changes in our own environment, such as the
effects of new farming practices, pesticides, air pollution, pasture
degradation, ecosystem condition and climate change (Bachand
et al., 2014; Folcher et al., 2012; Summerville et al., 2004; Kitching
et al., 2000; Kroupa et al., 1990). Moths also can be indicators of
diversity for other animal species (Lund and Rahbek, 2002). They
live in close interaction with vegetation, as caterpillars and adult
moths of many species depend on plants as food and nectar source,
while moths in return act as important pollinators (Choi and Chun,
2009; Axmacher et al., 2011). As grasses and herbs are the pre-
vailing vegetation in Mongolian steppe zone, herbivore caterpillars
are directly competing with livestock for food and should be espe-
cially suited as indicator species, while bioindicators from other
trophic groups are only in indirect competition. Compared with
beetles and ants, moth offspring are less protected, as caterpillars
are much more exposed to other direct effects of overgrazing, e.g.
trampling, destruction of shelter and loss of individuals by (unin-
tended) predation of livestock, and thus in some aspects similar
to plants. Moreover, information on abundance, distribution and
species diversity of moths are useful baseline data to study effects
of climate change in the future (Itämies et al., 2011).
In this study we (1) investigated how pasture degradation
affects moth diversity; (2) revealed indicator species of intensively
grazed and less grazed pasture, and (3) collected baseline data of
species richness and distribution of moths in the face of climate
change.
We investigated the following detailed hypotheses: (1) Pasture
degradation impacts moth diversity negatively, so species richness
and diversity measures will be higher in less grazed areas; (2) Graz-
ing pressure by large herbivores changes habitat conditions for
insect herbivores, so indicator species of moths in lightly grazed
and heavily grazed plots will be different; (3) Mongolian steppe
is a diverse habitat, so moth and vegetation communities will be
different at different sample sites.
2. Materials and methods
2.1. Study area
Mongolia is a landlocked country situated in Central Asia
between Russia and China. It has a vast territory of 1.56 million
square km. Mongolia is located in the transition zone between the
deserts of Central Asia and the boreal taiga of southern Siberia
and belongs to the temperate region (Tsegmid, 1969). About 72%
of the territory (112.8 million hectares) is categorized as range-
land, which supports about 170,000 herder families. The rangeland
is divided into six ecological zones: high mountain, taiga, forest
steppe, steppe, desert steppe and desert. These ecological zones
differ from each other by topography, climate, flora and fauna
(Yunatov, 1976).
Our study sites were selected in the area around Undur-
shireet soum (subdistrict) (N 47◦27 11.82 E 105◦03 19.11 ) in
Tuv Aimag (district) and in the Ikhtamir soum (N 47◦25 01.86 E
100◦44 45.54 ) of Arkhangai Aimag, which are located 180 km and
570 km from Ulaanbaatar, respectively (Fig. 1). Both areas have
been monitored during recent years with help of the Green Gold
Project funded and implemented by Swiss Development Agency at
Mongolia, which also gave financial support to our study. In terms
of vegetation and responses to livestock grazing, the sites were dif-
ferent (Fernandez-Gimenez and Allen-Diaz, 1999). Plots at Ikhtamir
were placed in mountain steppe, while the plots at Undurshireet lay
in dry steppe (Appendix Fig. A1 in Supplementary material). Annual
precipitation at Undurshireet is 200–250 mm, with flat to undulat-
ing topography at altitude of up to 1700 m a.s.l. Annual precipitation
at Ikhtamir is 300–400 mm, also with undulating topography at
elevations up to 1700 m a.s.l. (Tsegmid, 1969).
In each study site we chose two plots for characterization of
vegetation for grazing regime based on vegetation cover and struc-
ture. Pasture degradation was broken into the following categories
according to Chognii (1978):
Lightly grazed pasture: The main vegetation community of
steppe dominates (Poa attenuata, Koeleria cristata, Agropyron crista-
tum, Stipa spp.), forbs are less dominant and plants which tolerate
grazing such as Artemisia frigida, Potentilla acaulis, Convolvu-
lus ammanii, Leymus chinensis, Cleistogenes squarrosa are slightly
increased in abundance. Plant species richness is decreased due to
grazing pressure.
Medium grazed pasture: The plants of the main steppe vegeta-
tion community are decreased in abundance and grazing resistant
plants such as Artemisia frigida, A. adamsii, Potentilla acaulis, Con-
volvulus ammanii, and Leymus chinensis dominate.
Heavily grazed pasture: Plant species from the main steppe veg-
etation community become very scarce and plants that tolerate
grazing are dominant. For example, A. frigida, A. adamsii, P. acaulis,
Carex duriuscula, and L. chinensis.
We sampled moths and plants from “Lightly grazed” (LG),
“Medium grazed” (MG) and “Heavily grazed” (HG) plots depending
on local situation. Completely ungrazed plots did not occur in either
site, as fencing was damaged during the investigation period at the
3. K. Enkhtur et al. / Ecological Indicators 72 (2017) 667–674 669
Fig. 1. Locations of Ikhtamir and Undurshireet. Both places have similar latitudes and altitudes (1700 m). Shading marks protected areas of Mongolia.
(few) fenced plots that were available for study. These partially
fenced plots were included with the LG plots. The LG plots of both
Undurshireet and Ikhtamir matched the first category described by
Chognii (1978), the MG plot at Ikhtamir matched the second cate-
gory, and the HG plot at Undurshireet matched the third category. In
the LG plot grasses and forbs dominated, while in MG and HG areas
sage (Salvia sp.) and Artemisia were mostly dominant and sedges
(Carex sp.) were subdominant. The two latter plots were situated
near pens where nomadic herders protect their livestock in winter.
In our plots in Undurshireet, the main grazers were usually horses
and cows, while in Ikhtamir horses, cows, sheep and goats were
all grazing. The total number of livestock in 2015 in Undurshireet
was 211,742 and 283,580 in Ikhtamir (National Statistical Office of
Mongolia, 2015). There was no precollected information on grazing
intensity available.
We chose the experimental plots by making observations of
vegetation and asking the local herders. Some of the plots were
permanent observation plots for the Green Gold Project that have
been used for years in other experiments and were partially fenced.
Grazed and lightly grazed plots were separated by 1 km in
Undurshireet; that separation distance included a small hill that
worked as an optical barrier preventing attraction of moth speci-
mens from one plot to the other during light trapping. In Ikhtamir
plots were evenly separated by 2 km; as light trapping usually
attracts moths from a radius of about 25 m (Wirooks, 2006), this
distance was considered sufficient to again avoid attracting moths
across plots. Species richness and abundance of moths sampled
depended on the surrounding environment (within ca. 2000 m2
area), although negative effects, e.g. pasture degradation, may
impact a larger area (Fuentes-Montemayor et al., 2011).
2.2. Sampling
Plant and insect data for the different sites were collected at
the same plots in order to compare diversity of the taxa. Vegeta-
tion samples were taken from a 1 m2 area with 10 replications both
in Undurshireet and Ikhtamir. We chose the sample locations ran-
domly by throwing the sample frame. Space between the samples
within an area was on average ten meter. Plant species of each plot
are listed in Table 1.
Table 1
Dominant plant species in both plots of our study sites.
Undurshireet Ikhtamir
Lightly grazed plot Lightly grazed plot
Agropyron cristatum
Allium odorum
Allium anisopodium
Arenaria capillaris
Artemisia frigida
Carex duriuscula
Carex sp.
Cleistogenes squarrosa
Convolvulus ammanii
Dianthus versicolor
Galium verum
Haplophyllum dauricum
Heteropappus hispidus
Potentilla bifurca
Potentilla sericea
Sedum aizoon
Stipa krylovii
Youngia tenuicaulis
Agropyron cristatum
Amblynotus rupestris
Arenaria capillaris
Artemisia commutata
Artemisia pectinata
Bupleurum bicaule
Carex duriuscula
Dontostemon
integrifolius
Festuca lenensis
Koeleria macrantha
Potentilla acaulis
Polygonum
angustifolium
Poa attenuata
Peucedanum hystrix
Potentilla acaulis
Scabiosa comosa
Serratula centauroides
Stipa krylovii
Heavily grazed plot Medium grazed plot
Achnatherum splendens
Artemisia sp.
Artemisia frigida
Carex duriuscula
Cleistogenes squarrosa
Chenopodium album
Salvia sp.
Urtica sp.
Agropyron cristatum
Allium bidentatum
Arenaria capillaris
Artemisia commutata
Artemisia mongolica
Artemisia pectinata
Carex duriuscula
Galium verum
Potentilla acaulis
Potentilla bifurca
Stipa krylovii
In both study areas our research was conducted between 1 st
August 2013 and 20th August 2013, when we sampled LG and
MG/HG plots alternately. In the first seven days we sampled from
the LG plot of Undurshireet and Ikhtamir, and in the next seven
days we sampled from MG/HG plots. In the remaining six days
we sampled alternately. We sampled again in Undurshireet in
2015, but technical problems allowed only for a shorter sampling
period from 27th to 30th July. We caught moths from 21:00 h
4. 670 K. Enkhtur et al. / Ecological Indicators 72 (2017) 667–674
to 24:00 h by using an ultraviolet light trap (small semitranspar-
ent fabric light tower with a 12 V ultra violet light produced by
Bioform, Germany), and killed them in bottles with cyanide. We fol-
lowed the “Method of Collecting, Treating and Preserving of Insects”
(Namkhaidorj, 1981). We identified morphospecies in the field and
from each morphospecies we mounted at least 1–2 individuals
in the field (Appendix Fig. 1 in Supplementary material), brought
them to a laboratory and identified them using the identification
keys in “Noctuidae Sibirica” (Kononenko, 2010), “Identification Key
of Insects of Mongolia”, volume II, part 2 (Namkhaidorj et al., 2008),
volume V of the “Identification Key of Insects of Far East, Rus-
sia” (Lera, 2005), and local taxonomic websites (www.catocala.
narod.ru (Berlov and Berlov, 1999–2014) and www.omflies.narod.
ru (Svyatoslav, 2000)). All other insect material was also brought
to the lab and later reexamined to confirm identification.
2.3. Data analysis
Shannon-Wiener diversity (exp H), Simpson diversity (D) and
Shannon Evenness (E) were used to calculate species diversity and
species evenness of moths of each plot. Shannon-Wiener diversity
was calculated as the exponent of the Shannon-Wiener diversity
index (H). Results of different plots could be compared directly as
all of these measures are linear (Jost, 2006). Sorensen’s index was
used to calculate the similarity of moth communities among plots.
We used EstimateS Win 8.20 to calculate these indices and read out
the combined results for the whole community of the respective
treatments. We ran indicator species analyses using the method
of Dufrêne and Legendre (1997) with the PC-ORD 5.17 program
(McCune and Mefford, 2011). To test the indicator species we used
the indicator value method of Dufrêne and Legendre (1997). The
indicator value of each i species of j group was calculated as
INDVALij = Aij × Bij×100
where Aij is the relative abundance of species i in group j and Bij is
the relative frequency of species i in group j.
The higher the indicator value of a species, the higher is the
possibility of being an indicator species. To test the statistical sig-
inificance of the indicator value for each species, we used Monte
Carlo tests with 4999 randomized runs. When the observed indica-
tor value exceeds the randomized indicator value, it is statistically
significant.
Non-metric Multidimensional Scaling (NMDS) was performed
in R with the function metaMDS of vegan package using the Bray-
Curtis Index on Wisconsin square root standardized data. MetaMDS
uses random starts and iteratively tries to find the best possible
solution for community structure. Species points were added to
the ordination plot using the wascores function of R-package vegan
(Oksanen et al., 2013).
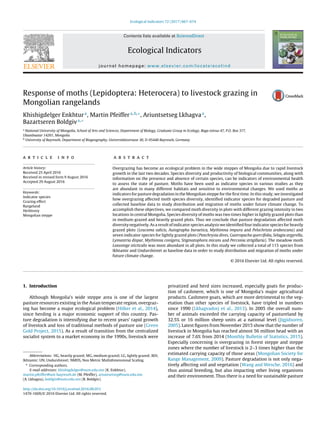
3. Results
3.1. Species diversity of moths
We caught almost identical numbers of specimens at Ikhtamir
and Undurshireet, 7896 and 7782, respectively. As indicated by the
rarefaction plot (Fig. 2) species richness was almost saturated in
both areas, thus sampling was nearly exhaustive. In both locations,
species richness and diversity of moths were 1.3–2 times higher in
the LG plots compared to the HG or MG plots (Table 2, Appendix
Table 1 in Supplementary material). In Ikhtamir 50 species from 10
families of Lepidoptera were caught in the LG plot, while in Undur-
shireet we caught 62 species of nine families of moth from the LG
plot. In HG and MG plots, on the other hand, 40 species of 10 families
0 1000 2000 3000 4000 5000 6000 7000 8000
Samples
0
10
20
30
40
50
60
70
80
90
Species
UN
IKH
Fig. 2. Rarefaction curve for moth species of Undurshireet and Ikhtamir. In both
places samples are almost saturated for species number.
Table 2
Species richness and species diversity of moths in Ikhtamir and Undurshireet at
maximum sample size for each plot. Given are the results of the randomization
software with bootstrap SDs, based on variation in sample order among random-
izations. Species richness and diversity of moth were higher in both of the lightly
grazed plots.
Ikhtamir Medium grazed plot Lightly grazed plot
Total captured individuals 3824 4072
Species richness 40 ± 0.1 50 ± 0.5
Shannon Diversity 4.28 ± 0.05 7.2 ± 0.05
Simpson Diversity 2.53 ± 0.01 4 ± 0.02
Undurshireet Heavily grazed plot Lightly grazed plot
Total captured individuals 4682 3101
Species richness 44 ± 4.08 62 ± 3.89
Shannon Diversity 1.54 ± 0.2 3.02 ± 0.01
Simpson Diversity 1.1 4 ± 0.01 1.57 ± 0.01
0 10 20 30 40 50
Species
0
1
2
3
4
5
6
7
8
9
Relativeabundance(ln)
Lightly grazed (IKH)
Medium grazed (IKH)
Lightly grazed (UN)
Heavily grazed (UN)
Fig. 3. Rank abundance curves of moth species in Ikhtamir Soum (IKH) of Arkhangai
Aimag and Undurshireet Soum (UN) of Tuv Aimag. Heavily/medium grazed and
lightly grazed plots showed a similar distribution of species.
of moth were collected in Ikhtamir and 44 species of nine families
in Undurshireet.
As demonstrated by the rank abundance curves a few species
dominated the moth communities and many other species were
relatively evenly distributed (Fig. 3). In Ikhtamir Soum, Lox-
ostege sticticalis (n = 1516), Selagia argyrella (n = 117) and Pyla fusca
5. K. Enkhtur et al. / Ecological Indicators 72 (2017) 667–674 671
Table 3
Species richness and species diversity of vegetation. Given are the results of the
randomization software at 10 samples with bootstrap SDs, based on variation in
sample order among randomizations.
Ikhtamir Medium grazed plot Lightly grazed plot
Species richness 5.6 ± 1.2 13.5 ± 0.47
Shannon Diversity 2.26 ± 0.12 11.76 ± 0.21
Simpson Diversity 1.46 ± 0.05 7.58 ± 0.2
Undurshireet Heavily grazed plot Lightly grazed plot
Species richness 3.7 ± 2.6 6.1 ± 1.3
Shannon Diversity 4.44 ± 0.37 6.20 ± 0.2
Simpson Diversity 3.07 ± 0.23 4.69 ± 0.18
(n = 1253) were dominant in the LG plot, while in the HG plot rel-
ative abundances of Loxostege sticticalis (n = 2145), Lampropteryx
suffumata (n = 106) and Pelochrista arabescana (n = 107) were high-
est. In Undurshireet Soum, in the LG plot Loxostege sticticalis
(n = 2468), Gastropacha quercifolia (n = 152), Anarta trifolii (n = 90)
and Lygephila ludicra (n = 53) dominated, while the HG plot was
dominated by Loxostege sticticalis (n = 4387) and Anarta trifolii
(n = 41). Loxostege sticticalis was the most abundant species of moth
in all plots and was caught in large numbers.
3.2. Species diversity of vegetation
Plant diversity and plant cover was higher in both LG plots
(Table 3). Vegetation cover of the LG plot in Undurshireet was
40 ± 4% on average, and species number per 1 m2 was 6.1 ± 1.3,
while in the HG plot of Undurshireet vegetation cover was 32 ± 9.3%
on average, and mean species number in 1 m2 was 3.7 ± 2.6. Vegeta-
tion cover was 84.55 ± 6.13% at the LG plot of Ikhtamir and species
number/m2 was 13.5 ± 0.47, while at the MG plot of Ikhtamir vege-
tation cover was 74 ± 7.63% and species number/m2 was 5.6 ± 1.2.
3.3. Similarity of moth communities
Moth communities in the two different treatments (LG and HG
plots) of Ikhtamir differed by about 1/3, as measured with the
Sorensen’s index (0.674), while plots of Undurshireet differed to
approximately 50% (Table 4). However, when grouped in terms
of grazing pressure, the plots of similar type in Undurshireet and
Ikhtamir had even less similarities with each other than with
nearby sites under different grazing pressure (LG vs. LG 0.252 sim-
ilarity and HG vs. MG 0.154 similarity), thus pointing to highly
diverse moth communities in both sites.
In NMDS analysis moth communities in two treatment plots (LG
and MG) of Ikhtamir Soum were grouped together and differed in
NMDS significantly among each other (Mann-Whitney U-test, U = 5,
Z = 3.4, n = 20, p < 0.001), while those of Undurshireet Soum were
overlapping with no significant differences (Fig. 4). Communities
of the different localities were widely separated, indicating high
species turnover between sites (NMDS1, Mann-Whitney U-test,
U = 0, Z = −5.76, n = 46, p < 0.001).
3.4. Similarity of plant communities
Plots of Undurshireet LG and HG were most similar to each other
by vegetation (0.643) as measured with a Sorensen’s index, while
plots of Ikhtamir differed by approximately 1/4 (Table 5). When
grouped in terms of grazing pressure, the plots of similar type in
Undurshireet and Ikhtamir had very low similarity (LG with LG
Table 4
Similarity of study plots by moth species as calculated by shared species (above diagonal) and Sorensen’s index (below diagonal).
Ikhtamir lightly
grazed plot
Ikhtamir medium
grazed plot
Undurshireet
lightly grazed plot
Undurshireet
heavily grazed plot
Ikhtamir lightly grazed plot – 30 14 8
Ikhtamir medium grazed plot 0.674 – 12 7
Undurshireet lightly grazed plot 0.252 0.237 – 32
Undurshireet heavily grazed plot 0.158 0.154 0.561 –
Table 5
Similarity of study plots by vegetation as calculated by shared species (above diagonal) and Sorensen’s index (below diagonal).
Ikhtamir lightly
grazed plot
Ikhtamir medium
grazed plot
Undurshireet
lightly grazed plot
Undurshireet
heavily grazed plot
Ikhtamir lightly grazed plot – 11 3 3
Ikhtamir medium grazed plot 0.275 – 2 2
Undurshireet lightly grazed plot 0.14 0.118 – 9
Undurshireet heavily grazed plot 0.133 0.111 0.643 –
Table 6
Indicator species analysis. Given are species names, indicator groups (1 = ungrazed plot, 2 = grazed plot), indicator values,standard deviation, as well p-values of the Random-
ization Test.
Species Indicator group Indicator value
(observed)
Indicator value
(randomized)
S.dev p-Value
Panchrysia dives 1 33.3 15.4 5.52 0.0092
Gastropacha quercifolia 1 36.8 21.5 6.49 0.0282
Lymantria dispar 1 54.8 31.8 6.6 0.0044
Mythimna conigera 1 33.3 15.4 5.44 0.0082
Stigmatophora micans 1 32.4 17.1 5.93 0.0244
Autographa buraetica 2 31.6 13.3 4.87 0.0078
Selagia argyrella 1 49.6 26.1 7.13 0.007
Leucoma sulicis 2 37 20 4.93 0.0464
Pelochrista arabescana 2 40.5 24.1 7.3 0.0236
Perconai strigillaria 1 38 19 4.54 0.0044
Mythimna impura 2 31.6 13.5 4.97 0.0082
6. 672 K. Enkhtur et al. / Ecological Indicators 72 (2017) 667–674
SP49 SP71
SP72
SP116
-2.5 -2.0 -1.5 -1.0 -0.5 0.0 0.5 1.0 1.5
NMDS1
-1.0
-0.8
-0.6
-0.4
-0.2
0.0
0.2
0.4
0.6
0.8
1.0
1.2
1.4
NMDS2
UN (LG,13)
UN (LG,15)
UN (HG,13)
UN (HG,15)
IKH (LG,13)
IKH (HG,13)
Species
Fig. 4. Results of the Nonmetric Multidimensional Scaling analysis. We took samples from each plot of Undurshireet and Ikhtamir during 10 nights in 2013 and additional
samples in Undurshireet in 2015. Sampling nights of medium grazed (MG) and lightly grazed (LG) plots of Ikhtamir clustered together and showed distinct groupings, while
sampling nights of heavily grazed (HG) and lightly grazed (LG) plots of Undurshireet Soum were overlapping in range. In this figure indicator species are coinciding with the
plot where they have been caught: sp. 49 − Gastropacha quercifolia, sp. 71 − Mythimna conigera, sp. 116 − Stigmatophora micans, sp. 72 − Mythimna impura. UN − Undurshireet
and IKH − Ikhtamir.
0.140 and HG with MG 0.111), thus corroborating the expected
differences in habitat type (see methods).
3.5. Indicator species
As a result of the indicator species analysis Panchrysia dives, Gas-
tropacha quercifolia, Selagia argyrella, Lymantria dispar, Mythimna
conigera, Stigmatophora micans and Perconia strigillaria were iden-
tified as indicator species for LG plots, while Leucoma salicis,
Autographa buraetica, Mythimna impura and Pelochrista arabescana
were identified as indicator species of HG and MG plots (Table 6,
Appendix Fig. A2 in Supplementary material). The distribution of
some indicator species in the multidimensional space is shown in
Fig. 4.
4. Discussion
Our results demonstrate that moths are suitable indicators of
grazing pressure in Mongolia. A large number of similar studies
from other countries support our findings. Compared to HG plots,
LG plots harbored a higher species diversity of moths in Scotland
(Littlewood, 2008), Canada (Bachand et al., 2014) and in Finland
(Pöyry et al., 2005). In Germany micromoths had higher diver-
sity in ungrazed plots and lower diversity in grazed plots (Rickert
et al., 2012). In Canada plants and moths provide complemen-
tary bio-indication of ecosystem condition under various herbivore
densities in a study of ecosystem recovery after reduction of large
herbivores (deer) (Bachand et al., 2014). Large herbivores influ-
ence the composition and diversity of steppe habitats (Manier and
Hobbs, 2006), with direct impact on moths.
In abandoned or lightly grazed pastures arthropod species rich-
ness was higher than in moderately and highly stocked plots
(Rickert et al., 2012; Klink et al., 2013; Yadamsuren et al., 2015). But
after long abandonment of meadows some arthropod and vegeta-
tion species disappear (Klink et al., 2013). Thus rotational grazing
can be a useful tool to restore butterfly and moth communities of
abandoned pastures (Pöyry et al., 2004). Livestock grazing alters
composition and structure of vegetation (Lkhagva et al., 2013) and
thus impacts phytophagous species such as Lepidoptera. Livestock
grazing disturbance influences moth species diversity and species
richness more negatively than plant species richness and vegeta-
tion structure (Rickert et al., 2012). Grazing influences arthropods
negatively in general, by affecting arthropods directly and indi-
rectly by unintentional eating, trampling, reducing food sources
and disturbing their living habitat (Klink et al., 2015). But, the effects
of grazing were not the same for all moth species (Littlewood,
2008). For example, in our study some species were even more
abundant in grazed plots, such as Loxostege sticticalis, Anarta trifolii
and Pelochrista arabescana. The growing number of livestock has a
negative impact on grasses (Monocotyledonae) that are their pre-
ferred food and the resulting expansion of dicotyledonous plants
in the grassland and the arable lands might also contribute to the
outbreaks of some moth species such as Loxostege sticticalis, which
prefer herbs to grasses (Lizhi et al., 2009).
When we calculated species diversity of plants of both plots in
Ikhtamir, plant species diversity of the LG plot was seven times
higher than that of the HG plot. This result for plants matched our
result on moths (Table 4).
In our study indicator species included members of the
Noctuidae, Arctiidae, Lasiocampidae, Lymantriidae, Pyralidae, Tor-
tricidae, and Geometridae. In LG plots Stigmatophora micans
(Arctiidae), Perconia strigillaria (Geometridae), Lymantria dis-
par (Lymantriidae), Gastropacha quercifolia3 (Lasiocampidae) and
Selagia argyrella (Pyralidae) were abundant, while in HG plots
Autographa buraetica (Noctuidae) and Pelochrista arabescana (Tor-
tricidae) were present in abundant numbers. Noctuids Panchrysia
dives and Mythimna conigera were found exclusively in LG plots at
both sites, thus being the most important bioindicators for exten-
sive grazing in our study, although they were recorded in lower
total abundance than other species. In Europe M. conigera is known
3
In Russia Gastropacha quercifolia is listed in the Red Book and considered a rare
species (Antipova, 2013).
7. K. Enkhtur et al. / Ecological Indicators 72 (2017) 667–674 673
as widespread indicator of extensively used grasslands and is miss-
ing in slurry treated meadows; its larvae feed on grasses (Wagner,
2005). In Britain this moth is also evaluated as a decling species
(Conrad et al., 2006). Pelochrista arabescana, on the other hand,
may be the best indicator for overgrazed sites and was found in
both study areas in higher abundances. The larvae of this species
are known to feed on Artemisia species (Liu and Li, 2002), which are
considered pasture weeds and overgrazing indicators (Bazha et al.,
2012).
Because the impact of grazing on species’ populations is dif-
ferent and little is known about the life history of most of the
indicator species, we can only speculate why certain species act
as indicators. In Lymantria dispar for example, females preferen-
tially deposit their eggs in large cocoon-covered colonies on rock
outcrops and shrubs within the steppe (Hauck et al., 2008). These
nests may be directly impacted by trampling of livestock, so L. dispar
is a bioindicator for LG plots, although it is an important defoliator
of broad-leaved and coniferous trees and does not feed on grasses.
In Leucoma salicis, an indicator for HG plots, on the other hand, lar-
vae feed on Salix and Populus species (Seitz, 1912–1913); the use of
those woody plants may help the larvae of Leucoma salicis to avoid
negative direct impact of large herbivore grazing. Mythimna moth
species feed on various grasses, while Perconia strigillaria prefers
herbs (http://ukmoths.org.uk/).
Working in Gangotri Landscape, India, to study diversity and
indicator species of moth assemblages in different vegetation
zones, Sanyal et al. (2011) revealed six indicator species from six
different vegetation zones, and indicator moths came from families
of Arctiidae, Noctuidae, Lymantriidae, Pyralidae and Crambidae.
This high diversity of indicator species is similar to our findings.
In all plots Loxostege sticticalis was the most abundant species
and in the HG plots the number of individuals of this species was
two times higher than in the LG plot. This may be due to the weed
species Chenopodium album, the preferred food plant of L. sticticalis
that was growing in high density in the HG plots and was used
for oviposition (see Yin et al., 2005). In recent years the number
and frequency of outbreaks of this species have been increasing
with potential links to global warming through a decrease in the
proportion of diapausing larvae because of the raise of tempera-
ture in July. Loxostege sticticalis is an important outbreak pest in
Northern China, causing serious damage to crops and forage such
as soybean, sugar beet, alfalfa and sunflower, and leading to severe
harvest losses. The adults from this area make a long-range migra-
tion in two ways, within the border of China or outside (Mongolia)
into Northeast China (Xiao et al., 2008).
The wide distribution of these Palaearctic species potentially
allows an application of our findings to other regions. However,
care should be taken to ensure that bio-indicators inhabit the same
niche in different areas. Livestock species, local grazing schemes
and pattern of grazing area vs. surroundings may greatly differ
among countries and further impact the usage of the bioindicators
we identified in Mongolia. However, we clearly demonstrated that
herbivorous moths are an accurate indicator for overgrazed and
less grazed plots, that may even lead to better indication results
compared to arthropod groups from different trophic levels and
with different life histories (ants, beetles) that are less exposed
to direct competition and indirect side effects of grazing (tram-
pling). Bioindicator plants (Best and Bork, 2003) and epiphytic
lichens (Hauck and Lkhagvadorj, 2013), on the other hand, are dif-
ficult to monitor: sometimes it is hard to find them, and it is even
more complicated to assure their absence in a given area. Moths
are attracted over larger distances and can thus integrate infor-
mation from a larger area. When good weather conditions allow
for abundant sampling results, moths are a superior bioindicator
taxa.
5. Conclusion
Our study suggests that pasture degradation affects species
diversity of moths negatively. As evidenced by indicator species
analysis and moth diversity, different treatments of the plots influ-
enced the moth species community composition significantly. High
grazing pressure negatively impacts certain moth species directly
or indirectly and possibly endangers them. Panchrysia dives and
Mythimna conigera were best indicators for lightly grazed plots,
together with Lymantria dispar and Selagia argyrella. Other moth
species showed a positive response to overgrazing, Autographa
buraetica and Pelochrista arabescana could be identified as bioindi-
cators for that. These results demonstrate that moths are valuable
indicator species for pasture quality. In order to sustain maximum
moth diversity pasture management should be rotational, if in one
area pasture is being restored, grazing can proceed in an another
area. More research is necessary to include more locations and
better information on the life history of species if we want to for-
mally establish this method as an agricultural practice in Mongolia.
Improved monitoring methods can help to reduce the impact of
overgrazing when this information is included in management
plans that are accepted by local herders.
Acknowledgements
We thank the Phase IV of Green Gold Project funded by the
Swiss Development Cooperation Agency for supporting our field
work, and the German Society for International Cooperation (GIZ)
for funding of equipment. We are very grateful to T. Enkhbayar for
helping in identification and verification of moth species and thank
M. Uuganbayar for taking samples from Ikhtamir Soum, Arkhangai
Aimag. Moreover we are thankful to R. Tungalag for verifying our
plant species. M.P. is grateful to the German Academic Exchange
Service (DAAD) for supporting his stay in Mongolia (Grant No.
11000351). K.E. and B.B. thank the Taylor Family-Asia Foundation
Endowed Chair in Ecology and Conservation Biology, which partly
supported this study. We appreciate the English language correc-
tion by Eli Hornstein, NC State University, Raleigh, USA and the
comments of Associate Editor Dr. Roland Achtziger and of an anony-
mous reviewer.
Appendix A. Supplementary data
Supplementary data associated with this article can be found,
in the online version, at http://dx.doi.org/10.1016/j.ecolind.2016.
08.053.
References
Antipova, L.F., 2013. Rare and protected species of butterflies (Insecta,
Lepidoptera), found in Pskov region. Pskov Region J. 15, 102–122 [in Russian].
Axmacher, J.C., Liu, Y., Wang, C., Li, L., Yu, Z., 2011. Spatial ␣-diversity patterns of
diverse insect taxa in Northern China: lessons for biodiversity conservation.
Biol. Conserv. 144 (9), 2362–2368.
Bachand, M., Pellerin, S., Côté, S.D., Moretti, M., De Cáceres, M., Brousseau, P.-M.,
Cloutier, C., Hébert, C., Cardinal, É., Martin, J.-L., Poulin, M., 2014. Species
indicators of ecosystem recovery after reducing large herbivore density:
comparing taxa and testing species combinations. Ecol. Indic. 38, 12–19.
Bazha, S.N., Gunin, P.D., Danzhalova, E.V., Drobyshev, Y.I., Prishcepa, A.V., 2012.
Pastoral degradation of steppe ecosystems in central Mongolia. In: Werger,
M.J.A., van Staalduinen, M.A. (Eds.), Eurasian Steppes. Ecological Problems and
Livelihoods in a Changing World. Springer, pp. 289–320.
Berlov, E., Berlov, O., 1999–2014. 1000 Siberian Butterflies and Moths, Retrieved
from http://www.catocala.narod.ru, (accessed on 10.06.15).
Best, J.N., Bork, E.W., 2003. Using transplanted plains rough fescue (Festuca hallii
(Vasey) Piper) as an indicator of grazing in Elk Island National Park, Canada.
Nat. Areas J. 23, 202–209.
Chognii, O., 1978. The main principle of alter and rehabilitation of pasture of
Dornod Khangai. In: Second Volume of Flora and Vegetation Study of
Mongolian People’s Republic. Ulaanbaatar khot. Academy of Science,
Ulaanbaatar (in Mongolian), pp. 191.
8. 674 K. Enkhtur et al. / Ecological Indicators 72 (2017) 667–674
Choi, S.W., Chun, J.H., 2009. Combined effect of environmental factors on
distribution of Geometridae (Lepidoptera) in South Korea. Eur. J. Entomol. 106
(1), 69–76.
Conrad, K.F., Warren, M.S., Fox, R., Parsons, M.S., Woiwod, I.P., 2006. Rapid declines
of common: widespread British moths provide evidence of an insect
biodiversity crisis. Biol. Conserv. 132, 279–291.
Dufrêne, M., Legendre, P., 1997. Species assemblages and indicator species: the
need for a flexible asymmetrical approach. Ecol. Monogr. 67 (3), 345–366.
Fernandez-Gimenez, M.E., Allen-Diaz, B., 1999. Testing a non-equilibrium model of
rangeland vegetation dynamics in Mongolia. J. Appl. Ecol. 36, 871–885, http://
dx.doi.org/10.1046/j.1365-2664.1999.00447.x.
Folcher, L., Weissenberger, A., Delos, M., 2012. Quantitative relationships between
Ostrinia nubilalis activity and deoxynivalenol contamination in French maize.
Int. J. Pest Manage. 58 (4), 302–309.
Fuentes-Montemayor, E., Goulson, D., Park, K.J., 2011. The effectiveness of
agri-environment schemes for the conservation of farmland moths: assessing
the importance of a landscape-scale management approach. J. Appl. Ecol. 48,
532–542.
Gerlach, J., Samways, M., Pryke, J., 2013. Terrestrial invertebrates as bioindicators:
an overview of available taxonomic groups. J. Insect Conserv. 17, 831–850.
Green Gold Project, 2015. National report on rangeland health of Mongolia. In:
Guide to the Moths of Great Britain and Ireland, Retrieved from http://www.
ukmoths.org.uk, (accessed on 12.07.15).
Hauck, M., Lkhagvadorj, D., 2013. Epiphytic lichens as indicators of grazing
pressure in the Mongolian forest-steppe. Ecol. Indic. 32, 82–88.
Hauck, M., Dulamsuren, C., Heimes, C., 2008. Effects of insect herbivory on the
performance of Larix sibirica in a forest-steppe ecotone. Environ. Exp. Bot. 62,
351–356.
Hilker, T., Natsagdorj, E., Waring, R.H., Lyapustin, A., Wang, Y., 2014. Satellite
observed widespread decline in Mongolian grasslands largely due to
overgrazing. Global Change Biol. 20, 418–428.
Hoffmann, B.D., 2010. Using ants for rangeland monitoring: global patterns in the
responses of ant communities to grazing. Ecol. Indic. 10, 105–111.
Itämies, J.H., Leinonen, R., Meyer-Rochow, V.B., 2011. Climate Change and Shifts in
the Distribution of Moth Species in Finland, with a Focus on the Province of
Kainuu. InTech Open Access Publisher.
Jigjidsuren, S., 2005. Pasture Management. Admon Publishing, Ulaanbaatar
Mongolia.
Jost, L., 2006. Entropy and diversity. Oikos 113, 363–375.
Kaltsas, D., Trichas, A., Kougioumoutzis, K., Chatzaki, M., 2013. Ground beetles
respond to grazing at assemblage level, rather than species-specifically: the
case of Cretan shrublands. J. Insect Conserv. 17, 681–697.
Kitching, R.L., Orr, A.G., Thalib, L., Mitchell, H., Hopkins, M.S., Graham, A.W., 2000.
Moth assemblages as indicators of environmental quality in remnants of
upland Australian rain forest. J. Appl. Ecol. 37 (2), 284–297.
Klink, R.V., Rickert, C., Vermeulen, R., Vorst, O., Wallis De Vries, M.F., Bakker, J.P.,
2013. Grazed vegetation mosaics do not maximize arthropod diversity:
evidence from salt marshes. Biol. Conserv. 164, 150–157.
Klink, R.V., van der Plas, F., van Noordwijk, C.G.E., Wallis DeVries, M.F., Olff, H.,
2015. Effects of large herbivores on grassland arthropod diversity. Biol. Rev. 90
(2), 347–366.
Kononenko, V., 2010. Noctuidae Sibirica, 2. Entomological Press.
Kroupa, M., Spitzer, K., Novak, I., 1990. The heavy metals content in melanic and
typical forms of Biston betularia (Lepidoptera, Geometridae) and its
bioindicator significance. Acta Entomol. Bohemoslov. 87 (4),
249–252.
Lawton, J.H., Gaston, K.J., 2001. Indicator species. Encycl. Biodivers. 3, 437–450.
Lera, P.A., 2005. Identification key of Insects of Far East, Russia. T. V. Trichoptera
and Lepidoptera.Volume 5. Влɑдивоctок: «Дɑльhɑyкɑ».
Littlewood, N.A., 2008. Grazing impacts on moth diversity and abundance on a
Scottish upland estate. Insect Conserv. Diver. 1 (3), 151–160.
Liu, Y.Q., Li, G.W., 2002. Fauna Sinica Insecta. Lepidoptera, Tortricidae, 27. Chinese
Science Press, pp. 463.
Lizhi, L., Shaozhe, H., Xingfu, J., Lei, Z., 2009. Characteristics and causes for the
outbreaks of beet webworm, Loxostege sticticalis in northern China during
2008. J. Plant Prot. 1, 009.
Lkhagva, A., Boldgiv, B., Goulden, C.E., Yadamsuren, O., Lauenroth, W.K., 2013.
Effects of grazing on plant community structure and aboveground net primary
production of semiarid boreal steppe of northern Mongolia. Grassland Sci. 59,
135–145.
Lkhagvadorj, D., Hauck, M., Dulamsuren, C., Tsogtbaatar, J., 2013. Twenty years
after decollectivization: mobile livestock husbandry and its ecological impact
in the Mongolian forest-steppe. Hum. Ecol. 41 (5), 725–735.
Lund, M.P., Rahbek, C., 2002. Cross-taxon congruence in complementarity and
conservation of temperate biodiversity. Anim. Conserv. 5, 163–171.
Maleque, M.A., Maeto, K., Ishii, H.T., 2009. Arthropods as bioindicators of
sustainable forest management, with a focus on plantation forests. Appl.
Entomol. Zool. 44 (1), 1–11.
Manier, D.J., Hobbs, N.T., 2006. Large herbivores influence the composition and
diversity of shrub-steppe communities in the Rocky Mountains, USA.
Oecologia 146 (4), 641–651.
McCune, B., Mefford, M.J., 2011. PC-ORD. Multivariate Analysis of Ecological Data.
Version 5. MjM Software, Gleneden Beach, Oregon, U.S.A. Mongolian.
Mongolian Society for Range Management, 2009. Livelihood Studies of Herders in
Mongolia: Draft study report. Unpublished internal report. Ulaanbaatar.
Mongolia.
Namkhaidorj, B., Puntsagdulam, J. and Mygmarsuren, D., 2008. Identification key of
Insects of Mongolia, Volume II, second part.
Namkhaidorj, B., 1981. Method of Collecting, Treating and Preserving of Insects.
National Publishing.
National Registration and Statistical Office of Mongolia, 2015, Monthly Bulletin of
Statistics, Ulaanbaatar.
Niemelä, J., Langor, D., Spence, J.R., 1993. Effects of clearäcut harvesting on boreal
groundäbeetle assemblages (Coleoptera: Carabidae) in Western Canada.
Conserv. Biol. 7 (3), 551–561.
Oksanen, J., Blanchet, G.F., Kindt, R., Legendre, P., Minchin, P.R., O’Hara, B.R.,
Simpson, G.L., Solymos, P., Stevens, M.H.H., Wagner, H., 2013. Vegan:
Community Ecology Package. R package version 2. 0–10.
Pöyry, J., Lindgren, S., Salminen, J., Kuussaari, M., 2004. Restoration of butterfly and
moth communities in semi-natural grasslands by cattle grazing. Ecol. Appl. 14,
1656–1670.
Pöyry, J., Lindgren, S., Salminen, J., Kuussaari, M., 2005. Responses of butterfly and
moth species to restored cattle grazing in semi-natural grasslands. Biol.
Conserv. 122 (3), 465–478.
Rákosy, L., Schmitt, T., 2011. Are butterflies and moths suitable ecological indicator
systems for restoration measures of semi-natural calcareous grassland
habitats? Ecol. Indic. 11, 1040–1045.
Rapport, D.J., Costanza, R., McMichael, A.J., 1998. Assessing ecosystem health.
Trends Ecol. Evol. 13 (10), 397–402.
Rickert, C., Fichtner, A., van Klink, R., Bakker, J.P., 2012. ␣- and -diversity in moth
communities in salt marshes is driven by grazing management. Biol. Conserv.
146, 24–31.
Sanyal, A.K., Uniyal, V.P., Chandra, K., Bhardwaj, M., 2011. Diversity and indicator
species of moth (Lepidoptera: Heterocera) assemblages in different vegetation
zones in Gangotri landscape, Western Himalaya, India, Envis Bulletin:
Arthropods and their Conservation in India (Insects & Spiders) pp. 114–129.
Seitz, A. Ed.,1912-1913. Die Großschmetterlinge der Erde, Verlag Alfred Kernen,
Stuttgart Band 2: Abt. 1, Die Großschmetterlinge des palaearktischen
Faunengebietes: Die palaearktischen Spinner und Schwärmer.
Summerville, K.S., Ritter, L.M., Crist, T.O., 2004. Forest moth taxa as indicators of
lepidopteran richness and habitat disturbance: a preliminary assessment. Biol.
Conserv. 116 (1), 9–18.
Svyatoslav, K.A., 2000. Electronic Atlas of Lepidoptera of Omsk Field, Retrieved
from http://www.omflies.narod.ru, (accessed on 14.06.15).
Tsegmid, Sh., Institute of Geography − Cryopedology, MAS, 1969. Physical
geography of Mongolia. Ulaanbaatar, Republic of Mongolia (In Mongolian).
Verdú, J.R., Moreno, C.E., Sánchez-Rojas, G., Numa, C., Galante, E., Halffter, G., 2007.
Grazing promotes dung beetle diversity in the xeric landscape of a Mexican
Biosphere Reserve. Biol. Conserv. 140, 308–317.
Wagner, W. 2005–2016. Europäische Schmetterlinge und ihre Ökologie
−Mythimna conigera. Donwloaded at 02.07.2016 from http://www.pyrgus.de/
Mythimna conigera.html.
Walser, J.-C., Holderegger, R., Gugerli, F., Hoebee, S.E., Scheidegger, C., 2005.
Microsatellites reveal regional population differentiation and isolation in
Lobaria Pulmonaria, an epiphytic lichen. Mol. Ecol. 14 (2), 457–467.
Wang, Y., Wesche, K., 2016. Vegetation and soil responses to livestock grazing in
Central Asian grasslands: a review of Chinese literature. Biodivers. Conserv.,
1–20, http://dx.doi.org/10.1007/s10531-015-1034-1.
Williams, E.R., Mulligan, D.R., Erskine, P.D., Plowman, K.P., 2012. Using insect
diversity for determining land restoration development: examining the
influence of grazing history on ant assemblages in rehabilitated pasture. Agric.
Ecosyst. Environ. 163, 54–60.
Wirooks, L., 2006. Zum Flächenbezug von Lichtfangartenspektren (Lepidoptera,
Macroheterocera). Mitt. Dtsch. Ges. Allg. Angew. Ent. 15, 403–408.
Xiao, C., Baoping, Z., Ruijie, G., Minghao, Y., You, Z., Kuijun, Z., 2008. Source area of
spring population of meadow moth, Loxostege sticticalis L. (Lepidoptera:
Pyralidae), in Northeast China. Acta Ecol. Sin. 28 (4), 1521–1535.
Yadamsuren, O., Hayford, B., Gelhaus, J., Ariuntsetseg, L., Goulden, C., Podenas, S.,
Podeniene, V., 2015. Declines in diversity of crane flies (Diptera: Tipuloidea)
indicate impact from grazing by livestock in the Hövsgöl region of Mongolia. J.
Insect Conserv. 19 (3), 465–477.
Yin, J., Cao, Y.Z., Luo, L.Z., Hu, Y., 2005. Oviposition preference of the meadow moth,
Loxostege sticticalis L., on different host plants and its chemical mechanism.
Acta Ecol. Sin. 25 (8), 1844–1852.
Yunatov, A.A., 1976. Main Features of Vegetation Cover of the Mongolian People
Republic. Ulaanbaatar, Mongolia.