SlideShare ist ein Scribd-Unternehmen logo
1 von 50
Global Multiple Natural Hazards Risk Landscape and
Climate Change Regionalization in the World
Peijun Shi
State Key Laboratory of Earth Surface Processes and Resource Ecology
Key Laboratory of Environmental Change and Natural Disasters of Ministry of Education
Academy of Disaster Reduction and Emergency Management, Ministry of Civil Affairs and Ministry of Education
Beijing Normal University
China
spj@bnu.edu.cn
29-08-2016
International Disaster and Risk Conference Davos 2016,Integrative Risk Management - towards resilient cities
28 August - 1 September 2016 • Davos • Switzerland
Plenary 3: Green Development and Integrated Risk Governance Room: Davos I
4:55pm- 5:55pm, 29 August 2016
24-05-2016
3rd
ASTAAG Meeting OUTLINE
Global Multiple Natural Hazards Risk Landscape
Climate Change Regionalization in the World
24-05-2016
3rd
ASTAAG Meeting
Background
The seven global targets are
(a) Substantially reduce global disaster mortality by 2030, aiming to lower the average per100,000
global mortality rate in the decade 2020–2030 compared to the period 2005–2015;
(b) Substantially reduce the number of affected people globally by 2030, aiming to lowerthe average
global figure per 100,000 in the decade 2020–2030 compared to the period 2005–2015;9
(c) Reduce direct disaster economic loss in relation to global gross domestic product (GDP) by 2030;
(d) Substantially reduce disaster damage to critical infrastructure and disruption of basic services,
among them health and educational facilities, including through developing their resilience by 2030;
(e) Substantially increase the number of countries with national and local disaster risk reduction
strategies by 2020;
(f) Substantially enhance international cooperation to developing countries through adequate and
sustainable support to complement their national actions for implementation of the present
Framework by 2030;
(g) Substantially increase the availability of and access to multi-hazard early warning systems and
disaster risk information and assessments to people by 2030.
24-05-2016
3rd
ASTAAG Meeting Background
Multi-hazard risk
Multi-hazard risk assessment aims at assessing the total risk of
various types of hazards happened in a given region and in a certain
period of time (Shi, 2009).Since the 1980s, many organizations
around the world have carried out in-depth research on multi-hazard
risk assessment, and attempted risk mapping at regional and global
scales.
24-05-2016
3rd
ASTAAG Meeting Background
Multi-hazard risk
United Nations Development Program (UNDP)
evaluated for the first time, the vulnerability of hazards
based on eight social indicators including economy, type of
economic activity, environmental quality and reliance,
population, health and sanitation, early warning, education
and development at national level, and put forward the
disaster risk index (DRI) to calculate the mortality risk due
to four hazards including earthquake, cyclone, flood and
drought (UNDP, 2004).
24-05-2016
3rd
ASTAAG Meeting Background
Multi-hazard risk
World Bank and Columbia University
evaluated the vulnerability of multi- hazards and
calculated the risk of mortality and economic
loss caused by six hazards including earthquakes,
volcanoes, landsides, floods, drought and
cyclones according to the historical loss data in
EM-DAT (Emergency Events Database) at
2.5°×2.5° scale (Dilley et.al, 2004).
24-05-2016
3rd
ASTAAG Meeting Background
Multi-hazard risk
United Nations University evaluated
vulnerability at national level based on 28
indicators from three aspects, i.e., sensitivity,
coping capacity and adaptability, and calculated
the mortality risk due to five hazards including
earthquake, flood, cyclone, drought and sea level
rise by using the product of exposure and
vulnerability as world risk index (WRI) (UNU,
2013).
24-05-2016
3rd
ASTAAG Meeting Background
Multi-hazard risk
In 2014, European Union Joint Research
Centre(JRC) developed INFORM (index for risk
management) model, with which it evaluated the
hazards & exposure, vulnerability and lack of
coping capacity of every country in the world on
the basis of 53 indicators and obtained the
dynamic risk ranking of 191 countries through
annual database updating (JRC, 2014).
24-05-2016
3rd
ASTAAG Meeting
Methods
Earthquake Volcano Landslide
Wildfires
Tropical Cyclone Sand-Dust Storm
Flood Storm Surge Drought
Heat WaveCold Wave
Geophysical
Hydrological
Wind
Temperature
Wildfires
Multiple Natural Hazards Based on the above study, this work presents a
multi-hazard risk assessment model of mortality and
GDP loss. This model is aimed to establish the
relationship among historical disaster mortality or
GDP loss ratios, the intensity level of multi-hazard
and GDP per capita or population to determine the
expected annual mortality or GDP loss rate, and then
develop vulnerability assessment model to calculate
the expected annual mortality risk and GDP loss risk
due to multi- hazards. The annual expected mortality
and GDP loss represent the risk level to multi-hazard,
which is composed of 11 single hazards, including
earthquake, landslide, volcano, flood, storm surge,
tropical cyclone, sand-dust storm, drought, heat
wave, cold wave and wildfires.
24-05-2016
3rd
ASTAAG Meeting
Methods
Multi-hazard risk
Multi-hazard risk assessment aims at assessing the total risk of various
types of hazards happened in a given region and in a certain period of time
(Shi, 2009).Since the 1980s, many organizations around the world have
carried out in-depth research on multi-hazard risk assessment, and
attempted risk mapping at regional and global scales.
24-05-2016
3rd
ASTAAG Meeting
Data and Methods
Dataset Data Source Resolution Time
Expected Multi-Hazard Intensity Index
(Mh)
World Atlas of Natural Disaster Risk
(Shi and Kasperson 2015)
0.5⁰×0.5⁰ –
Death Toll and Affected Population Emergency Events Database (EM-DAT
2015)
National unit
scale
1980–2014
Population and GDP Density
(Grid Unit)
Greenhouse Gas Initiative (GGI) Program
of the International Institute for Applied
Systems Analysis (IIASA 2005)
0.5⁰×0.5⁰ 2000, 2010, 2020, and
2030†
Population and GDP (National scale) World Bank (2015) National 1980–2014
Note: †In the GGI database, the time interval of population and GDP data is ten years, therefore the population and
GDP data in 2005 and 2015 are represented by the average values of 2000 and 2010 and of 2010 and 2020, respectively.
Table 1 Sources and description of the datasets used for
calculating global mortality risk and affected population risk
Dataset
24-05-2016
3rd
ASTAAG Meeting
Methods
i Natural Hazard Expected Annual Intensity Index Weight (%)
1 Floods
Accumulated three-day extreme
precipitation (mm)
35.86
2 Tropical cyclones Speed of 3-second gust wind (m/s) 30.23
3 Earthquakes Peak ground acceleration (m/s2) 9.03
4 Landslides Landslide hazard index 5.65
5
Droughts (maize)
Normalized cumulative water stress
index during the crop’s growing season
2.10
Droughts (wheat) 0.52
Droughts (rice) 1.73
6 Heat waves Maximum temperature (°C) 1.77
7 Cold waves Largest temperature drop (°C) 2.99
8 Volcanos Volcanic explosivity index 2.21
9
Wildfires (forest)
Ignition probability (%)
1.38
Wildfires
(grassland)
1.04
10 Storm surges Maximum inundation area (km2) 0.88
11
Sand and dust
storms
Energy of sand/dust storm (J/ m3)
0.31
Table 2 Hazard intensity index and weight of each hazard when
calculating Expected Annual Intensity Index(Mh)
1
n
i imin
h i
i imax imin
h h
M w
h h

 


Natural Hazards
where hi is the expected annual intensity index of
hazard i—for example, the expected annual intensity
of cold wave is the expectation of the largest
temperature drop (°C) with return periods of 10, 20, 50,
and 100 years at each 0.5°×0.5° grid unit (Shi and
Kasperson 2015); himin and himax are the minimum and
maximum values of the expected annual intensity of
hazard i, respectively; wi is the weight of hazard i,
which was calculated based on the frequency of
hazards in EM-DAT (EM-DAT 2015) and Zheng (2009)
Expected Annual Multi-hazard Intensity
Index(Mh)
24-05-2016
3rd
ASTAAG Meeting
Methods
Expected Annual Multi-
hazard Intensity Index ( )
(National Unit Scale)
Exposure
GDPp, Population (0.5⁰×0.5⁰)
2005–2015, 2020–2030
Average Annual Affected
Population Rate (National
Unit Scale, 1980–2009)
GDP Per Capita (GDPp)
(National Unit Scale, 1980–
2009)
Regression Model
Mortality Risk and Affected Population Risk (0.5⁰×0.5⁰)
2005–2015, 2020–2030
Average Annual Mortality
Rate (National Unit Scale,
1980–2009)
Dependent Variable Independent VariableIndependent Variable
Natural
Factor
Natural
Factor
Social
Factor
Social
Factor
Vulnerability Function
AR = f (Mh, GDPp)
MR = g (Mh, GDPp)
Hazard
Mh
(0.5⁰×0.5⁰)
Average Annual Mortality and
Affected Population
(National Unit Scale, 2010–
2014)
ValidationValidation
hM
Framework
Fig. 1 Flowchart for calculating
the global mortality and affected
population risks for multiple
natural hazards
24-05-2016
3rd
ASTAAG Meeting
Methods
Vulnerability function
Social factor: Coping capacity index Natural factor: Mh
Sig = 0.01; N = 171; R² = 0.65
0
1
2
3
4
5
6
7
8
9
10
0.00 10.00 20.00 30.00 40.00 50.00 60.00
INFORMIndex-LackofCopingCapacity
GDP per capita, Purchasing Power Parity, 2014
[current international thousand $]
Pearson's cc = -0.719
 ,h pMR f M GDP
 ,h pAR g M GDP
where MR is the mortality rate for multiple
natural hazards; AR is the affected population
rate for multi-hazards;
Fig. 2 Comparison of INFORM 2015 Lack of Coping
Capacity Index with GDP per capita
Source JRC (2014)
Vulnerability is a measure of both the sensitivity
of population to natural hazards and its ability to
respond to and recover from the impacts of those
hazards
24-05-2016
3rd
ASTAAG Meeting
Methods
Vulnerability function
MR/AR in EM-DAT disaster database between 1980 and 2009 was selected as training
sample
  6
ln 9.77 10 9.371 14.512p hMR GDP M
      
  4
ln 1.58 10 7.73 5.984p hAR GDP M
      
Same database between 2010 and 2014 was selected as validation sample
Pearson correlation coefficients of 0.45 (mortality) and 0.68 (affected population) (166
countries were included in the analysis since the mortality and affected population data
of other countries are not recorded for this period)
(Sig=0.01)
24-05-2016
3rd
ASTAAG Meeting
Methods
Total Risk and validation
where RM is the mortality risk for multiple
natural hazards (persons per year); RA is the
affected population risk for multiple natural
hazards (persons per year); and POP is the
total population of a country or region.
 6
9.77 10 9.371 14.512p hGDP M
MR POP e

     
 
 4
1.58 10 7.73 5.984p hG
A
DP M
R POP e

     
 
Expected Annual Multi-
hazard Intensity Index ( )
(National Unit Scale)
Exposure
GDPp, Population (0.5⁰×0.5⁰)
2005–2015, 2020–2030
Average Annual Affected
Population Rate (National
Unit Scale, 1980–2009)
GDP Per Capita (GDPp)
(National Unit Scale, 1980–
2009)
Regression Model
Mortality Risk and Affected Population Risk (0.5⁰×0.5⁰)
2005–2015, 2020–2030
Average Annual Mortality
Rate (National Unit Scale,
1980–2009)
Dependent Variable Independent VariableIndependent Variable
Natural
Factor
Natural
Factor
Social
Factor
Social
Factor
Vulnerability Function
AR = f (Mh, GDPp)
MR = g (Mh, GDPp)
Hazard
Mh
(0.5⁰×0.5⁰)
Average Annual Mortality and
Affected Population
(National Unit Scale, 2010–
2014)
ValidationValidation
hM
24-05-2016
3rd
ASTAAG Meeting
Methods
Multiple Climatic Hazards
MCh
(National Unit Scale)
POP, GDP and GDPP
(0.5⁰×0.5⁰, 2015)
GDP Per Capital (GDPp),
Population (POP)
(National Unit Scale,
1980–2009)
Binary
Linear
Regression
Model
Mortality, Affected Population and GDP Loss Risk
for Multiple Climatic Hazards (0.5⁰×0.5⁰)
Average Annual Mortality
Rate (National Unit Scale,
1980–2009)
Dependent Variable Independent VariableIndependent Variable
Climate FactorClimate Factor
Social FactorSocial Factor
AR = f (Mch, GDPp)
MR = g (Mch, GDPp)
GR= h (Mch, POP)
MCh
(0.5⁰×0.5⁰)
Vulnerability Fuction Exposure
CRI,Average Annual Death Toll,
Affected Population and GDP Loss
(National Unit Scale, 2010–2014)
ValidationValidation
Hazard
Average Annual Affected
Population Rate (National
Unit Scale, 1980–2009)
Average Annual GDP Loss
Rate (National Unit Scale,
1980–2009)
 5
1.32 10 6.10 15.48p chGDP M
gridMR POP e

     
 
5
( 1.28 10 7.20 7.77)p chGDP M
gridAR POP e

     
 
5
( 1.02 10 8.30 7.69)p chGDP M
gridGR GDP e

    
 
where 𝑀𝑐ℎ is the average value of Multiple climatic hazards
intensity of the country or region; RM is the expected annual
mortality risk for multiple climatic hazards (people per year);
RA is the expected annual affected population risk for
multiple climatic hazards (people per year); RG is the
expected annual GDP loss risk for multiple climatic hazards
(USD per year); GDPgrid is GDP data at grid scale;
and 𝑃𝑂𝑃𝑔𝑟𝑖𝑑is the population data at grid scale.
24-05-2016
3rd
ASTAAG Meeting
Results
Global expected annual mortality rate for multiple natural hazards (2020–2030) 0.5°×0.5°
24-05-2016
3rd
ASTAAG Meeting
Results
Global expected annual mortality risk for multiple natural hazards (2020–2030) 0.5°×0.5°
24-05-2016
3rd
ASTAAG Meeting
Results
Global expected annual affected population rate for multiple natural hazards (2020–2030) 0.5°×0.5°
24-05-2016
3rd
ASTAAG Meeting
Results
Global expected annual affected population risk for multiple natural hazards (2020–2030) 0.5°×0.5°
24-05-2016
3rd
ASTAAG Meeting
Results
𝑀ℎ Expected Annual Mortality Rate Expected Annual Affected Population Rate
Rank Country Name
Index†
Value
Rank Country Name
Rate (per 105
people per
year)
Rank Country Name
Rate (per 105
people per
year)
1 Bangladesh 0.395 1 Philippines 3.57 1 Bangladesh 5329
2 Vietnam 0.340 2 Bangladesh 2.20 2 Philippines 5043
3 Laos 0.322 3 Vietnam 1.45 3 Vietnam 3237
4 Belize 0.322 4 Laos 1.16 4 Madagascar 2703
5 Guatemala 0.315 5 Japan 1.16 5 Laos 2702
6 Burma 0.303 6 Burma 1.08 6 Bhutan 2679
7 Philippines 0.301 7 South Korea 1.01 7 Guatemala 2094
8 South Korea 0.294 8 Belize 1.00 8 Burma 2058
9 Madagascar 0.286 9 Bhutan 0.98 9 Nepal 1885
10
Papua New
Guinea
0.278 10 Madagascar 0.93 10 Dominican Republic 1852
Ranking of 𝑀ℎ, expected annual mortality rate, and expected annual affected population rate
for multi-hazards at the national scale in descending order (2020–2030)
24-05-2016
3rd
ASTAAG Meeting
Results
Global Expected Annual Mortality Rate for Multiple Climatic Hazards (0.5°×0.5°)
24-05-2016
3rd
ASTAAG Meeting
Results
Global Expected Annual Affected Population Rate for Multiple Climatic Hazards (0.5°×0.5°)
24-05-2016
3rd
ASTAAG Meeting
Results
Global Expected Annual GDP Loss Rate for Multiple Climatic Hazards (0.5°×0.5° )
24-05-2016
3rd
ASTAAG Meeting
Results
Top fifteen countries with highest expected annual mortality rate, affected population rate and GDP loss rate for
multiple climatic hazards
Expected annual mortality rate Expected annual affected population rate Expected annual GDP loss rate
Rank Country Name
Per million people per
year
Rank Country Name
Per thousand people
per year
Rank Country Name % per year
1 Philippines 6.87 1 Philippines 31.55 1 Philippines 7.53%
2 Bangladesh 4.16 2 Bangladesh 16.14 2 Bangladesh 3.05%
3 Vietnam 3.56 3 Vietnam 13.83 3 Vietnam 2.68%
4 Laos 2.61 4 Laos 9.49 4 Bhutan 1.66%
5
South Korea 2.47
5
South Korea 8.98
5
New Caledonia 1.66%
6
Madagascar 2.40
6
New Caledonia 8.91
6
Lao PDR 1.62%
7 Belize 2.38 7 Belize 8.49 7 Korea, Rep. 1.62%
8
New Caledonia 2.38
8
Madagascar 8.47
8
Japan 1.60%
9 Dominican
Republic
2.08
9
Japan 8.13
9
Madagascar 1.53%
10
Japan 2.08
10 Dominican
Republic
7.19
10
Belize 1.50%
11 Burma 2.02 11 Burma 7.08 11 China 1.33%
12 Papua New
Guinea
1.88
12 Papua New
Guinea
6.40
12
Dominican Republic 1.24%
13 Guatemala 1.76 13 Bhutan 6.09 13 Myanmar 1.16%
14
Bhutan 1.75
14
Guatemala 5.86
14
Papua New Guinea 1.12%
15
North Korea 1.60
15
China 5.44
15
Guatemala 0.94%
24-05-2016
3rd
ASTAAG Meeting
Validation
0
500
1000
1500
2000
2500
0 500 1000 1500 2000 2500
AverageAnnualDeathTolls
(EM-DAT,2010-2014)
Expected Annual Mortality Risk
(Mch model)
Person CC=0.898;
Sig=0.01; N=123
Comparison of the expected annual mortality risk (𝑀𝑐ℎ
model) and the historical disaster data in EM-DAT
0
2
4
6
8
10
0 2 4 6 8 10
AverageAnnualAffectedPopulation
(EM-DAT,2010-2014)
Millionpeolpe
Expected Annual Affected Population Risk
(Mch model)
Million peolpe
Person CC=0.940;
Sig=0.01; N=123
Comparison of the expected annual affected
population risk (Mch model) and the historical disaster
data in EM-DAT
24-05-2016
3rd
ASTAAG Meeting
Validation
0
20
40
60
80
100
120
140
160
0 20 40 60 80 100 120 140 160
TherankofCRIeconomiclossscore1994-2013
The rank of the GDP loss score in Mch model
Spearman CC= 0.737;
Sig=0.01;N=135
Comparison of the rank of CRI (Germanwatch program) economic loss score and the rank of the
GDP loss score in Mch model
24-05-2016
3rd
ASTAAG Meeting OUTLINE
Global Multiple Natural Hazards Risk Landscape
Climate Change Regionalization in the World
Temperature tendency
Spatial distribution of temperature tendency values (1961–2010)
Temperature data are from Monthly Mean Surface Dataset (2.5° resolution, from 01/1948 to present) of NCEP/NCAR Reanalysis provided by U.S. National
Oceanic and Atmospheric Administration
Temperature fluctuation
Spatial distribution of temperature fluctuation values (1961–2010)
Temperature data are from Monthly Mean Surface Dataset (2.5° resolution, from 01/1948 to present) of NCEP/NCAR Reanalysis provided by U.S. National
Oceanic and Atmospheric Administration
Precipitation tendency
Spatial distribution of precipitation tendency values (1961–2010)
Monthly Dataset (0.5° resolution, from 01/1901 to present) of GPCC provided by U.S. National Oceanic and Atmospheric Administration, while precipitation
data of Antarctic continent is filled by NCEP/NCAR Reanalysis Dataset because of missing data.
Precipitation fluctuation
Spatial distribution of precipitation fluctuation values (1961–2010)
Temperature data are from Monthly Mean Surface Dataset (2.5° resolution, from 01/1948 to present) of NCEP/NCAR Reanalysis provided by U.S. National
Oceanic and Atmospheric Administration
World Regionalization of Climate
Change
Regionalization unit
Comparable geographic of world
Use state or province level administrative regionalization of countries as the basic unit
Global Land Elevation
Global 30 Arc-Second Elevation dataset (1 kilometer resolution) provided by the United States Geological Survey (https://lta.cr.usgs.gov/GTOPO30).
World Regionalization of Climate Change (1961-2010)
World Regionalization of Climate
Change
World Regionalization of Climate Change (1961-2010)
World Regionalization of Climate
Change
Confidence Test
Classified statistic of proportion of area under different confidences among indicators (%)
Classification of Modes
Classification of Modes of Climate Change of the world (1961-2010)
Tendency and fluctuation of temperature and precipitation of the world are identified under the given confidence of 90% (significance level 0.1)
Modes of Temperature Change
(area proportion (%))
Modes of Precipitation Change
(area proportion (%))
SHI Peijun etal., Article title: World Regionalization of Climate Change (1961–2010) ,
International Journal of Disaster Risk Science [J]. 2016,DOI: 10.1007/s13753-016-0094-5
Trade-off risk
(Trend)
Uncertainty risk
(Fluctuation)
Extreme risk
(extreme events)
he composition of the climate change risk
(Shi, 2014)
Family
Community
Institu
tes
Governments
Local
Regiona
lGloba
l
Place
Integration
Coordination
Cooperation
Construction
Communication
mitigation
adaptatio
n
Government: Development and Disaster Reduction (Governance)
Community: Safety Construction (Legislation)
Institute: Risk Transformation (Mechanism)
Family: Risk Awareness (Education)
Forming integrated CCR governance
paradigm
Toward the measurement of synergistic adaptation by
using the concept of Consilience (凝聚力)
Government Institute Interprise Individual
Nation
City
Province
County
Planning
Finance
Professional
Civil
State-owned
Community
Private
Joint Venture Children
Youth
Middle-Ager
Age
Extraction
Consilience
Integreted System
Communication
Construction
Cooperation
Coordination
Society
Economy
Culture
Politics
Consilience Model for Integrated DS
Governance
Consilience
resilience
vulnerabilityadaptation
社会—生态系统风险防范的“凝聚力模型
Consilience model for integrated social-ecosystem risk
governance
h
b
构件间无摩擦情况: 极限荷载 ∝ W=bX2h3/6
构件间协同工作情况: 极限荷载 ∝ W=bX(2h)3/6
如果n个构件协同工作,极限荷载增加n2倍。
协同放大原理示意图
Collaborative amplification
假定,单根无缺陷承载力为100,有缺陷为50,那么,
系统A的极限承载力为50X4=200;
系统B的极限承载力至少100X3=300。
①
②
③
④
系统A 系统B
协同分散原理示意图
Collaborative
diversification
协同约束原理示意图
Collaborative
constraint
协同宽容原理示意图
Collaborative tolerance
来源:http://www.hnhfgl.com/ps124.htm
工程中,为了使钢制绳索
满足大变形、抗冲击和易成卷
捆扎等需求,多股钢丝以一定
的规则绞合成钢绞线,钢绞线
的力学原理体现了本文所述
的“协同宽容”内涵。
具体表现在:(一)所有
钢丝遵循统一原则进行绞合,
体现对规则的宽容;(二)在
对规则宽容的前提下,整体钢
绞线形成对大变形和冲击荷
载更高的宽容性;(三)钢绞
线拥有单根钢丝所不具备的
良好的工作性能,极大提升其
包装、运输、应用方面的宽容
性。
24-05-2016
3rd
ASTAAG Meeting
共识最高
成本最低
福利最大
风险最小
协同宽容
协同约束
协同放大
协同分散
社会认知
普及化
成本分摊
合理化
组合优化
智能化
费用效益
最大化
综
合
风
险
防
范
的
凝
聚
力
社
会
-
生
态
系
统
风险转移
基本设防
应急管理 救灾救济
备灾
重建
应急响应 恢复
综
合
风
险
防
范
协
同
运
作
制
度
设
计
经济结构
生态结构
产业结构 土地结构
生态系统
服务功能
区域发展
调节功能
环境友好
保护功能
资源节约
保障功能
目标 原理 实现手段 适应措施 制度调整 产出
社会-生态系统综合风险防范的凝聚力模式
Consilience mode of integrated risk governance for social – ecological systems
23-08-2016
1st
ASTCDRR
Discussion
1
n
h i i
i
M H w

 
Expected Annual Multi-hazard Intensity Index(Mh)
The weight of measurement methods led to different risk assessment. Hence, how to
calculate the adequately Wi would be the key issue of natural hazards risk assessment. To
achieve that, greater amounts of data and further research are needed.
Peijun SHI, Xu Yang,Wei Xu, Jing’ai Wang. Mapping Global Mortality and Affected Population Risks for Multiple Natural Hazards [J].
International Journal of Disaster Risk Science, 2016, 7(1): 54-62.
SHI Peijun, YANG Xu, FANG Jiayi, WANG Jing’ai, XU Wei, HAN Guoyi,Mapping and ranking global mortality, affected population and GDP loss
risks for multiple climatic hazards [J]. Journal of Geographical Sciences, 2016, 26(7): 878-888.
Discussion
Disaster Risk Science is a multidisciplinary science
that studys formation mechanism, dynamic change,
assessment model, emergency response, and
governance paradigm of disaster system. It may be
classified into disaster science, emergency
technology and risk management based on view of
theory, methodology and technology.
Peijun SHI, Xu Yang,Wei Xu, Jing’ai Wang. Mapping Global Mortality and Affected Population Risks for Multiple
Natural Hazards [J]. International Journal of Disaster Risk Science, 2016, 7(1): 54-62.
SHI Peijun, YANG Xu, FANG Jiayi, WANG Jing’ai, XU Wei, HAN Guoyi,Mapping and ranking global mortality, affected
population and GDP loss risks for multiple climatic hazards [J]. Journal of Geographical Sciences, 2016, 26(7): 878-
888.
SHI Peijun etal., Article title: World Regionalization of Climate Change (1961–2010) , International Journal of Disaster
Risk Science [J]. 2016,DOI: 10.1007/s13753-016-0094-5
Peijun Shi, Ning Li, Qian Ye, Wenjie Dong, Guoyi Han, and Weihua Fang. Research on Integrated Disaster Risk
Governance in the Context of Global Environmental Change[J]. International Journal of Disaster Risk Science,
2010,1(1): 17-23.
Peijun Shi. On the role of government in integrated disaster risk governance— Based on practices in China.
International Journal of Disaster Risk Science[J], 3(3)(2012):139-146
Pjun Shi, Qian Ye, Guoyi Han et al. Living with global climate diversity— suggestions on international governance for
coping with climate change risk[J]. International Journal of Disaster Risk Science, 3(4)(2012):177-183.
Peijun Shi, Jiabing Shuai, Wenfang Chen, Lili Lu. Study on Large-Scale Disaster Risk Assessment and Risk Transfer
Models[J]. International Journal of Disaster Risk Science, 2010,1(2): 1-8.
References
Thank you!

Weitere ähnliche Inhalte

Was ist angesagt?

Was ist angesagt? (20)

Wadid Erian 25 Aug 5 00 _ Syria-Drought Risk & Resilience_ IDRC14
Wadid Erian 25 Aug  5 00 _ Syria-Drought Risk & Resilience_ IDRC14Wadid Erian 25 Aug  5 00 _ Syria-Drought Risk & Resilience_ IDRC14
Wadid Erian 25 Aug 5 00 _ Syria-Drought Risk & Resilience_ IDRC14
 
Roles of Scientific Commuinities in Disaster Risk Reduction Solutions Perspec...
Roles of Scientific Commuinities in Disaster Risk Reduction Solutions Perspec...Roles of Scientific Commuinities in Disaster Risk Reduction Solutions Perspec...
Roles of Scientific Commuinities in Disaster Risk Reduction Solutions Perspec...
 
Gas Flaring, Climate Change and the Nigeria Case, Obafemi A.P OLUKOYA
Gas Flaring, Climate Change and the Nigeria Case, Obafemi A.P OLUKOYAGas Flaring, Climate Change and the Nigeria Case, Obafemi A.P OLUKOYA
Gas Flaring, Climate Change and the Nigeria Case, Obafemi A.P OLUKOYA
 
Global Alliance of Disaster Research Institutes - Hirokazu TATANO
Global Alliance of Disaster Research Institutes - Hirokazu TATANOGlobal Alliance of Disaster Research Institutes - Hirokazu TATANO
Global Alliance of Disaster Research Institutes - Hirokazu TATANO
 
Neussner assessment
Neussner assessmentNeussner assessment
Neussner assessment
 
Introducing EPIC_CamilleBuyck_Final
Introducing EPIC_CamilleBuyck_FinalIntroducing EPIC_CamilleBuyck_Final
Introducing EPIC_CamilleBuyck_Final
 
HADIDIAN MOGHADAM-Aviation industry and its actions on crisis management proc...
HADIDIAN MOGHADAM-Aviation industry and its actions on crisis management proc...HADIDIAN MOGHADAM-Aviation industry and its actions on crisis management proc...
HADIDIAN MOGHADAM-Aviation industry and its actions on crisis management proc...
 
IRGC Guidelines for Emerging Risk Governance, Marie-Valentine FLORIN
IRGC Guidelines for Emerging Risk Governance, Marie-Valentine FLORINIRGC Guidelines for Emerging Risk Governance, Marie-Valentine FLORIN
IRGC Guidelines for Emerging Risk Governance, Marie-Valentine FLORIN
 
OECD EU Expert Meeting on Disaster Loss Data, 26-28 October 2016
OECD EU Expert Meeting on Disaster Loss Data, 26-28 October 2016OECD EU Expert Meeting on Disaster Loss Data, 26-28 October 2016
OECD EU Expert Meeting on Disaster Loss Data, 26-28 October 2016
 
IDRC14-ppp-template_Berariu
IDRC14-ppp-template_BerariuIDRC14-ppp-template_Berariu
IDRC14-ppp-template_Berariu
 
ENGELBACH-Indicators to compare simulated crisis management strategies-ID1065...
ENGELBACH-Indicators to compare simulated crisis management strategies-ID1065...ENGELBACH-Indicators to compare simulated crisis management strategies-ID1065...
ENGELBACH-Indicators to compare simulated crisis management strategies-ID1065...
 
UNISDR Scientific and Technical Advisory Group (STAG) Platform and Network Su...
UNISDR Scientific and Technical Advisory Group (STAG) Platform and Network Su...UNISDR Scientific and Technical Advisory Group (STAG) Platform and Network Su...
UNISDR Scientific and Technical Advisory Group (STAG) Platform and Network Su...
 
JEU_EERI_GRF_25Aug2014
JEU_EERI_GRF_25Aug2014JEU_EERI_GRF_25Aug2014
JEU_EERI_GRF_25Aug2014
 
Morocco - the Way Forward in Risk Management, Nour-Eddine BOUTAYEB
Morocco - the Way Forward in Risk Management, Nour-Eddine BOUTAYEBMorocco - the Way Forward in Risk Management, Nour-Eddine BOUTAYEB
Morocco - the Way Forward in Risk Management, Nour-Eddine BOUTAYEB
 
2018 DRR Financing 2.1 Andy Palmer
2018 DRR Financing 2.1 Andy Palmer2018 DRR Financing 2.1 Andy Palmer
2018 DRR Financing 2.1 Andy Palmer
 
Ex-Ante Risk Assessment, Annegret Thieken
Ex-Ante Risk Assessment, Annegret Thieken Ex-Ante Risk Assessment, Annegret Thieken
Ex-Ante Risk Assessment, Annegret Thieken
 
2018 DRR Financing 3.1 Karina Whalley
2018 DRR Financing 3.1 Karina Whalley2018 DRR Financing 3.1 Karina Whalley
2018 DRR Financing 3.1 Karina Whalley
 
SPEAK Social media and crisis communication during cascading disasters, Elisa...
SPEAK Social media and crisis communication during cascading disasters, Elisa...SPEAK Social media and crisis communication during cascading disasters, Elisa...
SPEAK Social media and crisis communication during cascading disasters, Elisa...
 
H2020 Oasis project and its implications for the future of EU policy to promo...
H2020 Oasis project and its implications for the future of EU policy to promo...H2020 Oasis project and its implications for the future of EU policy to promo...
H2020 Oasis project and its implications for the future of EU policy to promo...
 
BRENDER-Economic considerations in risk management-ID1485-IDRC2014_b
BRENDER-Economic considerations in risk management-ID1485-IDRC2014_bBRENDER-Economic considerations in risk management-ID1485-IDRC2014_b
BRENDER-Economic considerations in risk management-ID1485-IDRC2014_b
 

Andere mochten auch

Andere mochten auch (20)

How to efficiently manage corruption risks in an organization with 23,000 peo...
How to efficiently manage corruption risks in an organization with 23,000 peo...How to efficiently manage corruption risks in an organization with 23,000 peo...
How to efficiently manage corruption risks in an organization with 23,000 peo...
 
Stress Testing Cities - How to Live and Plan with New Risks, Theo KOETTER
Stress Testing Cities - How to Live and Plan with New Risks, Theo KOETTERStress Testing Cities - How to Live and Plan with New Risks, Theo KOETTER
Stress Testing Cities - How to Live and Plan with New Risks, Theo KOETTER
 
The Role of New and Traditional Media in Alerting and Risk Communication, Bri...
The Role of New and Traditional Media in Alerting and Risk Communication, Bri...The Role of New and Traditional Media in Alerting and Risk Communication, Bri...
The Role of New and Traditional Media in Alerting and Risk Communication, Bri...
 
The Role of Media in Disaster Risk Reduction From the Experience of the Great...
The Role of Media in Disaster Risk Reduction From the Experience of the Great...The Role of Media in Disaster Risk Reduction From the Experience of the Great...
The Role of Media in Disaster Risk Reduction From the Experience of the Great...
 
Risk Communication by Government and the Role of the Social Media in Crisis C...
Risk Communication by Government and the Role of the Social Media in Crisis C...Risk Communication by Government and the Role of the Social Media in Crisis C...
Risk Communication by Government and the Role of the Social Media in Crisis C...
 
The Role of the Media in Risk Communication, Sidika TEKELI-YESIL
The Role of the Media in Risk Communication, Sidika TEKELI-YESILThe Role of the Media in Risk Communication, Sidika TEKELI-YESIL
The Role of the Media in Risk Communication, Sidika TEKELI-YESIL
 
Global Environmental Risk and its Governance Consilience Mode, Shi PEIJUN
Global Environmental Risk and its Governance Consilience Mode, Shi PEIJUNGlobal Environmental Risk and its Governance Consilience Mode, Shi PEIJUN
Global Environmental Risk and its Governance Consilience Mode, Shi PEIJUN
 
Linkages in Disasters A Perspective on Migrants Inclusivity in Disaster Risk ...
Linkages in Disasters A Perspective on Migrants Inclusivity in Disaster Risk ...Linkages in Disasters A Perspective on Migrants Inclusivity in Disaster Risk ...
Linkages in Disasters A Perspective on Migrants Inclusivity in Disaster Risk ...
 
Social Capital and Disaster Resilience A Canadian Case Study, Niru NIRUPAMA
Social Capital and Disaster Resilience A Canadian Case Study, Niru NIRUPAMASocial Capital and Disaster Resilience A Canadian Case Study, Niru NIRUPAMA
Social Capital and Disaster Resilience A Canadian Case Study, Niru NIRUPAMA
 
Development & Application of Ichi-Nichi-Mae Project for Disaster Awareness If...
Development & Application of Ichi-Nichi-Mae Project for Disaster Awareness If...Development & Application of Ichi-Nichi-Mae Project for Disaster Awareness If...
Development & Application of Ichi-Nichi-Mae Project for Disaster Awareness If...
 
Who Can Save our Cultural Heritage in Time of War, Laila MOUSTAFA
Who Can Save our Cultural Heritage in Time of War, Laila MOUSTAFAWho Can Save our Cultural Heritage in Time of War, Laila MOUSTAFA
Who Can Save our Cultural Heritage in Time of War, Laila MOUSTAFA
 
The Influence of Public Awareness and Transparency on Corporate Governance an...
The Influence of Public Awareness and Transparency on Corporate Governance an...The Influence of Public Awareness and Transparency on Corporate Governance an...
The Influence of Public Awareness and Transparency on Corporate Governance an...
 
Using Social Media and Digital Volunteers for Building Cross-border Disaster ...
Using Social Media and Digital Volunteers for Building Cross-border Disaster ...Using Social Media and Digital Volunteers for Building Cross-border Disaster ...
Using Social Media and Digital Volunteers for Building Cross-border Disaster ...
 
Risks of Industry 4.0 - An Information Technology Perspective, Thomas USLÄNDER
Risks of Industry 4.0 - An Information Technology Perspective, Thomas USLÄNDERRisks of Industry 4.0 - An Information Technology Perspective, Thomas USLÄNDER
Risks of Industry 4.0 - An Information Technology Perspective, Thomas USLÄNDER
 
Methods and Compliance Programs for Anti-Corruption, Pascal HANS
Methods and Compliance Programs for Anti-Corruption, Pascal HANSMethods and Compliance Programs for Anti-Corruption, Pascal HANS
Methods and Compliance Programs for Anti-Corruption, Pascal HANS
 
Migrants in Disasters, Specific Conditions of Vulnerability, Lorenzo GUADAGNO
Migrants in Disasters, Specific Conditions of Vulnerability, Lorenzo GUADAGNOMigrants in Disasters, Specific Conditions of Vulnerability, Lorenzo GUADAGNO
Migrants in Disasters, Specific Conditions of Vulnerability, Lorenzo GUADAGNO
 
The Next Frontier of Behavioural Risk Management in Tough Guy, Macho Organiza...
The Next Frontier of Behavioural Risk Management in Tough Guy, Macho Organiza...The Next Frontier of Behavioural Risk Management in Tough Guy, Macho Organiza...
The Next Frontier of Behavioural Risk Management in Tough Guy, Macho Organiza...
 
Migrants, Asylum Seekers and Refugees with Disabilities in the Context of Maj...
Migrants, Asylum Seekers and Refugees with Disabilities in the Context of Maj...Migrants, Asylum Seekers and Refugees with Disabilities in the Context of Maj...
Migrants, Asylum Seekers and Refugees with Disabilities in the Context of Maj...
 
Risk Reduction or Redistribution and Exacerbation, An Exploration of Barriers...
Risk Reduction or Redistribution and Exacerbation, An Exploration of Barriers...Risk Reduction or Redistribution and Exacerbation, An Exploration of Barriers...
Risk Reduction or Redistribution and Exacerbation, An Exploration of Barriers...
 
Exploring the Future of Resilience and Mitigation to Better Plan for Disaster...
Exploring the Future of Resilience and Mitigation to Better Plan for Disaster...Exploring the Future of Resilience and Mitigation to Better Plan for Disaster...
Exploring the Future of Resilience and Mitigation to Better Plan for Disaster...
 

Ähnlich wie Global Multiple Natural Hazards Risk Landscape and Climate Change Regionalization in the World, Peijun SHI

COP21_WeatherDisastersReport_2015_FINAL
COP21_WeatherDisastersReport_2015_FINALCOP21_WeatherDisastersReport_2015_FINAL
COP21_WeatherDisastersReport_2015_FINAL
Sherie Amor
 
nclimate2893_auproof
nclimate2893_auproofnclimate2893_auproof
nclimate2893_auproof
Jaap Kwadijk
 
Promoting Climate Risk Reduction through Risk Insurance
Promoting Climate Risk Reduction through Risk InsurancePromoting Climate Risk Reduction through Risk Insurance
Promoting Climate Risk Reduction through Risk Insurance
Prabhakar SVRK
 
WMO - Disaster Risk Reduction Programme
WMO - Disaster Risk Reduction ProgrammeWMO - Disaster Risk Reduction Programme
WMO - Disaster Risk Reduction Programme
UNISDR
 
DRM Webinar II: Governing and managing disaster risk in the agriculture secto...
DRM Webinar II: Governing and managing disaster risk in the agriculture secto...DRM Webinar II: Governing and managing disaster risk in the agriculture secto...
DRM Webinar II: Governing and managing disaster risk in the agriculture secto...
FAO
 
2.5.2 Introduction to quantitative climate risk analysis - Muehlhofer
2.5.2 Introduction to quantitative climate risk analysis - Muehlhofer2.5.2 Introduction to quantitative climate risk analysis - Muehlhofer
2.5.2 Introduction to quantitative climate risk analysis - Muehlhofer
NAP Events
 

Ähnlich wie Global Multiple Natural Hazards Risk Landscape and Climate Change Regionalization in the World, Peijun SHI (20)

Where and What Kind of Weather Insurance Indexes Could be Potentially Used fo...
Where and What Kind of Weather Insurance Indexes Could be Potentially Used fo...Where and What Kind of Weather Insurance Indexes Could be Potentially Used fo...
Where and What Kind of Weather Insurance Indexes Could be Potentially Used fo...
 
The Global Risk Analysis for the 2009 GAR
The Global Risk Analysis for the 2009 GARThe Global Risk Analysis for the 2009 GAR
The Global Risk Analysis for the 2009 GAR
 
COP21_WeatherDisastersReport_2015_FINAL
COP21_WeatherDisastersReport_2015_FINALCOP21_WeatherDisastersReport_2015_FINAL
COP21_WeatherDisastersReport_2015_FINAL
 
nclimate2893_auproof
nclimate2893_auproofnclimate2893_auproof
nclimate2893_auproof
 
Regions - Hazards - People
Regions - Hazards - PeopleRegions - Hazards - People
Regions - Hazards - People
 
Promoting Climate Risk Reduction through Risk Insurance
Promoting Climate Risk Reduction through Risk InsurancePromoting Climate Risk Reduction through Risk Insurance
Promoting Climate Risk Reduction through Risk Insurance
 
Summary - Lecture 9: Urban Disaster Risk Reduction
Summary - Lecture 9: Urban Disaster Risk ReductionSummary - Lecture 9: Urban Disaster Risk Reduction
Summary - Lecture 9: Urban Disaster Risk Reduction
 
Multi-layered comprehensive climate risk management (CRM) in Austria – connec...
Multi-layered comprehensive climate risk management (CRM) in Austria – connec...Multi-layered comprehensive climate risk management (CRM) in Austria – connec...
Multi-layered comprehensive climate risk management (CRM) in Austria – connec...
 
WMO - Disaster Risk Reduction Programme
WMO - Disaster Risk Reduction ProgrammeWMO - Disaster Risk Reduction Programme
WMO - Disaster Risk Reduction Programme
 
Risk assessment across DRR and CCA communities: opportunities and gaps - Jaro...
Risk assessment across DRR and CCA communities: opportunities and gaps - Jaro...Risk assessment across DRR and CCA communities: opportunities and gaps - Jaro...
Risk assessment across DRR and CCA communities: opportunities and gaps - Jaro...
 
IBIMET Heat WAVE resiliency
IBIMET Heat WAVE resiliency IBIMET Heat WAVE resiliency
IBIMET Heat WAVE resiliency
 
The Factors Affecting Institutional Performance in Disaster Management in Oma...
The Factors Affecting Institutional Performance in Disaster Management in Oma...The Factors Affecting Institutional Performance in Disaster Management in Oma...
The Factors Affecting Institutional Performance in Disaster Management in Oma...
 
DRM Webinar II: Governing and managing disaster risk in the agriculture secto...
DRM Webinar II: Governing and managing disaster risk in the agriculture secto...DRM Webinar II: Governing and managing disaster risk in the agriculture secto...
DRM Webinar II: Governing and managing disaster risk in the agriculture secto...
 
Analysis of Long-term Variations of Wind Speed and Haze in Beijing-Tianjin-He...
Analysis of Long-term Variations of Wind Speed and Haze in Beijing-Tianjin-He...Analysis of Long-term Variations of Wind Speed and Haze in Beijing-Tianjin-He...
Analysis of Long-term Variations of Wind Speed and Haze in Beijing-Tianjin-He...
 
Global Climate Risk Index 2014
Global Climate Risk Index 2014Global Climate Risk Index 2014
Global Climate Risk Index 2014
 
Haiti and the Global climate risk index 2014
Haiti and the Global climate risk index 2014Haiti and the Global climate risk index 2014
Haiti and the Global climate risk index 2014
 
2018 DRR Financing 1.3 Rosalind Cook
2018 DRR Financing 1.3 Rosalind Cook2018 DRR Financing 1.3 Rosalind Cook
2018 DRR Financing 1.3 Rosalind Cook
 
WEF: The Global Risks Report 2020
WEF: The Global Risks Report 2020WEF: The Global Risks Report 2020
WEF: The Global Risks Report 2020
 
2.5.2 Introduction to quantitative climate risk analysis - Muehlhofer
2.5.2 Introduction to quantitative climate risk analysis - Muehlhofer2.5.2 Introduction to quantitative climate risk analysis - Muehlhofer
2.5.2 Introduction to quantitative climate risk analysis - Muehlhofer
 
Global climate risk index 2019
Global climate risk index 2019Global climate risk index 2019
Global climate risk index 2019
 

Mehr von Global Risk Forum GRFDavos

Mehr von Global Risk Forum GRFDavos (20)

Disaster Risk Management Knowledge Centre, Brian Doherty
Disaster Risk Management Knowledge Centre, Brian DohertyDisaster Risk Management Knowledge Centre, Brian Doherty
Disaster Risk Management Knowledge Centre, Brian Doherty
 
Disaster risk reduction and nursing - human science research the view of surv...
Disaster risk reduction and nursing - human science research the view of surv...Disaster risk reduction and nursing - human science research the view of surv...
Disaster risk reduction and nursing - human science research the view of surv...
 
Global alliance of disaster research institutes (GADRI) discussion session, A...
Global alliance of disaster research institutes (GADRI) discussion session, A...Global alliance of disaster research institutes (GADRI) discussion session, A...
Global alliance of disaster research institutes (GADRI) discussion session, A...
 
Towards a safe, secure and sustainable energy supply the role of resilience i...
Towards a safe, secure and sustainable energy supply the role of resilience i...Towards a safe, secure and sustainable energy supply the role of resilience i...
Towards a safe, secure and sustainable energy supply the role of resilience i...
 
Making Hard Choices An Analysis of Settlement Choices and Willingness to Retu...
Making Hard Choices An Analysis of Settlement Choices and Willingness to Retu...Making Hard Choices An Analysis of Settlement Choices and Willingness to Retu...
Making Hard Choices An Analysis of Settlement Choices and Willingness to Retu...
 
The Relocation Challenges in Coastal Urban Centers Options and Limitations, A...
The Relocation Challenges in Coastal Urban Centers Options and Limitations, A...The Relocation Challenges in Coastal Urban Centers Options and Limitations, A...
The Relocation Challenges in Coastal Urban Centers Options and Limitations, A...
 
C&A Save the Children Urban DRR Project, Ray KANCHARLA
C&A Save the Children Urban DRR Project, Ray KANCHARLAC&A Save the Children Urban DRR Project, Ray KANCHARLA
C&A Save the Children Urban DRR Project, Ray KANCHARLA
 
Involving the Mining Sector in Achieving Land Degradation Neutrality, Simone ...
Involving the Mining Sector in Achieving Land Degradation Neutrality, Simone ...Involving the Mining Sector in Achieving Land Degradation Neutrality, Simone ...
Involving the Mining Sector in Achieving Land Degradation Neutrality, Simone ...
 
Disaster Risk Reduction and Nursing - Human Science research the view of surv...
Disaster Risk Reduction and Nursing - Human Science research the view of surv...Disaster Risk Reduction and Nursing - Human Science research the view of surv...
Disaster Risk Reduction and Nursing - Human Science research the view of surv...
 
Training and awareness raising in Critical Infrastructure Protection & Resili...
Training and awareness raising in Critical Infrastructure Protection & Resili...Training and awareness raising in Critical Infrastructure Protection & Resili...
Training and awareness raising in Critical Infrastructure Protection & Resili...
 
IDRC Davos 2016 - Workshop Awareness Raising, Education and Training - Capaci...
IDRC Davos 2016 - Workshop Awareness Raising, Education and Training - Capaci...IDRC Davos 2016 - Workshop Awareness Raising, Education and Training - Capaci...
IDRC Davos 2016 - Workshop Awareness Raising, Education and Training - Capaci...
 
Capacity Development for DRR, Beatrice PROGIDA
Capacity Development for DRR, Beatrice PROGIDACapacity Development for DRR, Beatrice PROGIDA
Capacity Development for DRR, Beatrice PROGIDA
 
Dynamic factors influencing the post-disaster resettlement success Lessons fr...
Dynamic factors influencing the post-disaster resettlement success Lessons fr...Dynamic factors influencing the post-disaster resettlement success Lessons fr...
Dynamic factors influencing the post-disaster resettlement success Lessons fr...
 
Disaster Risk Perception in Cameroon and its Implications for the Rehabilitat...
Disaster Risk Perception in Cameroon and its Implications for the Rehabilitat...Disaster Risk Perception in Cameroon and its Implications for the Rehabilitat...
Disaster Risk Perception in Cameroon and its Implications for the Rehabilitat...
 
Systematic Knowledge Sharing of Natural Hazard Damages in Public-private Part...
Systematic Knowledge Sharing of Natural Hazard Damages in Public-private Part...Systematic Knowledge Sharing of Natural Hazard Damages in Public-private Part...
Systematic Knowledge Sharing of Natural Hazard Damages in Public-private Part...
 
Exploring the Effectiveness of Humanitarian NGO-Private Sector Collaborations...
Exploring the Effectiveness of Humanitarian NGO-Private Sector Collaborations...Exploring the Effectiveness of Humanitarian NGO-Private Sector Collaborations...
Exploring the Effectiveness of Humanitarian NGO-Private Sector Collaborations...
 
Can UK Water Service Providers Manage Risk and Resilience as Part of a Multi-...
Can UK Water Service Providers Manage Risk and Resilience as Part of a Multi-...Can UK Water Service Providers Manage Risk and Resilience as Part of a Multi-...
Can UK Water Service Providers Manage Risk and Resilience as Part of a Multi-...
 
A Holistic Approach Towards International Disaster Resilient Architecture by ...
A Holistic Approach Towards International Disaster Resilient Architecture by ...A Holistic Approach Towards International Disaster Resilient Architecture by ...
A Holistic Approach Towards International Disaster Resilient Architecture by ...
 
Architecture as a Catalyst for Sustainable Development, Anna HERINGER
Architecture as a Catalyst for Sustainable Development, Anna HERINGERArchitecture as a Catalyst for Sustainable Development, Anna HERINGER
Architecture as a Catalyst for Sustainable Development, Anna HERINGER
 
Study on the Impact of Economic Growth on Meteorological Disaster Losses in C...
Study on the Impact of Economic Growth on Meteorological Disaster Losses in C...Study on the Impact of Economic Growth on Meteorological Disaster Losses in C...
Study on the Impact of Economic Growth on Meteorological Disaster Losses in C...
 

Global Multiple Natural Hazards Risk Landscape and Climate Change Regionalization in the World, Peijun SHI

  • 1. Global Multiple Natural Hazards Risk Landscape and Climate Change Regionalization in the World Peijun Shi State Key Laboratory of Earth Surface Processes and Resource Ecology Key Laboratory of Environmental Change and Natural Disasters of Ministry of Education Academy of Disaster Reduction and Emergency Management, Ministry of Civil Affairs and Ministry of Education Beijing Normal University China spj@bnu.edu.cn 29-08-2016 International Disaster and Risk Conference Davos 2016,Integrative Risk Management - towards resilient cities 28 August - 1 September 2016 • Davos • Switzerland Plenary 3: Green Development and Integrated Risk Governance Room: Davos I 4:55pm- 5:55pm, 29 August 2016
  • 2. 24-05-2016 3rd ASTAAG Meeting OUTLINE Global Multiple Natural Hazards Risk Landscape Climate Change Regionalization in the World
  • 3. 24-05-2016 3rd ASTAAG Meeting Background The seven global targets are (a) Substantially reduce global disaster mortality by 2030, aiming to lower the average per100,000 global mortality rate in the decade 2020–2030 compared to the period 2005–2015; (b) Substantially reduce the number of affected people globally by 2030, aiming to lowerthe average global figure per 100,000 in the decade 2020–2030 compared to the period 2005–2015;9 (c) Reduce direct disaster economic loss in relation to global gross domestic product (GDP) by 2030; (d) Substantially reduce disaster damage to critical infrastructure and disruption of basic services, among them health and educational facilities, including through developing their resilience by 2030; (e) Substantially increase the number of countries with national and local disaster risk reduction strategies by 2020; (f) Substantially enhance international cooperation to developing countries through adequate and sustainable support to complement their national actions for implementation of the present Framework by 2030; (g) Substantially increase the availability of and access to multi-hazard early warning systems and disaster risk information and assessments to people by 2030.
  • 4. 24-05-2016 3rd ASTAAG Meeting Background Multi-hazard risk Multi-hazard risk assessment aims at assessing the total risk of various types of hazards happened in a given region and in a certain period of time (Shi, 2009).Since the 1980s, many organizations around the world have carried out in-depth research on multi-hazard risk assessment, and attempted risk mapping at regional and global scales.
  • 5. 24-05-2016 3rd ASTAAG Meeting Background Multi-hazard risk United Nations Development Program (UNDP) evaluated for the first time, the vulnerability of hazards based on eight social indicators including economy, type of economic activity, environmental quality and reliance, population, health and sanitation, early warning, education and development at national level, and put forward the disaster risk index (DRI) to calculate the mortality risk due to four hazards including earthquake, cyclone, flood and drought (UNDP, 2004).
  • 6. 24-05-2016 3rd ASTAAG Meeting Background Multi-hazard risk World Bank and Columbia University evaluated the vulnerability of multi- hazards and calculated the risk of mortality and economic loss caused by six hazards including earthquakes, volcanoes, landsides, floods, drought and cyclones according to the historical loss data in EM-DAT (Emergency Events Database) at 2.5°×2.5° scale (Dilley et.al, 2004).
  • 7. 24-05-2016 3rd ASTAAG Meeting Background Multi-hazard risk United Nations University evaluated vulnerability at national level based on 28 indicators from three aspects, i.e., sensitivity, coping capacity and adaptability, and calculated the mortality risk due to five hazards including earthquake, flood, cyclone, drought and sea level rise by using the product of exposure and vulnerability as world risk index (WRI) (UNU, 2013).
  • 8. 24-05-2016 3rd ASTAAG Meeting Background Multi-hazard risk In 2014, European Union Joint Research Centre(JRC) developed INFORM (index for risk management) model, with which it evaluated the hazards & exposure, vulnerability and lack of coping capacity of every country in the world on the basis of 53 indicators and obtained the dynamic risk ranking of 191 countries through annual database updating (JRC, 2014).
  • 9. 24-05-2016 3rd ASTAAG Meeting Methods Earthquake Volcano Landslide Wildfires Tropical Cyclone Sand-Dust Storm Flood Storm Surge Drought Heat WaveCold Wave Geophysical Hydrological Wind Temperature Wildfires Multiple Natural Hazards Based on the above study, this work presents a multi-hazard risk assessment model of mortality and GDP loss. This model is aimed to establish the relationship among historical disaster mortality or GDP loss ratios, the intensity level of multi-hazard and GDP per capita or population to determine the expected annual mortality or GDP loss rate, and then develop vulnerability assessment model to calculate the expected annual mortality risk and GDP loss risk due to multi- hazards. The annual expected mortality and GDP loss represent the risk level to multi-hazard, which is composed of 11 single hazards, including earthquake, landslide, volcano, flood, storm surge, tropical cyclone, sand-dust storm, drought, heat wave, cold wave and wildfires.
  • 10. 24-05-2016 3rd ASTAAG Meeting Methods Multi-hazard risk Multi-hazard risk assessment aims at assessing the total risk of various types of hazards happened in a given region and in a certain period of time (Shi, 2009).Since the 1980s, many organizations around the world have carried out in-depth research on multi-hazard risk assessment, and attempted risk mapping at regional and global scales.
  • 11. 24-05-2016 3rd ASTAAG Meeting Data and Methods Dataset Data Source Resolution Time Expected Multi-Hazard Intensity Index (Mh) World Atlas of Natural Disaster Risk (Shi and Kasperson 2015) 0.5⁰×0.5⁰ – Death Toll and Affected Population Emergency Events Database (EM-DAT 2015) National unit scale 1980–2014 Population and GDP Density (Grid Unit) Greenhouse Gas Initiative (GGI) Program of the International Institute for Applied Systems Analysis (IIASA 2005) 0.5⁰×0.5⁰ 2000, 2010, 2020, and 2030† Population and GDP (National scale) World Bank (2015) National 1980–2014 Note: †In the GGI database, the time interval of population and GDP data is ten years, therefore the population and GDP data in 2005 and 2015 are represented by the average values of 2000 and 2010 and of 2010 and 2020, respectively. Table 1 Sources and description of the datasets used for calculating global mortality risk and affected population risk Dataset
  • 12. 24-05-2016 3rd ASTAAG Meeting Methods i Natural Hazard Expected Annual Intensity Index Weight (%) 1 Floods Accumulated three-day extreme precipitation (mm) 35.86 2 Tropical cyclones Speed of 3-second gust wind (m/s) 30.23 3 Earthquakes Peak ground acceleration (m/s2) 9.03 4 Landslides Landslide hazard index 5.65 5 Droughts (maize) Normalized cumulative water stress index during the crop’s growing season 2.10 Droughts (wheat) 0.52 Droughts (rice) 1.73 6 Heat waves Maximum temperature (°C) 1.77 7 Cold waves Largest temperature drop (°C) 2.99 8 Volcanos Volcanic explosivity index 2.21 9 Wildfires (forest) Ignition probability (%) 1.38 Wildfires (grassland) 1.04 10 Storm surges Maximum inundation area (km2) 0.88 11 Sand and dust storms Energy of sand/dust storm (J/ m3) 0.31 Table 2 Hazard intensity index and weight of each hazard when calculating Expected Annual Intensity Index(Mh) 1 n i imin h i i imax imin h h M w h h      Natural Hazards where hi is the expected annual intensity index of hazard i—for example, the expected annual intensity of cold wave is the expectation of the largest temperature drop (°C) with return periods of 10, 20, 50, and 100 years at each 0.5°×0.5° grid unit (Shi and Kasperson 2015); himin and himax are the minimum and maximum values of the expected annual intensity of hazard i, respectively; wi is the weight of hazard i, which was calculated based on the frequency of hazards in EM-DAT (EM-DAT 2015) and Zheng (2009) Expected Annual Multi-hazard Intensity Index(Mh)
  • 13. 24-05-2016 3rd ASTAAG Meeting Methods Expected Annual Multi- hazard Intensity Index ( ) (National Unit Scale) Exposure GDPp, Population (0.5⁰×0.5⁰) 2005–2015, 2020–2030 Average Annual Affected Population Rate (National Unit Scale, 1980–2009) GDP Per Capita (GDPp) (National Unit Scale, 1980– 2009) Regression Model Mortality Risk and Affected Population Risk (0.5⁰×0.5⁰) 2005–2015, 2020–2030 Average Annual Mortality Rate (National Unit Scale, 1980–2009) Dependent Variable Independent VariableIndependent Variable Natural Factor Natural Factor Social Factor Social Factor Vulnerability Function AR = f (Mh, GDPp) MR = g (Mh, GDPp) Hazard Mh (0.5⁰×0.5⁰) Average Annual Mortality and Affected Population (National Unit Scale, 2010– 2014) ValidationValidation hM Framework Fig. 1 Flowchart for calculating the global mortality and affected population risks for multiple natural hazards
  • 14. 24-05-2016 3rd ASTAAG Meeting Methods Vulnerability function Social factor: Coping capacity index Natural factor: Mh Sig = 0.01; N = 171; R² = 0.65 0 1 2 3 4 5 6 7 8 9 10 0.00 10.00 20.00 30.00 40.00 50.00 60.00 INFORMIndex-LackofCopingCapacity GDP per capita, Purchasing Power Parity, 2014 [current international thousand $] Pearson's cc = -0.719  ,h pMR f M GDP  ,h pAR g M GDP where MR is the mortality rate for multiple natural hazards; AR is the affected population rate for multi-hazards; Fig. 2 Comparison of INFORM 2015 Lack of Coping Capacity Index with GDP per capita Source JRC (2014) Vulnerability is a measure of both the sensitivity of population to natural hazards and its ability to respond to and recover from the impacts of those hazards
  • 15. 24-05-2016 3rd ASTAAG Meeting Methods Vulnerability function MR/AR in EM-DAT disaster database between 1980 and 2009 was selected as training sample   6 ln 9.77 10 9.371 14.512p hMR GDP M          4 ln 1.58 10 7.73 5.984p hAR GDP M        Same database between 2010 and 2014 was selected as validation sample Pearson correlation coefficients of 0.45 (mortality) and 0.68 (affected population) (166 countries were included in the analysis since the mortality and affected population data of other countries are not recorded for this period) (Sig=0.01)
  • 16. 24-05-2016 3rd ASTAAG Meeting Methods Total Risk and validation where RM is the mortality risk for multiple natural hazards (persons per year); RA is the affected population risk for multiple natural hazards (persons per year); and POP is the total population of a country or region.  6 9.77 10 9.371 14.512p hGDP M MR POP e           4 1.58 10 7.73 5.984p hG A DP M R POP e          Expected Annual Multi- hazard Intensity Index ( ) (National Unit Scale) Exposure GDPp, Population (0.5⁰×0.5⁰) 2005–2015, 2020–2030 Average Annual Affected Population Rate (National Unit Scale, 1980–2009) GDP Per Capita (GDPp) (National Unit Scale, 1980– 2009) Regression Model Mortality Risk and Affected Population Risk (0.5⁰×0.5⁰) 2005–2015, 2020–2030 Average Annual Mortality Rate (National Unit Scale, 1980–2009) Dependent Variable Independent VariableIndependent Variable Natural Factor Natural Factor Social Factor Social Factor Vulnerability Function AR = f (Mh, GDPp) MR = g (Mh, GDPp) Hazard Mh (0.5⁰×0.5⁰) Average Annual Mortality and Affected Population (National Unit Scale, 2010– 2014) ValidationValidation hM
  • 17. 24-05-2016 3rd ASTAAG Meeting Methods Multiple Climatic Hazards MCh (National Unit Scale) POP, GDP and GDPP (0.5⁰×0.5⁰, 2015) GDP Per Capital (GDPp), Population (POP) (National Unit Scale, 1980–2009) Binary Linear Regression Model Mortality, Affected Population and GDP Loss Risk for Multiple Climatic Hazards (0.5⁰×0.5⁰) Average Annual Mortality Rate (National Unit Scale, 1980–2009) Dependent Variable Independent VariableIndependent Variable Climate FactorClimate Factor Social FactorSocial Factor AR = f (Mch, GDPp) MR = g (Mch, GDPp) GR= h (Mch, POP) MCh (0.5⁰×0.5⁰) Vulnerability Fuction Exposure CRI,Average Annual Death Toll, Affected Population and GDP Loss (National Unit Scale, 2010–2014) ValidationValidation Hazard Average Annual Affected Population Rate (National Unit Scale, 1980–2009) Average Annual GDP Loss Rate (National Unit Scale, 1980–2009)  5 1.32 10 6.10 15.48p chGDP M gridMR POP e          5 ( 1.28 10 7.20 7.77)p chGDP M gridAR POP e          5 ( 1.02 10 8.30 7.69)p chGDP M gridGR GDP e         where 𝑀𝑐ℎ is the average value of Multiple climatic hazards intensity of the country or region; RM is the expected annual mortality risk for multiple climatic hazards (people per year); RA is the expected annual affected population risk for multiple climatic hazards (people per year); RG is the expected annual GDP loss risk for multiple climatic hazards (USD per year); GDPgrid is GDP data at grid scale; and 𝑃𝑂𝑃𝑔𝑟𝑖𝑑is the population data at grid scale.
  • 18. 24-05-2016 3rd ASTAAG Meeting Results Global expected annual mortality rate for multiple natural hazards (2020–2030) 0.5°×0.5°
  • 19. 24-05-2016 3rd ASTAAG Meeting Results Global expected annual mortality risk for multiple natural hazards (2020–2030) 0.5°×0.5°
  • 20. 24-05-2016 3rd ASTAAG Meeting Results Global expected annual affected population rate for multiple natural hazards (2020–2030) 0.5°×0.5°
  • 21. 24-05-2016 3rd ASTAAG Meeting Results Global expected annual affected population risk for multiple natural hazards (2020–2030) 0.5°×0.5°
  • 22. 24-05-2016 3rd ASTAAG Meeting Results 𝑀ℎ Expected Annual Mortality Rate Expected Annual Affected Population Rate Rank Country Name Index† Value Rank Country Name Rate (per 105 people per year) Rank Country Name Rate (per 105 people per year) 1 Bangladesh 0.395 1 Philippines 3.57 1 Bangladesh 5329 2 Vietnam 0.340 2 Bangladesh 2.20 2 Philippines 5043 3 Laos 0.322 3 Vietnam 1.45 3 Vietnam 3237 4 Belize 0.322 4 Laos 1.16 4 Madagascar 2703 5 Guatemala 0.315 5 Japan 1.16 5 Laos 2702 6 Burma 0.303 6 Burma 1.08 6 Bhutan 2679 7 Philippines 0.301 7 South Korea 1.01 7 Guatemala 2094 8 South Korea 0.294 8 Belize 1.00 8 Burma 2058 9 Madagascar 0.286 9 Bhutan 0.98 9 Nepal 1885 10 Papua New Guinea 0.278 10 Madagascar 0.93 10 Dominican Republic 1852 Ranking of 𝑀ℎ, expected annual mortality rate, and expected annual affected population rate for multi-hazards at the national scale in descending order (2020–2030)
  • 23. 24-05-2016 3rd ASTAAG Meeting Results Global Expected Annual Mortality Rate for Multiple Climatic Hazards (0.5°×0.5°)
  • 24. 24-05-2016 3rd ASTAAG Meeting Results Global Expected Annual Affected Population Rate for Multiple Climatic Hazards (0.5°×0.5°)
  • 25. 24-05-2016 3rd ASTAAG Meeting Results Global Expected Annual GDP Loss Rate for Multiple Climatic Hazards (0.5°×0.5° )
  • 26. 24-05-2016 3rd ASTAAG Meeting Results Top fifteen countries with highest expected annual mortality rate, affected population rate and GDP loss rate for multiple climatic hazards Expected annual mortality rate Expected annual affected population rate Expected annual GDP loss rate Rank Country Name Per million people per year Rank Country Name Per thousand people per year Rank Country Name % per year 1 Philippines 6.87 1 Philippines 31.55 1 Philippines 7.53% 2 Bangladesh 4.16 2 Bangladesh 16.14 2 Bangladesh 3.05% 3 Vietnam 3.56 3 Vietnam 13.83 3 Vietnam 2.68% 4 Laos 2.61 4 Laos 9.49 4 Bhutan 1.66% 5 South Korea 2.47 5 South Korea 8.98 5 New Caledonia 1.66% 6 Madagascar 2.40 6 New Caledonia 8.91 6 Lao PDR 1.62% 7 Belize 2.38 7 Belize 8.49 7 Korea, Rep. 1.62% 8 New Caledonia 2.38 8 Madagascar 8.47 8 Japan 1.60% 9 Dominican Republic 2.08 9 Japan 8.13 9 Madagascar 1.53% 10 Japan 2.08 10 Dominican Republic 7.19 10 Belize 1.50% 11 Burma 2.02 11 Burma 7.08 11 China 1.33% 12 Papua New Guinea 1.88 12 Papua New Guinea 6.40 12 Dominican Republic 1.24% 13 Guatemala 1.76 13 Bhutan 6.09 13 Myanmar 1.16% 14 Bhutan 1.75 14 Guatemala 5.86 14 Papua New Guinea 1.12% 15 North Korea 1.60 15 China 5.44 15 Guatemala 0.94%
  • 27. 24-05-2016 3rd ASTAAG Meeting Validation 0 500 1000 1500 2000 2500 0 500 1000 1500 2000 2500 AverageAnnualDeathTolls (EM-DAT,2010-2014) Expected Annual Mortality Risk (Mch model) Person CC=0.898; Sig=0.01; N=123 Comparison of the expected annual mortality risk (𝑀𝑐ℎ model) and the historical disaster data in EM-DAT 0 2 4 6 8 10 0 2 4 6 8 10 AverageAnnualAffectedPopulation (EM-DAT,2010-2014) Millionpeolpe Expected Annual Affected Population Risk (Mch model) Million peolpe Person CC=0.940; Sig=0.01; N=123 Comparison of the expected annual affected population risk (Mch model) and the historical disaster data in EM-DAT
  • 28. 24-05-2016 3rd ASTAAG Meeting Validation 0 20 40 60 80 100 120 140 160 0 20 40 60 80 100 120 140 160 TherankofCRIeconomiclossscore1994-2013 The rank of the GDP loss score in Mch model Spearman CC= 0.737; Sig=0.01;N=135 Comparison of the rank of CRI (Germanwatch program) economic loss score and the rank of the GDP loss score in Mch model
  • 29. 24-05-2016 3rd ASTAAG Meeting OUTLINE Global Multiple Natural Hazards Risk Landscape Climate Change Regionalization in the World
  • 30. Temperature tendency Spatial distribution of temperature tendency values (1961–2010) Temperature data are from Monthly Mean Surface Dataset (2.5° resolution, from 01/1948 to present) of NCEP/NCAR Reanalysis provided by U.S. National Oceanic and Atmospheric Administration
  • 31. Temperature fluctuation Spatial distribution of temperature fluctuation values (1961–2010) Temperature data are from Monthly Mean Surface Dataset (2.5° resolution, from 01/1948 to present) of NCEP/NCAR Reanalysis provided by U.S. National Oceanic and Atmospheric Administration
  • 32. Precipitation tendency Spatial distribution of precipitation tendency values (1961–2010) Monthly Dataset (0.5° resolution, from 01/1901 to present) of GPCC provided by U.S. National Oceanic and Atmospheric Administration, while precipitation data of Antarctic continent is filled by NCEP/NCAR Reanalysis Dataset because of missing data.
  • 33. Precipitation fluctuation Spatial distribution of precipitation fluctuation values (1961–2010) Temperature data are from Monthly Mean Surface Dataset (2.5° resolution, from 01/1948 to present) of NCEP/NCAR Reanalysis provided by U.S. National Oceanic and Atmospheric Administration
  • 34. World Regionalization of Climate Change
  • 35. Regionalization unit Comparable geographic of world Use state or province level administrative regionalization of countries as the basic unit
  • 36. Global Land Elevation Global Land Elevation Global 30 Arc-Second Elevation dataset (1 kilometer resolution) provided by the United States Geological Survey (https://lta.cr.usgs.gov/GTOPO30).
  • 37. World Regionalization of Climate Change (1961-2010) World Regionalization of Climate Change
  • 38. World Regionalization of Climate Change (1961-2010) World Regionalization of Climate Change
  • 39. Confidence Test Classified statistic of proportion of area under different confidences among indicators (%)
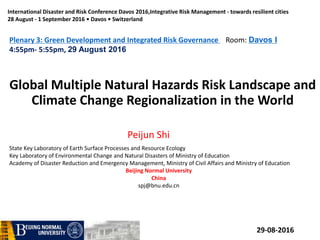
  • 40. Classification of Modes Classification of Modes of Climate Change of the world (1961-2010) Tendency and fluctuation of temperature and precipitation of the world are identified under the given confidence of 90% (significance level 0.1) Modes of Temperature Change (area proportion (%)) Modes of Precipitation Change (area proportion (%)) SHI Peijun etal., Article title: World Regionalization of Climate Change (1961–2010) , International Journal of Disaster Risk Science [J]. 2016,DOI: 10.1007/s13753-016-0094-5
  • 41. Trade-off risk (Trend) Uncertainty risk (Fluctuation) Extreme risk (extreme events) he composition of the climate change risk (Shi, 2014)
  • 42. Family Community Institu tes Governments Local Regiona lGloba l Place Integration Coordination Cooperation Construction Communication mitigation adaptatio n Government: Development and Disaster Reduction (Governance) Community: Safety Construction (Legislation) Institute: Risk Transformation (Mechanism) Family: Risk Awareness (Education) Forming integrated CCR governance paradigm
  • 43. Toward the measurement of synergistic adaptation by using the concept of Consilience (凝聚力) Government Institute Interprise Individual Nation City Province County Planning Finance Professional Civil State-owned Community Private Joint Venture Children Youth Middle-Ager Age Extraction Consilience Integreted System Communication Construction Cooperation Coordination Society Economy Culture Politics
  • 44. Consilience Model for Integrated DS Governance Consilience resilience vulnerabilityadaptation
  • 45. 社会—生态系统风险防范的“凝聚力模型 Consilience model for integrated social-ecosystem risk governance h b 构件间无摩擦情况: 极限荷载 ∝ W=bX2h3/6 构件间协同工作情况: 极限荷载 ∝ W=bX(2h)3/6 如果n个构件协同工作,极限荷载增加n2倍。 协同放大原理示意图 Collaborative amplification 假定,单根无缺陷承载力为100,有缺陷为50,那么, 系统A的极限承载力为50X4=200; 系统B的极限承载力至少100X3=300。 ① ② ③ ④ 系统A 系统B 协同分散原理示意图 Collaborative diversification 协同约束原理示意图 Collaborative constraint 协同宽容原理示意图 Collaborative tolerance 来源:http://www.hnhfgl.com/ps124.htm 工程中,为了使钢制绳索 满足大变形、抗冲击和易成卷 捆扎等需求,多股钢丝以一定 的规则绞合成钢绞线,钢绞线 的力学原理体现了本文所述 的“协同宽容”内涵。 具体表现在:(一)所有 钢丝遵循统一原则进行绞合, 体现对规则的宽容;(二)在 对规则宽容的前提下,整体钢 绞线形成对大变形和冲击荷 载更高的宽容性;(三)钢绞 线拥有单根钢丝所不具备的 良好的工作性能,极大提升其 包装、运输、应用方面的宽容 性。
  • 46. 24-05-2016 3rd ASTAAG Meeting 共识最高 成本最低 福利最大 风险最小 协同宽容 协同约束 协同放大 协同分散 社会认知 普及化 成本分摊 合理化 组合优化 智能化 费用效益 最大化 综 合 风 险 防 范 的 凝 聚 力 社 会 - 生 态 系 统 风险转移 基本设防 应急管理 救灾救济 备灾 重建 应急响应 恢复 综 合 风 险 防 范 协 同 运 作 制 度 设 计 经济结构 生态结构 产业结构 土地结构 生态系统 服务功能 区域发展 调节功能 环境友好 保护功能 资源节约 保障功能 目标 原理 实现手段 适应措施 制度调整 产出 社会-生态系统综合风险防范的凝聚力模式 Consilience mode of integrated risk governance for social – ecological systems
  • 47. 23-08-2016 1st ASTCDRR Discussion 1 n h i i i M H w    Expected Annual Multi-hazard Intensity Index(Mh) The weight of measurement methods led to different risk assessment. Hence, how to calculate the adequately Wi would be the key issue of natural hazards risk assessment. To achieve that, greater amounts of data and further research are needed. Peijun SHI, Xu Yang,Wei Xu, Jing’ai Wang. Mapping Global Mortality and Affected Population Risks for Multiple Natural Hazards [J]. International Journal of Disaster Risk Science, 2016, 7(1): 54-62. SHI Peijun, YANG Xu, FANG Jiayi, WANG Jing’ai, XU Wei, HAN Guoyi,Mapping and ranking global mortality, affected population and GDP loss risks for multiple climatic hazards [J]. Journal of Geographical Sciences, 2016, 26(7): 878-888.
  • 48. Discussion Disaster Risk Science is a multidisciplinary science that studys formation mechanism, dynamic change, assessment model, emergency response, and governance paradigm of disaster system. It may be classified into disaster science, emergency technology and risk management based on view of theory, methodology and technology.
  • 49. Peijun SHI, Xu Yang,Wei Xu, Jing’ai Wang. Mapping Global Mortality and Affected Population Risks for Multiple Natural Hazards [J]. International Journal of Disaster Risk Science, 2016, 7(1): 54-62. SHI Peijun, YANG Xu, FANG Jiayi, WANG Jing’ai, XU Wei, HAN Guoyi,Mapping and ranking global mortality, affected population and GDP loss risks for multiple climatic hazards [J]. Journal of Geographical Sciences, 2016, 26(7): 878- 888. SHI Peijun etal., Article title: World Regionalization of Climate Change (1961–2010) , International Journal of Disaster Risk Science [J]. 2016,DOI: 10.1007/s13753-016-0094-5 Peijun Shi, Ning Li, Qian Ye, Wenjie Dong, Guoyi Han, and Weihua Fang. Research on Integrated Disaster Risk Governance in the Context of Global Environmental Change[J]. International Journal of Disaster Risk Science, 2010,1(1): 17-23. Peijun Shi. On the role of government in integrated disaster risk governance— Based on practices in China. International Journal of Disaster Risk Science[J], 3(3)(2012):139-146 Pjun Shi, Qian Ye, Guoyi Han et al. Living with global climate diversity— suggestions on international governance for coping with climate change risk[J]. International Journal of Disaster Risk Science, 3(4)(2012):177-183. Peijun Shi, Jiabing Shuai, Wenfang Chen, Lili Lu. Study on Large-Scale Disaster Risk Assessment and Risk Transfer Models[J]. International Journal of Disaster Risk Science, 2010,1(2): 1-8. References

Hinweis der Redaktion

  1. So that’s all, hope you have a nice trip in SFO.