FOREIGN EXCHANGE COMMITTEE SEMI-ANNUAL FOREIGN EXCHANGE VOLUME SURVEY APRIL 2010
•
0 gefällt mir•114 views

FOREIGN EXCHANGE COMMITTEE SEMI-ANNUAL FOREIGN EXCHANGE VOLUME SURVEY APRIL 2010

Empfohlen
Weitere ähnliche Inhalte
Andere mochten auch
Andere mochten auch (11)
Ähnlich wie FOREIGN EXCHANGE COMMITTEE SEMI-ANNUAL FOREIGN EXCHANGE VOLUME SURVEY APRIL 2010
Ähnlich wie FOREIGN EXCHANGE COMMITTEE SEMI-ANNUAL FOREIGN EXCHANGE VOLUME SURVEY APRIL 2010 (20)
Mehr von Finance Magnates
Mehr von Finance Magnates (20)
Kürzlich hochgeladen
Kürzlich hochgeladen (20)
FOREIGN EXCHANGE COMMITTEE SEMI-ANNUAL FOREIGN EXCHANGE VOLUME SURVEY APRIL 2010
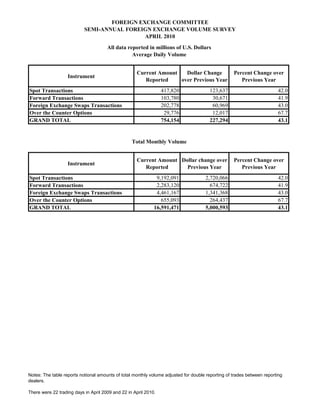
- 1. FOREIGN EXCHANGE COMMITTEE SEMI-ANNUAL FOREIGN EXCHANGE VOLUME SURVEY APRIL 2010 All data reported in millions of U.S. Dollars Average Daily Volume Instrument Current Amount Reported Dollar Change over Previous Year Percent Change over Previous Year Spot Transactions 417,820 123,637 42.0 Forward Transactions 103,780 30,671 41.9 Foreign Exchange Swaps Transactions 202,778 60,969 43.0 Over the Counter Options 29,776 12,017 67.7 GRAND TOTAL 754,154 227,294 43.1 Total Monthly Volume Instrument Current Amount Reported Dollar change over Previous Year Percent Change over Previous Year Spot Transactions 9,192,091 2,720,066 42.0 Forward Transactions 2,283,120 674,722 41.9 Foreign Exchange Swaps Transactions 4,461,167 1,341,368 43.0 Over the Counter Options 655,093 264,437 67.7 GRAND TOTAL 16,591,471 5,000,593 43.1 Notes: The table reports notional amounts of total monthly volume adjusted for double reporting of trades between reporting dealers. There were 22 trading days in April 2009 and 22 in April 2010.
- 2. FOREIGN EXCHANGE COMMITTEE SEMI-ANNUAL FOREIGN EXCHANGE VOLUME SURVEY APRIL 2010 1. TOTAL FOREIGN EXCHANGE VOLUME Millions of U.S. Dollars AVERAGE DAILY VOLUME a Current Instrument Amount Reported Spot transactions 417,820 Outright forwards 103,780 Foreign exchange swaps 202,778 Over-the-counter foreign exchange options 29,776 Total 754,154 TOTAL MONTHLY VOLUME a Current Instrument Amount Reported Spot transactions 9,192,091 Outright forwards 2,283,120 Foreign exchange swaps 4,461,167 Over-the-counter foreign exchange options 655,093 Total 16,591,471 a The data are adjusted for double reporting of trades between reporting dealers.
- 3. FOREIGN EXCHANGE COMMITTEE SEMI-ANNUAL FOREIGN EXCHANGE VOLUME SURVEY APRIL 2010 2a. SPOT TRANSACTIONS, Average Daily Volume Millions of U.S. Dollars Reporting Other Other financial Nonfinancial Currency Pair Dealers Dealers Customers Customers Total U.S. DOLLAR versus Euro 27,666 74,315 46,816 3,733 152,530 Japanese yen 12,034 25,834 17,924 1,125 56,917 British pound 6,966 18,785 12,565 1,279 39,595 Canadian dollar 6,043 13,009 9,221 1,424 29,697 Swiss franc 3,366 7,417 7,219 379 18,381 Australian dollar 5,214 11,113 10,865 545 27,737 Argentine peso 11 21 6 7 45 Brazilian real 584 1,408 750 259 3,001 Chilean peso 105 196 99 31 431 Mexican peso 2,549 4,217 2,239 270 9,275 All other currencies 3,519 6,266 6,754 1,477 18,016 EURO versus Japanese yen 3,136 8,357 5,535 233 17,261 British pound 2,281 6,496 3,725 301 12,803 Swiss franc 2,092 4,829 4,229 161 11,311 ALL OTHER CURRENCY PAIRS 4,491 9,288 6,251 790 20,820 Total a 80,057 191,551 134,198 12,014 417,820 Counterparty Notes: The table reports notional amounts of average daily volume adjusted for double reporting of trades between reporting dealers. The amounts are averaged over twenty two trading days in April. a Figures may not sum to totals due to rounding.
- 4. FOREIGN EXCHANGE COMMITTEE SEMI-ANNUAL FOREIGN EXCHANGE VOLUME SURVEY APRIL 2010 2b.OUTRIGHT FORWARDS, Average Daily Volume Millions of U.S. Dollars Reporting Other Other financial Nonfinancial Currency Pair Dealers Dealers Customers Customers Total U.S. DOLLAR versus Euro 2,213 2,838 13,454 5,209 23,714 Japanese yen 1,048 1,442 4,989 1,213 8,692 British pound 901 1,486 5,467 1,411 9,265 Canadian dollar 889 947 7,878 2,102 11,816 Swiss franc 278 278 1,958 553 3,067 Australian dollar 575 734 5,045 1,132 7,486 Argentine peso 46 62 38 14 160 Brazilian real 2,901 2,235 2,011 358 7,505 Chilean peso 514 829 300 58 1,701 Mexican peso 425 600 952 245 2,222 All other currencies 3,525 4,479 7,753 1,886 17,643 EURO versus Japanese yen 156 370 381 110 1,017 British pound 159 236 630 308 1,333 Swiss franc 107 138 425 183 853 ALL OTHER CURRENCY PAIRS 749 1,354 3,759 1,444 7,306 Total a 14,486 18,028 55,040 16,226 103,780 Counterparty Notes: The table reports notional amounts of average daily volume adjusted for double reporting of trades between reporting dealers. The amounts are averaged over twenty two trading days in April. a Figures may not sum to totals due to rounding.
- 5. FOREIGN EXCHANGE COMMITTEE SEMI-ANNUAL FOREIGN EXCHANGE VOLUME SURVEY APRIL 2010 2c.FOREIGN EXCHANGE SWAPS, Average Daily Volume Millions of U.S. Dollars Reporting Other Other financial Nonfinancial Currency Pair Dealers Dealers Customers Customers Total U.S. DOLLAR versus Euro 10,806 24,961 15,094 2,543 53,404 Japanese yen 6,177 11,566 7,480 1,579 26,802 British pound 3,991 10,358 5,464 712 20,525 Canadian dollar 6,291 18,713 7,741 2,378 35,123 Swiss franc 4,066 10,386 2,499 306 17,257 Australian dollar 3,018 5,374 3,716 494 12,602 Argentine peso 0 0 3 0 3 Brazilian real 52 19 95 12 178 Chilean peso 9 56 11 2 78 Mexican peso 2,633 4,544 2,137 380 9,694 All other currencies 3,666 9,352 5,577 1,151 19,746 EURO versus Japanese yen 12 120 174 23 329 British pound 416 741 590 198 1,945 Swiss franc 45 156 285 107 593 ALL OTHER CURRENCY PAIRS 270 1,871 1,883 475 4,499 Total a 41,452 98,217 52,749 10,360 202,778 Counterparty Notes: The table reports notional amounts of average daily volume adjusted for double reporting of trades between reporting dealers. The amounts are averaged over twenty two trading days in April. a Figures may not sum to totals due to rounding.
- 6. FOREIGN EXCHANGE COMMITTEE SEMI-ANNUAL FOREIGN EXCHANGE VOLUME SURVEY APRIL 2010 2d. OVER-THE-COUNTER FOREIGN EXCHANGE OPTIONS, Average Daily Volume Millions of U.S. Dollars Reporting Other Other financial Nonfinancial Currency Pair Dealers Dealers Customers Customers Total U.S. DOLLAR versus Euro 2,148 2,621 2,881 931 8,581 Japanese yen 997 685 1,689 789 4,160 British pound 295 351 423 205 1,274 Canadian dollar 408 504 337 290 1,539 Swiss franc 96 96 86 199 477 Australian dollar 420 323 366 162 1,271 Argentine peso 0 0 10 1 11 Brazilian real 464 372 346 177 1,359 Chilean peso 2 7 11 7 27 Mexican peso 302 157 120 131 710 All other currencies 959 739 2,042 621 4,361 EURO versus Japanese yen 141 155 345 127 768 British pound 237 208 356 104 905 Swiss franc 322 231 203 150 906 ALL OTHER CURRENCY PAIRS 975 806 1,065 581 3,427 Total a 7,766 7,255 10,280 4,475 29,776 Counterparty Notes: The table reports notional amounts of average daily volume adjusted for double reporting of trades between reporting dealers. The amounts are averaged over twenty two trading days in April. a Figures may not sum to totals due to rounding.
- 7. FOREIGN EXCHANGE COMMITTEE SEMI-ANNUAL FOREIGN EXCHANGE VOLUME SURVEY APRIL 2010 2e. AVERAGE DAILY VOLUME, by Execution Method and Currency Pair Millions of U.S. Dollars Interdealer Customer Electronic Brokering Electronic Trading Voice Total Number Currency Pair Direct Direct Systems Systems Broker Total of Trades U.S. DOLLAR versus Euro 25,181 90,543 44,824 75,678 44,835 281,061 123,082 Japanese yen 10,476 35,061 14,348 31,141 25,799 116,825 62862 British pound 7,610 20,755 16,692 24,852 12,901 82,810 40630 Canadian dollar 8,577 23,070 19,303 22,213 18,641 91,804 36539 Swiss franc 4,768 13,013 4,810 13,100 11,297 46,988 23889 Australian dollar 5,145 13,006 9,833 19,996 10,340 58,320 34018 Argentine peso 63 102 23 7 82 277 50 Brazilian real 4,529 6,461 1,240 585 3,226 16,041 1896 Chilean peso 552 993 319 50 953 2,867 393 Mexican peso 4,190 6,533 6,376 4,164 6,547 27,810 7892 All other currencies 9,942 21,234 10,337 12,598 17,324 71,435 25659 EURO versus Japanese yen 2,003 8,224 2,902 6,961 2,728 22,818 18090 British pound 1707 5353 5719 5734 1563 20,076 10757 Swiss franc 1347 5494 1870 5868 1648 16,227 8288 ALL OTHER CURRENCY PAIRS 4884 14600 5143 13698 4211 42,536 33171 Totala 90,974 264,442 143,739 236,645 162,095 897,895 427,216 Execution Method Notes: The amounts reported in the table are averaged over twenty two trading days in April and are not adjusted for double reporting of trades between reporting dealers. a Figures may not sum to totals due to rounding.
- 8. FOREIGN EXCHANGE COMMITTEE SEMI-ANNUAL FOREIGN EXCHANGE VOLUME SURVEY APRIL 2010 2f. AVERAGE DAILY VOLUME, by Execution Method, Instrument, and Counterparty Millions of U.S. Dollars Interdealer Customer Electronic Brokering Electronic Trading Voice Total Number Direct Direct Systems Systems Broker Total of Trades INSTRUMENT Spot transactions 39,883 138,279 95,947 167,768 55,995 497,872 389,010 Outright forwards 12,609 49,603 6,980 35,655 13,410 118,257 31,359 Foreign exchange swaps 29,517 58,406 38,690 32,481 85,134 244,228 5,123 OTC FX options 8,965 18,154 2,123 742 7,555 37,539 1,723 Total a 90,974 264,442 143,740 236,646 162,094 897,896 427,215 COUNTERPARTY Reporting dealers 90,974 0 60,452 73,936 62,139 287,501 127,603 Banks/other dealers 0 133,250 65,154 42,762 73,886 315,052 161,563 Other financial customers 0 100,015 15,726 111,961 24,566 252,268 118,374 Nonfinancial customers 0 31,177 2,408 7,988 1,504 43,077 19,675 Totala 90,974 264,442 143,740 236,647 162,095 897,898 427,215 Execution Method Notes: The amounts reported in the table are averaged over twenty two trading days in April and are not adjusted for double reporting of trades between reporting dealers.
- 9. FOREIGN EXCHANGE COMMITTEE SEMI-ANNUAL FOREIGN EXCHANGE VOLUME SURVEY APRIL 2010 3a. SPOT TRANSACTIONS, Total Monthly Volume Millions of U.S. Dollars Reporting Other Other financial Nonfinancial Currency Pair Dealers Dealers Customers Customers Total U.S. DOLLAR versus Euro 608,656 1,634,924 1,029,949 82,122 3,355,651 Japanese yen 264,740 568,359 394,337 24,760 1,252,196 British pound 153,253 413,271 276,420 28,143 871,087 Canadian dollar 132,951 286,201 202,870 31,330 653,352 Swiss franc 74,054 163,181 158,815 8,341 404,391 Australian dollar 114,706 244,479 239,025 11,993 610,203 Argentine peso 246 464 138 147 995 Brazilian real 12,852 30,970 16,506 5,706 66,034 Chilean peso 2,310 4,303 2,188 678 9,479 Mexican peso 56,077 92,774 49,268 5,942 204,061 All other currencies 77,417 137,859 148,586 32,492 396,354 EURO versus Japanese yen 68,995 183,844 121,766 5,127 379,732 British pound 50,190 142,918 81,947 6,612 281,667 Swiss franc 46,030 106,248 93,034 3,539 248,851 ALL OTHER CURRENCY PAIRS 98,795 204,335 137,519 17,389 458,038 Total a 1,761,272 4,214,130 2,952,368 264,321 9,192,091 Counterparty Notes: The table reports notional amounts of total monthly volume adjusted for double reporting of trades between reporting dealers. a Figures may not sum to totals due to rounding.
- 10. FOREIGN EXCHANGE COMMITTEE SEMI-ANNUAL FOREIGN EXCHANGE VOLUME SURVEY APRIL 2010 3b. OUTRIGHT FORWARDS, Total Monthly Volume Millions of U.S. Dollars Reporting Other Other financial Nonfinancial Currency Pair Dealers Dealers Customers Customers Total U.S. DOLLAR versus Euro 48,683 62,446 295,980 114,598 521,707 Japanese yen 23,045 31,734 109,748 26,686 191,213 British pound 19,824 32,684 120,271 31,046 203,825 Canadian dollar 19,551 20,837 173,325 46,240 259,953 Swiss franc 6,117 6,120 43,069 12,169 67,475 Australian dollar 12,654 16,137 110,992 24,896 164,679 Argentine peso 1,008 1,362 838 301 3,509 Brazilian real 63,815 49,161 44,232 7,871 165,079 Chilean peso 11,316 18,241 6,604 1,282 37,443 Mexican peso 9,352 13,208 20,937 5,398 48,895 All other currencies 77,557 98,530 170,576 41,491 388,154 EURO versus Japanese yen 3,424 8,144 8,383 2,413 22,364 British pound 3,508 5,198 13,851 6,767 29,324 Swiss franc 2,350 3,031 9,359 4,035 18,775 ALL OTHER CURRENCY PAIRS 16,473 29,792 82,696 31,764 160,725 Total a 318,677 396,625 1,210,861 356,957 2,283,120 Counterparty Notes: The table reports notional amounts of total monthly volume adjusted for double reporting of trades between reporting dealers. a Figures may not sum to totals due to rounding.
- 11. FOREIGN EXCHANGE COMMITTEE SEMI-ANNUAL FOREIGN EXCHANGE VOLUME SURVEY APRIL 2010 3c. FOREIGN EXCHANGE SWAPS, Total Monthly Volume Millions of U.S. Dollars Reporting Other Other financial Nonfinancial Currency Pair Dealers Dealers Customers Customers Total U.S. DOLLAR versus Euro 237,724 549,145 332,063 55,938 1,174,870 Japanese yen 135,894 254,452 164,570 34,730 589,646 British pound 87,804 227,885 120,203 15,658 451,550 Canadian dollar 138,401 411,683 170,297 52,321 772,702 Swiss franc 89,454 228,494 54,983 6,734 379,665 Australian dollar 66,389 118,224 81,763 10,866 277,242 Argentine peso 0 10 76 0 86 Brazilian real 1,143 408 2,085 270 3,906 Chilean peso 206 1,226 249 38 1,719 Mexican peso 57,923 99,975 47,012 8,362 213,272 All other currencies 80,658 205,751 122,691 25,323 434,423 EURO versus Japanese yen 272 2,632 3,839 511 7,254 British pound 9,146 16,308 12,977 4,365 42,796 Swiss franc 994 3,436 6,268 2,348 13,046 ALL OTHER CURRENCY PAIRS 5,951 41,159 41,424 10,456 98,990 Total a 911,959 2,160,788 1,160,500 227,920 4,461,167 Counterparty Notes: The table reports notional amounts of total monthly volume adjusted for double reporting of trades between reporting dealers. a Figures may not sum to totals due to rounding.
- 12. FOREIGN EXCHANGE COMMITTEE SEMI-ANNUAL FOREIGN EXCHANGE VOLUME SURVEY APRIL 2010 3d. OVER-THE-COUNTER FOREIGN EXCHANGE OPTIONS, Total Monthly Volume Millions of U.S. Dollars Reporting Other Other financial Nonfinancial Currency Pair Dealers Dealers Customers Customers Total U.S. DOLLAR versus Euro 47,267 57,658 63,381 20,489 188,795 Japanese yen 21,931 15,071 37,161 17,348 91,511 British pound 6,497 7,716 9,306 4,520 28,039 Canadian dollar 8,974 11,089 7,418 6,379 33,860 Swiss franc 2,103 2,121 1,895 4,386 10,505 Australian dollar 9,239 7,106 8,042 3,566 27,953 Argentine peso 0 0 225 30 255 Brazilian real 10,204 8,177 7,620 3,895 29,896 Chilean peso 53 144 240 147 584 Mexican peso 6,655 3,454 2,634 2,877 15,620 All other currencies 21,103 16,254 44,916 13,670 95,943 EURO versus Japanese yen 3,092 3,413 7,599 2,802 16,906 British pound 5,205 4,579 7,825 2,289 19,898 Swiss franc 7,080 5,077 4,465 3,303 19,925 ALL OTHER CURRENCY PAIRS 21,447 17,732 23,440 12,784 75,403 Total a 170,850 159,591 226,167 98,485 655,093 Counterparty Notes: The table reports notional amounts of total monthly volume adjusted for double reporting of trades between reporting dealers. a Figures may not sum to totals due to rounding.
- 13. FOREIGN EXCHANGE COMMITTEE SEMI-ANNUAL FOREIGN EXCHANGE VOLUME SURVEY APRIL 2010 3e. TOTAL MONTHLY VOLUME, by Execution Method and Currency Pair Millions of U.S. Dollars Interdealer Customer Electronic Brokering Electronic Trading Voice Total Number Currency Pair Direct Direct Systems Systems Broker Total of Trades U.S. DOLLAR versus Euro 553,975 1,991,937 986,118 1,664,917 986,368 6,183,315 2,707,801 Japanese yen 230,465 771,346 315,650 685,100 567,577 2,570,138 1,382,953 British pound 167,427 456,614 367,223 546,754 283,825 1,821,843 893,862 Canadian dollar 188,686 507,541 424,664 488,691 410,112 2,019,694 803,858 Swiss franc 104,902 286,291 105,813 288,195 248,525 1,033,726 525,558 Australian dollar 113,187 286,130 216,322 439,917 227,471 1,283,027 748,398 Argentine peso 1,395 2,243 514 145 1,793 6,090 1,090 Brazilian real 99,640 142,132 27,286 12,875 70,978 352,911 41,702 Chilean peso 12,148 21,852 7,028 1,104 20,965 63,097 8,643 Mexican peso 92,178 143,719 140,278 91,606 144,029 611,810 173,633 All other currencies 218,716 467,138 227,416 277,163 381,128 1,571,561 564,488 EURO versus Japanese yen 44,065 180,928 63,850 153,152 60,009 502,004 397,989 British pound 37557 117773 125823 126148 34396 441,697 236,661 Swiss franc 29636 120875 41150 129096 36261 357,018 182,339 ALL OTHER CURRENCY PAIRS 107452 321198 113146 301350 92639 935,785 729,759 Totala 2,001,429 5,817,717 3,162,281 5,206,213 3,566,076 19,753,716 9,398,734 Execution Method Notes: The amounts reported in the table are not adjusted for double reporting of trades between reporting dealers. a Figures may not sum to totals due to rounding.
- 14. FOREIGN EXCHANGE COMMITTEE SEMI-ANNUAL FOREIGN EXCHANGE VOLUME SURVEY APRIL 2010 3f. TOTAL MONTHLY VOLUME, by Execution Method, Instrument, and Counterparty Millions of U.S. Dollars Interdealer Customer Electronic Brokering Electronic Trading Voice Total Number Currency Pair Direct Direct Systems Systems Broker Total of Trades INSTRUMENT Spot transactions 877,436 3,042,140 2,110,830 3,690,895 1,231,897 10,953,198 8,558,220 Outright forwards 277,407 1,091,259 153,566 784,402 295,015 2,601,649 689,907 Foreign exchange swaps 649,366 1,284,930 851,178 714,590 1,872,953 5,373,017 112,705 OTC FX options 197,222 399,383 46,706 16,324 166,215 825,850 37,903 Total a 2,001,431 5,817,712 3,162,280 5,206,211 3,566,080 19,753,714 9,398,735 COUNTERPARTY Reporting dealers 2,001,432 0 1,329,934 1,626,583 1,367,056 6,325,005 2,807,272 Banks/other dealers 0 2,931,490 1,433,398 940,760 1,625,484 6,931,132 3,554,393 Other financial customers 0 2,200,336 345,977 2,463,136 540,448 5,549,897 2,604,225 Non-financial customers 0 685,886 52,968 175,736 33,089 947,679 432,844 Totala 2,001,432 5,817,712 3,162,277 5,206,215 3,566,077 19,753,713 9,398,734 Execution Method Notes: The amounts reported in the table are not adjusted for double reporting of trades between reporting dealers. a Figures may not sum to totals due to rounding.
- 15. FOREIGN EXCHANGE COMMITTEE SEMI-ANNUAL FOREIGN EXCHANGE VOLUME SURVEY APRIL 2010 4a. OUTRIGHT FORWARDS, Total Monthly Volume by Maturity Millions of U.S. Dollars Currency Pair Less Than One Month One Month to One Year More Than One Year U.S. DOLLAR versus Euro 350,300 214,090 5,990 Japanese yen 132,146 80,658 1,444 British pound 138,128 83,021 2,494 Canadian dollar 177,113 99,713 2,663 Swiss franc 48,853 23,951 775 Australian dollar 126,315 49,774 1,235 Argentine peso 1,848 2,452 212 Brazilian real 158,686 65,286 4,916 Chilean peso 24,453 22,715 1,582 Mexican peso 28,427 28,646 1,162 All other currencies 192,189 263,123 10,388 EURO versus Japanese yen 19,233 6,410 134 British pound 19,712 12,666 447 Swiss franc 13,080 7,974 61 ALL OTHER CURRENCY PAIRS 115,396 60,031 1,762 Total a 1,545,879 1,020,510 35,265 Maturity Notes: The table reports notional amounts of total monthly volume that are not adjusted for double reporting of trades between reporting dealers. a Figures may not sum to totals due to rounding.
- 16. FOREIGN EXCHANGE COMMITTEE SEMI-ANNUAL FOREIGN EXCHANGE VOLUME SURVEY APRIL 2010 4b. FOREIGN EXCHANGE SWAPS, Total Monthly Volume by Maturity Millions of U.S. Dollars Currency Pair Less Than One Month One Month to One Year More Than One Year U.S. DOLLAR versus Euro 1,098,620 296,782 17,187 Japanese yen 517,032 200,113 8,386 British pound 437,652 89,400 12,294 Canadian dollar 727,373 165,601 18,115 Swiss franc 324,477 131,106 13,525 Australian dollar 293,161 49,418 1,042 Argentine peso 13 73 0 Brazilian real 4,667 355 25 Chilean peso 327 1,329 268 Mexican peso 230,642 38,962 1,577 All other currencies 412,358 99,915 2,796 EURO versus Japanese yen 4,768 2,656 97 British pound 44,175 7,070 692 Swiss franc 6,684 6,318 1,031 ALL OTHER CURRENCY PAIRS 77,298 26,764 869 Total a 4,179,247 1,115,862 77,904 Maturity Notes: The table reports notional amounts of total monthly volume that are not adjusted for double reporting of trades between reporting dealers. a Figures may not sum to totals due to rounding.
- 17. FOREIGN EXCHANGE COMMITTEE SEMI-ANNUAL FOREIGN EXCHANGE VOLUME SURVEY APRIL 2010 4c. OVER-THE-COUNTER FOREIGN EXCHANGE OPTIONS, Total Monthly Volume by Maturity Millions of U.S. Dollars Currency Pair Less Than One Month One Month to One Year More Than One Year U.S. DOLLAR versus Euro 107,966 105,175 22,912 Japanese yen 49,027 48,147 16,260 British pound 14,339 16,749 3,441 Canadian dollar 21,097 15,961 5,765 Swiss franc 5,677 5,536 1,389 Australian dollar 23,113 11,979 2,091 Argentine peso 0 30 225 Brazilian real 20,107 15,982 4,006 Chilean peso 151 403 82 Mexican peso 9,039 10,108 3,123 All other currencies 45,263 51,535 20,240 EURO versus Japanese yen 8,320 9,953 1,719 British pound 12,368 9,542 3,186 Swiss franc 14,226 10,635 2,139 ALL OTHER CURRENCY PAIRS 35,908 43,476 17,458 Total a 366,601 355,211 104,036 Maturity Notes: The table reports notional amounts of total monthly volume that are not adjusted for double reporting of trades between reporting dealers. a Figures may not sum to totals due to rounding.