GMI proficiency testing- Progress report 2016
•Als PPTX, PDF herunterladen•
1 gefällt mir•386 views

http://www.fao.org/about/meetings/wgs-on-food-safety-management/en/ Progress report 2016: GMI proficiency testing: Presentation from the Technical Meeting on the impact of Whole Genome Sequencing (WGS) on food safety management -23-25 May 2016, Rome, Italy.

Empfohlen
Empfohlen
Weitere ähnliche Inhalte
Was ist angesagt?
Was ist angesagt? (20)
Andere mochten auch
Andere mochten auch (15)
Ähnlich wie GMI proficiency testing- Progress report 2016
Ähnlich wie GMI proficiency testing- Progress report 2016 (20)
Mehr von ExternalEvents
Mehr von ExternalEvents (20)
Kürzlich hochgeladen
Kürzlich hochgeladen (20)
GMI proficiency testing- Progress report 2016
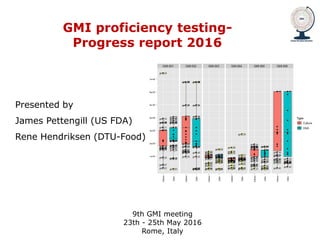
- 1. GMI proficiency testing- Progress report 2016 9th GMI meeting 23th - 25th May 2016 Rome, Italy Presented by James Pettengill (US FDA) Rene Hendriksen (DTU-Food)
- 2. Layout of the full roll out The PT consist of three components “Wet-lab” • 1a) DNA extraction, purification, library-preparation, and whole- genome-sequencing of six bacterial cultures; – two Salmonella strains – two Escherichia coli strains (only one was included) – two Staphylococcus aureus strains Upload reads to an ftp-site Optionally, identify MLST and resistance genes present in the strains • 1b) Whole-genome-sequencing of pre-prepared DNA of the same six bacterial strains mentioned in component 1a for comparison of DNA and library prep from component 1a “Dry-lab” • 2) Variant detection and phylogenetic/clustering analysis of three datasets fastq datasets from app. 20 genomes of S. Typhimurium, E. coli and S. aureus 2
- 3. 3 Updated draft Action Plan and Milestones for 2014/15 ”Full PT roll-out phase” Preparation of reference material Dispatch of reference materials Adjust documentation, prenotification, invitation letter, instructions (SOP) and guidelines for PT Final analysis (report) of the pilot PT Invitation for the full PT roll out Final analysis of the full roll PT Invitation for the full PT roll out Adjust documentation, prenotification, invitation letter, instructions (SOP) and guidelines for PT Preparation of reference material Dispatch of reference materials
- 4. Participation in the PT 49 participating labs in total
- 5. 5 1 June 2016 Survey to capture technical and background information - component 2, wet-lab
- 6. Measured QC parameters – component 2 - wet-lab • Number of reads • Average read length • Number of reads mapped to – reference DNA sequence – reference chromosome – reference plasmid #1 – reference plasmid #2 – reference plasmid #3 • Proportion of reads mapped to the above • Depth of coverage, of the above • Size of assembled genome • Size of assembled genome per total size of DNA sequence (%) • Total number of contigs • Number of contigs > 200 bp • N50 • NG50 6 1 June 2016
- 7. Size of assembled genome per total size of DNA sequence (%) 7 1 June 2016 The proportion of contigs, which map directly to the closed genome (same strain). This cannot exceed 100%. 100%
- 8. N50 8 1 June 2016 The N50 length is defined as the length for which the collection of all contigs of that length or longer contains at least half of the sum of the lengths of all contigs, and for which the collection of all contigs of that length or shorter also contains at least half of the sum of the lengths of all contigs. A N50 more than 15000 normally indicate good quality. 300.000 15.000 700.000
- 9. Total number of contigs 9 1 June 2016 The total number of contigs assembled. A number of contigs less than 1000 normally indicate good quality. 1000
- 10. Proportion of reads mapped to reference DNA sequence (%) 10 1 June 2016 The proportion of reads produced which map directly to the closed genome (same strain). This cannot exceed more than 100%. 100%
- 11. SNP analysis of the different QC strains 11 1 June 2016
- 12. Participant feedback - component 2, wet-lab 12 1 June 2016
- 13. Analysis of the - component 2, wet-lab • All outliers will be removed from the final analysis to suggest tentative QC thresholds • To suggest tentative QC thresholds, QC data will be related to MLST and AMR “ref.” data analysis, SNP analysis, as well as technical / background data • Provided MLST and AMR data will be analyzed in relation to “ref.” data to evaluate the performance of bioinformatic tool utilized for the PT 13 1 June 2016
- 14. Dry-lab 14 The objective: • Assess the differences that exists in the detection of variants (e.g., single nucleotide polymorphisms (SNPs)) from the analysis of whole genome sequence data. • Participants were provided 3 datasets to analyze with the current protocol implemented in their lab Submitted by participants: 1. Answer an online survey 2. Fasta formatted matrix of variants 3. Newick formatted tree (phylogeny) file. Formatting issues
- 16. Dry-lab Survey results: a diversity of methods and decisions 16
- 17. Dry-lab 17 Figure3. Violin plotsof thecorrelationsin thepairwisedistancebetween samplesamong thedifferent SNP matrices. 0.00 0.25 0.50 0.75 1.00 ST SA EC Taxon CorrelationinNumberofSNPdifferences Results of the analysis of fasta matrices Labs congruent Labs incongruent 1 June 2016
- 18. Dry-lab 18 Results of the analysis of newick tree files – trees are pretty different 1 June 2016
- 19. 19 1 June 2016 Dry-lab Summary and key findings: • A total of 190 results files were submitted with a relatively even distribution across the three taxonomic groups and file type (fasta or newick tree) • Not surprisingly, there are a diversity of algorithms being employed (e.g., map reads and infer a phylogeny) • Participants also differed in the choices they made with respect to quality filtering and contamination checking • The number of positions within the different fasta matrices differed greatly but they seem to carry similar information content in terms of the relative magnitude of differences between samples • The trees differed greatly • What does this mean for traceback? • Should we capture different information to compare results (e.g., positions within the reference)?
- 20. Acknowledgement and Supported by 20 01-06-2016 Susanne Karlsmose (DTU Food) Oksana Lukjancenko (DTU Food) Charlotte Ingvorsen (DTU Food) Pimlapas Leekitcharoenphon (DTU Food) Rolf Sommer Kaas (DTU Food) Inge Marianne Hansen (DTU Food) Jose Luis Bellod Cisneros (DTU Systems Biology) Anthony Underwood (PHE) Division of Microbiology (CFSAN/FDA) Brian Beck (Microbiologics) Isabel Cuesta de la plaza (ISCIII) Angel Zaballos (ISCIII) Jorge De La Barrera Martinez (ISCIII) …..and the rest of WG 4 (“advisory group”)
- 21. DTU Food, Technical University of Denmark Thank you for your attention
Hinweis der Redaktion
- 1