Protection of soil from the loss of organic carbon by taking into account ero...
SiegelResearchPoster2014-Final
1. Pasture Mob Grazing Effects on Soil Carbon: A Modeling Case Study of Snowville Creamery
Introduction
Land use for modern, high-‐‑yield agriculture has led to losses of 50-‐‑70% or 40-‐‑90 Pg worldwide of soil’s pre
modern agriculture organic carbon (Lal, 2007; Smith, 2008a). With application of best-‐‑management practices,
global agricultural soils have the potential to sequester 0.9 ± 0.3 Pg C per year in the short term (Lal, 2004 a, b).
This represents the largest potential sink after the oceans and could significantly reduce the global increase in
atmospheric CO2, equivalent to 5-‐‑15% of fossil fuel emissions (Lal, 2004 a, b). We studied a pasture-‐‑grazed dairy
operation in Meigs County, OH, self-‐‑promoted as a sustainable yet high-‐‑yield creamery, to determine whether
their grazing and manuring practices have improved soil quality and sequestered soil carbon.
The first element of the study measured current soil carbon from creamery grazed pastures of 15-‐‑20 years and
nearby ungrazed pastures and lawns for comparison. The farm is called The Brick, for its reddish, eroded and
impoverished soils when the dairy was established in 1998. Unfortunately we did not locate modern land use
and soil conditions reflective of that time. The second element of the project utilized DNDC (Denitrification
Decomposition), an agricultural process-‐‑based biogeochemical modeling program, to simulate past and project
future outputs of the farm given current practices. The model uses soil climate, agricultural management
practices, crop growth, and decomposition parameters to predict soil physical and chemical conditions and
nitrification, denitrification and fermentation submodels to predict gas emissions (Li 2000, User’s Guide 2009).
Procedures
Field Sampling
Ø 2-‐‑4 sampling sites chosen from selected fields, dependent on field size, focusing on
uplands of low to moderate slope.
Ø Four 1.8 cm diameter cores spaced ~2 m apart collected from each site. Cores sampled at
0-‐‑20 cm and 20-‐‑50 cm depths.
20 cm
Ø GPS coordinates, slope angle and field conditions were recorded.
Loss on Ignition: Measuring Soil Organic Carbon
Ø Soil samples air dried and ground to pass a 2mm sieve, a subsample then heated at 105°C overnight to
determine water content.
Ø A subsample ground to <0.25mm and a ~3g sample weighed on analytical balance, heated in muffle furnace
at 450°C for 4 hours, cooled to 250°C, moved to desiccator to cool to room temperature without gaining
moisture, then reweighed to determine loss of organic carbon. (C6H12O6 (OM) + 6O2 + Heat à 6CO2 + 6H2O)
(Anderson and Krysell 2005, Konare et al. 2010).
Denitrification-‐‑Decomposition Model
A process-‐‑driven model of C and N biogeochemistry that integrates 4 submodels based on input parameters (User’s Guide 2009).
Submodels
1. Thermal-‐‑hydraulic: soil temperature and moisture, from mean daily temperature records and daily rainfall events.
2. Plant growth: biomass partitioning, C/N ratios, N uptake, and water demand/stress.
3. Denitrification: N leaching and denitrification rates (NO, N2O and N2 production under saturated or reducing conditions).
4. Decomposition: microbial biomass, plant residue, ammonia volatilization, and ammonium mineralization, nitrification, humad and humus formation. Plant C
is lost to CO2, SOC and fermentation-‐‑producing CH4.
Model Inputs
Daily temperature and precipitation data for Athens, OH, about 15 miles from the creamery (hhp://www.ncdc.noaa.gov/).
Land management and plant growth parameters, such as grazing intensity and timing, additional plantings of grasses and legumes, field fertilization, and manure
additions based on farmer interviews. Biomass partitioning, N fixation indices, water demands and maximum yields of grasses taken from literature review and
DNDC standard values.
Sample Sites
The Brick Farm, and Bill Dix and Stacy
Hall’s Farm
Grazed Pasture Sampling Sites
Ø One site (Bill Dix and Stacy Hall’s farm on Rainbow
Lake Road in Shade, OH, not shown on map)
rotationally grazed as dairy since 1993. The remainder
of sites from the Brick Farm on OH 143 north of
Pomeroy, OH) grazed since 1998—shown on map as
white markers.
Ø Soils of Upshur-‐‑Gilpin complex. The Upshur silty clay
has shale parent material and the Gilpin silt loam to
channery silt loam has parent material of interbedded
shale, siltstone and some sandstone (Web Soil Survey).
Ø Pastures presently “mob” rotationally grazed with an
average of 240 cows. Milked every 12 hours and given
a fresh field to graze afterwards. Graze all day during
late spring to fall, graze half day in early spring and
late fall, and given hay in paddock/barn during most
winter months.
Ø Winter manure from their shelter mixed with sawdust,
piled and composed, then spread in 2” layer onto
about 6 ha each year.
Ø Additional clover sowed in fields every 3 years.
Non-‐‑Dairy Sampling Sites
Ø Two sites of residential lawns on farm property that
were mowed, never grazed, and one site of fallow
pasture, ungrazed, adjacent to the Brick pastures—
shown in maps as yellow markers.
Ø One site of horse-‐‑grazed pasture adjacent to Dix-‐‑Hall’s
property for comparison, though lihle known of
history or management of land (not shown on map).
Range of % C of the Brick samples (grazed 15 years)
and Dix-‐‑Hall Farm (grazed 20 years) in comparison
to model projections with different initial % C
Initial %C in 0-‐‑20 cm depth interval
Average 2.69%
Average 3.16%
6!
5!
4!
3!
2!
1!
0!
0! 5! 10! 15! 20! 25! 30!
% Carbon
Time (years)
1.3% C!
1% C!
0.75% C!
Grazed 15 years!
Grazed 20 years!
7!
6!
5!
4!
3!
2!
1!
0!
SOC (0-‐‑20 cm) modeled by DNDC
150 cows (0-‐‑10 years) 240 cows (10-‐‑30 years)
Manuring at year 6 and 26
Initial %C in 0-‐‑20 cm depth interval
0! 5! 10! 15! 20! 25! 30!
% Carbon
Time (years)
1.9% C!
1.6% C!
1.3 % C!
1% C!
0.75% C!
0.5% C!
0.25% C!
Present day (2014)
Emily Siegel, advised by Tod Frolking
Department of Geosciences, Denison University
Discussion
Initial SOC levels came from OSU soil data of the same soil series
sampled 30-‐‑40 years ago in counties surrounding the farm. We estimate
that the Brick soils may have had similar SOC values (~1.5% C), or
could have had lower values with severe erosion of A horizons (~0.75%
C). Using these initial C percentages, DNDC shows how Snowville’s
management changes SOC over their 20 years of management, with 10
years of projected values.
Smith (2008b) suggests that proper grazing intensity can improve soil
carbon more than ungrazed or overgrazed pastures. My research
concludes through DNDC modeling and soil samples that the mob
grazing of the creamery does not drastically improve soil carbon in
comparison to ungrazed fields. The creamery has improved soil quality
by increasing SOC, yet no more than other observed practices. Our
study was concentrated on soil carbon, yet these analyses could be
applied to track gas fluxes or grass yields.
Further Research
Use DNDC to model optimal mob grazing practices to improve C
sequestration capacity to equal that of nongrazing.
Track manure amendment timing to test if it could be applied more
often without raising gas emissions.
DNDC simulated outputs of model run
Climate
variables
Works Cited
Anderson, K.J. and M. Krystell. Dry maher (DM), loss on ignition (LOI), and total organic carbon (TOC): Report on an evaluation study. Horizontal 17 (2005).
Dyer, J. Land-‐‑use legacies in a central Appalachian forest: differential response of trees and herbs to historic agricultural practices. Applied Vegetation Science 13 (2010): 195-‐‑206.
Konare, H., R. S. Yost, M. Doumbia, G.W. McCarty, A. Jarju and R. Kablan. Loss on ignition: Measuring soil organic carbon of the Sahel, West Africa. African Journal of Agricultrual Research Vol. 5 (2010), 22:
3088-‐‑3095.
Lal, R. Soil carbon sequestration to mitigate climate change. Geoderma 123 (2004):1–22.
Lal, R. Soil carbon sequestration impacts on global climate change and food security. Science 304 (2004b):1623–1627.
Lal, R. Carbon management in agricultural soils. Mitigation and Adaptation Strategies for Global Change 12, (2007) no. 2:303 – 322.
Li, CS. Modeling trace gas emissions from agricultural ecosystems. Nutrient Cycling in Agroecosystems 58 (2000): 259-‐‑276.
User’s Guide for the DNDC Model. Institute for the Study of Earth, Oceans, and Space: University of New Hampshire. 2009.
Smith, P. Land use change and soil organic carbon dynamics. Nutrient Cycling in Agroecosystems 81, (2008a) no. 2:169-‐‑178.
Smith, P. Greenhouse gas mitigation in agriculture. Philosophical Transactions of the Royal Society B 363 (2008b): 789-‐‑813.
Tiev, N. Prime Pastures. Hay and Forage Grower 26, (2011) Issue 2: 11-‐‑12.
Web Soil Survey. USDA: National Resources Conservation Service. hhp://websoilsurvey.nrcs.usda.gov/app/HomePage.htm.
2.22%!
1.80%!
2.40%!
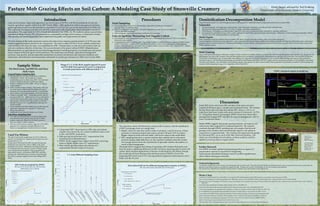
The map above shows The Brick farm at Snowville Creamery with the distribution
of SOC percentages from our sample sites.
Ø Higher values for sites near yard in center of property could be because of their
proximity to manure/compost pile (values around 3.38 and 3.74% in yellow)
Higher values in north and west fields, with lower values in the south fields.
Ø SOC sampling data show a spatial variation that could be due to soil parent
material causing slight differences in clay content or subsoil carbonate content.
Not enough known about the land history to speculate whether the pahern is a
result of land management.
The graph below suggests that timing of manuring with compost during the year
does not make a significant difference in SOC, however, manuring does increase soil
carbon. More frequent applications of manure would improve soil carbon, though
this would also increase nitrous oxide emissions (seen in DNDC). Even if the
beginning SOC levels were 0.75%, leaving pastures ungrazed would improve soil C
beher over the 30 years.
7!
6!
5!
4!
3!
2!
1!
0!
Soil carbon (0-‐‑20 cm) for different management scenarios in DNDC
150 cows (0-‐‑10 years), then 240 cows (10-‐‑30 years)
0! 5! 10! 15! 20! 25! 30!
% Carbon
Time (years)
Manuring at year 6 and 26
Other scenarios
Overlapping curves, due to no difference in
values of SOC from manuring timing
Present day (2014)
Acknowledgements
I would like to thank Snowville Creamery for participating with us in this study. Especially, Jeremiah Shields for taking the time to show us around the farm and accommodate our
interviews and Warren Taylor for the delicious yogurt and milk. Thanks to my advisor, Tod Frolking, for all of his assistance and guidance.
This research was funded by the Anderson Summer Science Program, I give many thanks for the opportunity.
Ø Using initial SOC values based on OSU data and subsoil
samples from Snowville, the current conditions seem to fall
in line with DNDC projections.
Ø Mob grazing has promoted soil C sequestration from
manuring and residual biomass.
Ø DNDC model suggest that a higher initial SOC percentage
leads to slightly higher rates of C sequestration.
Ø More intense grazing reduces the amount of C
sequestration (break in slope at 10 years).
Above: Cows
coming in from
pasture for
afternoon milking.
Left: Emily Siegel
taking soil core in
yard of Jeremiah
Shields, farm
manager, with his
herding dogs.
Soil carbon
partitioning
with depth
Biomass
partitioning
Gas fluxes
Soil thermo-‐‑
hydro chemistry
2.85%!
3.24%!
3.31%!
3.32%!
2.59%!
2.39%!
1.97%!
2.00%!
2.15%!
2.49%!
3.14%!
3.78%!
2.44%!
2.64%!
3.74%!
3.38%!
3.54%! 4.34%!
3.38%!
Land Use History
The pH of soils tested ranged from 4.7-‐‑6.9 in A Horizon
and 3.9-‐‑7.4 in B Horizon. Optimal pH for farms are near
neutral (pH 6.5-‐‑7.5).
Southeastern Ohio land was 90% forested during early
habitation and reduced by 25% in 1800’s as the rural
population increased. Subsistence farming practices led
to continual removal of forests, erosion of steeper lands
and widespread soil depletion. Peak population and
agricultural activity was between 1890-‐‑1910, and both
pasture and cultivated lands reverted to forest through
the 1900’s as people migrated from rural sehings (Dyer,
2010).
Mob Grazing
The practice of mob grazing for cahle puts a higher number of head on a smaller pasture, yet moves the cows through the pasture more quickly once the grasses are
fully grazed. For Snowville Creamery, they partition paddock size according to productivity of the grasses for each plot and rotate their cows (of 200-‐‑275 head for
120 hectares on the Brick) every 12 hours after each milking. It is important to monitor the pastures year-‐‑to-‐‑year to alter stocking rates and recovery periods for
each plot properly. The benefits of mob grazing can include increased grass utilization of 20-‐‑30%, longer recovery periods for pastures, no fly problems, more plant
diversity, and healthier soils with beher water-‐‑holding capacity since grasses are able to protect fields from evaporative losses beher in summer while keeping soils
warmer in fall and spring to keep micro-‐‑organisms active (Tiev 2011).
5.0!
4.5!
4.0!
3.5!
3.0!
2.5!
2.0!
1.5!
1.0!
0.5!
0.0!
% Carbon
% C from Different Sampling Areas